South Africa Wind Power LiDAR Market – Scenario 1: Using 100 % LiDAR
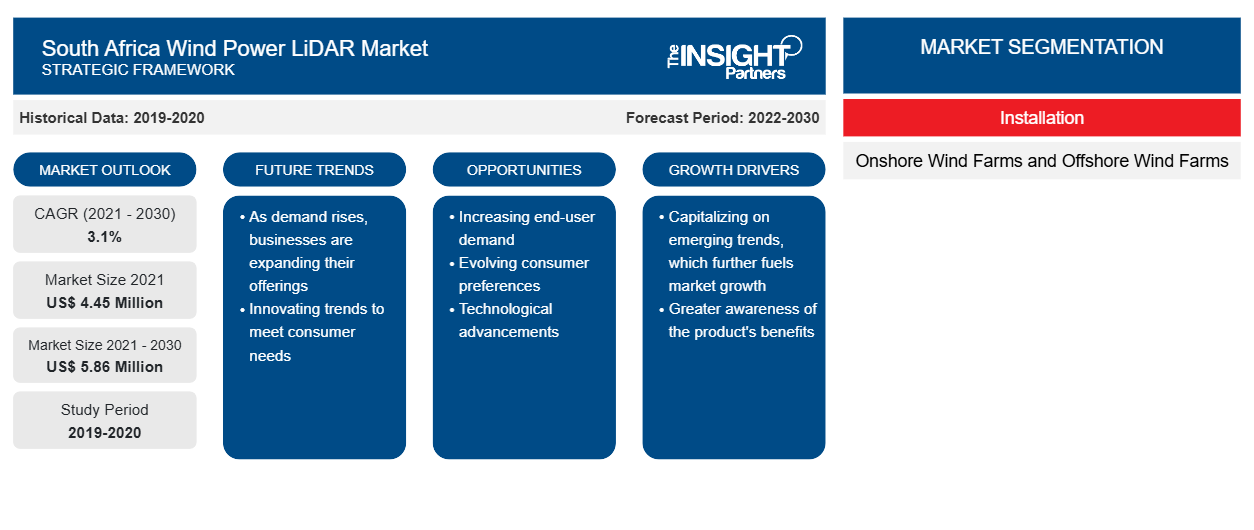
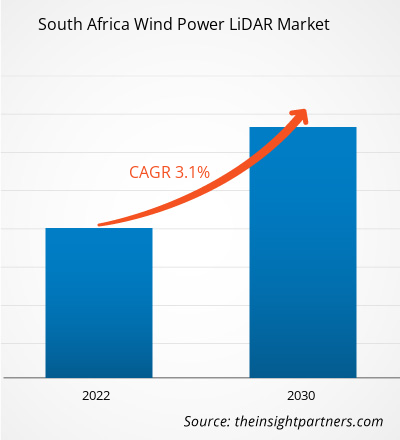
The South Africa Wind Power LiDAR market is expected to grow from US$ 4.45 million in 2021 to US$ 5.86 million by 2030; it is estimated to grow at a CAGR of 3.1% from 2021 to 2030.
South Africa Wind Power LiDAR Market – Scenario 2: Using 75 % LiDAR
The South Africa Wind Power LiDAR market is expected to grow from US$ 3.17 million in 2021 to US$ 3.76 million by 2030; it is estimated to grow at a CAGR of 1.9% from 2021 to 2030.
South Africa Wind Power LiDAR Market – Scenario 3: Using 50 % LiDAR
The South Africa Wind Power LiDAR market is expected to grow from US$ 2.23 million in 2021 to US$ 2.51 million by 2030; it is estimated to grow at a CAGR of 1.3% from 2021 to 2030.
The wind energy industry in South Africa is flourishing with the increasing focus on expanding renewable energy capacity. The LiDAR technology is employed in this industry to provide accurate wind speed and direction measurements to control rotor speed and other characteristics, including turbulence intensity, Weibull shape, scale factor, wind compass rose, and wind power density. These factors help wind farm developers make a reliable decision about the commencement of any project. Hence, LiDAR systems are widely adopted at onshore and offshore sites. Growing investments from independent power producers and public utilities for augmenting the power generation capacities of wind farms are further favoring the South Africa wind power LiDAR market growth. In March 2020, the South African government launched a 1.6 GW tender for wind capacity under the fifth round of a national campaign for renewables deployment. Moreover, as per the Integrated Resource Plan, 2019, the government has planned to install 14.4 GW of new renewable capacity; out of the planned total, ~4.8 GW will be set aside for wind power.
South Africa has opened bidding for 12 onshore wind farms with a combined capacity of over 1.6 GW in the November 2021 renewable energy tender. The bidders in the auction include Irish developer Mainstream Renewable Power, which secured a bid for 824MW of wind and 450MW of solar projects in the tender. Meanwhile, EDF Renewables has successfully achieved a bidder for 420 MW of wind capacity. Further, as per the South African Wind Energy Association (SAWEA), 25 projects were aligned to represent more than ~US$ 3.38 billion of investment in November 2021. Therefore, the growing investments in wind farm projects in South Africa underline a need to evaluate wind farms for efficient and optimum operations, which augments the demand for LiDAR systems for wind resource assessment.
Impact of COVID-19 Pandemic on South Africa Wind Power LiDAR Market
The COVID-19 pandemic dramatically impacted the global economy in 2020. The global crisis hampered business activities in the energy & power industry significantly. Growing investments in the renewable energy sector of South Africa make this country one of the key markets for the future growth of the wind power LiDAR market. Before the outbreak of COVID-19, the wind power LiDAR market in South Africa was experiencing substantial growth due to the rising demand for clean energy sources, with increasing favorable initiatives and supportive regulatory policies and regulations by governments. Before 2020, significant investment initiatives supported the development of onshore and offshore wind farm projects. Johannesburg, Pretoria, Western Cape, and Durban are the prominent cities in South Africa that held significant potential for wind farms. As per the data published by the South African Wind Energy Association, in 2020, the operational wind projects have resulted in a reduction in CO2 emissions by 53% of the total 12.1 metric tons of annual P50 projection by wind Independent Power Producers. However, the emergence of the COVID-19 pandemic led to decreased investments in wind farms, thereby limiting their installations, which hampered the South Africa wind power LiDAR market proliferation.
During the initial days of the COVID-19 pandemic, the crisis restricted all business deals, collaborations, and partnerships. However, with ease in restrictions and reopening of business units, discontinued projects were resumed. From the second half of 2020, original equipment manufacturers (OEMs) and Independent Power Producers began investing in the development of advanced LiDAR systems, leveraging the demand for a clean source of renewable energy. The pandemic has forced businesses to restructure their business models, focusing on strategies to strengthen their market shares. Therefore, although the South Africa wind power LiDAR market plummeted initially due to the adverse impact of the COVID-19 pandemic and the related social restrictions, it has made a strong recovery since 2021.
Government initiatives supporting the revival of businesses and rising investments by several governments are likely to drive the South Africa wind power LiDAR market's growth after the COVID-19 pandemic. Economic stimulus packages prepared by South Africa mention companies/institutions in the energy sector, especially the renewable energies sector. The South African government took several measures to bolster its economy through stimulus packages. For instance, in June 2020, a US$ 34.46 billion economic response package was granted by the South African government. Moreover, the construction projects of new energy facilities in the renewable energy sector were delayed or discontinued indefinitely in 2020. Implementing lockdowns in South Africa was challenging because a huge portion of the population is engaged in informal sector activities for their livelihoods, has inadequate water and electricity infrastructures, and has higher risks of economic recession. Thus, the COVID-19 pandemic hampered the country's economic stability, which led to the delay and suspension of ongoing wind farm projects. Thus, the recovery of various enterprises from the repercussions of the COVID-19 pandemic was challenging, which restricted the growth prospects of the wind power LiDAR market in South Africa.
As per the study conducted by the South African Wind Energy Association, the government of South Africa is estimated to invest in new wind farms, especially in offshore wind projects, which is expected to boost the demand for wind power LiDAR from 2022. Further, in November 2021, the South African government allocated 12 onshore wind farms to the preferred bidder with a combined capacity of just over ~1.6GW.
South Africa Wind Power LiDAR Market Insights
Growing Investments in Deploying New Wind Farms
Growing investment in deploying new wind farm projects and significant initiatives to mitigate carbon footprint boost the demand for wind power LiDAR technology in South Africa. South African government has issued stringent regulations and policies related to carbon emissions, which eventually promote the adoption of clean energy, including wind energy. For instance, in November 2021, the US joined Britain, France, Germany, and the European Union in a multi-billion dollar partnership to help South Africa achieve a quicker transition from coal to renewable energy, with an investment of US$ 8.5 billion. A report published by the International Finance Corporation (IFC) shows that Africa has 59,000 GW of onshore and offshore wind potential to meet the continent's energy demand. Building new wind farms to utilize its vast wind resources will create demand for clean energy and critical infrastructure and help support thriving local economies while meeting the sustainable development goals of the country.
In January 2022, EDF Renewables had planned to develop the Phezukomoya Wind Energy Facility of 140 MW capacity in Northern Cape, South Africa, which is expected to start commissioning in April 2024. The project consists of 35 turbines with an investment of ~US$ 255 million. In March 2022, Chariot, an African energy company, and Total Eren, a French renewables developer, collaborated to develop a 430 MW solar and wind project for a mining company in Zambia. The construction of this project is likely to begin in 2023. Further, in January 2022, Brandvalley Wind Farm is a 140MW onshore wind power project, which is expected to get commissioned in April 2024. As per the IFC report, Africa possesses an incredible onshore wind potential of ~180,000 Terawatt hours (TWh) per annum. Moreover, Algeria has the highest resource, with a total potential of 7,700 GW, equivalent to more than 11 times the current global installed wind capacity. Under the renewable independent power producer program, more than ~6,000 MW of generation capacity was allocated to bidders across wind and solar energy in July 2021. Thus, favorable government programs, increasing investments in wind power projects, and reduced cost of wind energy have bolstered the adoption of wind energy, thereby driving the South Africa wind power LiDAR market growth.
Installation-Based South Africa Wind Power LiDAR Market Insights
South Africa Wind Power LiDAR Market – Scenario 1: Using 100% LiDAR
Based on installation, the South Africa wind power LiDAR market is bifurcated into onshore wind farms and offshore wind farms. In 2021, the onshore wind farms segment led the South Africa wind power LiDAR market, accounting for a larger share in the market.
South Africa Wind Power LiDAR Market – Scenario 2: Using 75% LiDAR
Based on installation, the South Africa wind power LiDAR market is bifurcated into onshore wind farms and offshore wind farms. In 2021, the onshore wind farms segment led the South Africa wind power LiDAR market, accounting for a larger share in the market.
South Africa Wind Power LiDAR Market – Scenario 3: Using 50% LiDAR
Based on installation, the South Africa wind power LiDAR market is bifurcated into onshore wind farms and offshore wind farms. In 2021, the onshore wind farms segment led the South Africa wind power LiDAR market, accounting for a larger share in the market.
Customize This Report To Suit Your Requirement
You will get customization on any report - free of charge - including parts of this report, or country-level analysis, Excel Data pack, as well as avail great offers and discounts for start-ups & universities
South Africa Wind Power LiDAR Market: Strategic Insights
- Get Top Key Market Trends of this report.This FREE sample will include data analysis, ranging from market trends to estimates and forecasts.
The players operating in the South Africa wind power LiDAR market adopt strategies such as mergers, acquisitions, and market initiatives to maintain their positions in the market. A few developments by key market players are listed below:
- In January 2022, Vaisala acquired US-based AerisWeather. The acquisition supports the execution of Vaisala's Weather and Environment business area's strategy to drive growth in Data as a Service and Software as a Service recurring revenue businesses.
- In November 2021, Cooperation between Vaisala and Unikie improved the real-time situational awareness of ports with hyperlocal weather insights.
Company Profiles
- AWEK microdata GmbH
- Clover Network, Inc.
- dascus GmbH
- Dotypos
- GK Software SE
- LightSpeed Commerce Inc.
- orderbird AG
- ready2order GmbH
- Shore GmbH
- Block, Inc.
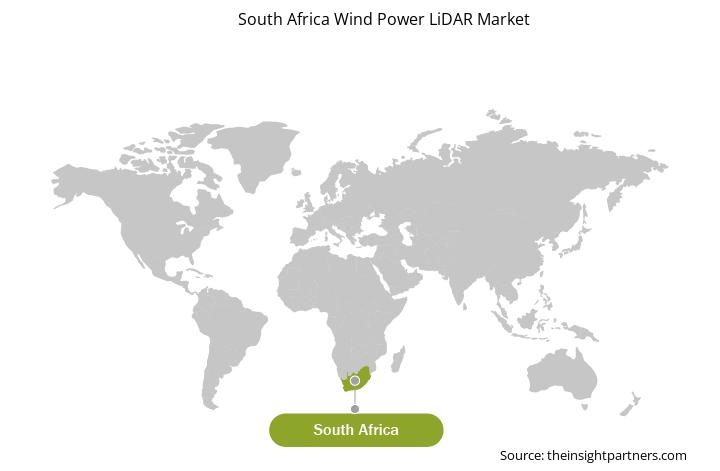
South Africa Wind Power LiDAR Market Regional Insights
The regional trends and factors influencing the South Africa Wind Power LiDAR Market throughout the forecast period have been thoroughly explained by the analysts at Insight Partners. This section also discusses South Africa Wind Power LiDAR Market segments and geography across North America, Europe, Asia Pacific, Middle East and Africa, and South and Central America.
- Get the Regional Specific Data for South Africa Wind Power LiDAR Market
South Africa Wind Power LiDAR Market Report Scope
| Report Attribute | Details |
|---|---|
| Market size in 2021 | US$ 4.45 Million |
| Market Size by 2030 | US$ 5.86 Million |
| Global CAGR (2021 - 2030) | 3.1% |
| Historical Data | 2019-2020 |
| Forecast period | 2022-2030 |
| Segments Covered |
By Installation
|
| Regions and Countries Covered | South Africa
|
| Market leaders and key company profiles |
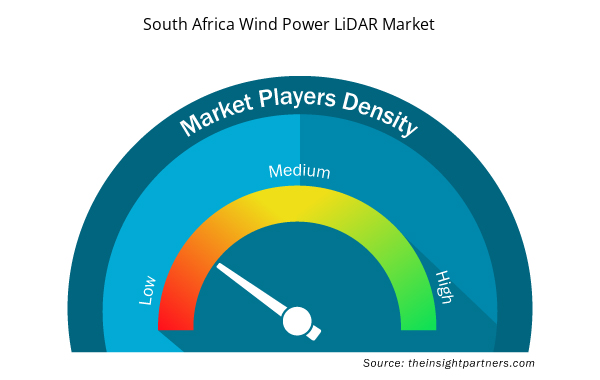
South Africa Wind Power LiDAR Market Players Density: Understanding Its Impact on Business Dynamics
The South Africa Wind Power LiDAR Market is growing rapidly, driven by increasing end-user demand due to factors such as evolving consumer preferences, technological advancements, and greater awareness of the product's benefits. As demand rises, businesses are expanding their offerings, innovating to meet consumer needs, and capitalizing on emerging trends, which further fuels market growth.
Market players density refers to the distribution of firms or companies operating within a particular market or industry. It indicates how many competitors (market players) are present in a given market space relative to its size or total market value.
Major Companies operating in the South Africa Wind Power LiDAR Market are:
- Vaisala
- NRG Systems
- Fugro
- John Wood Group PLC
- HALO Photonics
Disclaimer: The companies listed above are not ranked in any particular order.
- Get the South Africa Wind Power LiDAR Market top key players overview
- Historical Analysis (2 Years), Base Year, Forecast (7 Years) with CAGR
- PEST and SWOT Analysis
- Market Size Value / Volume - Global, Regional, Country
- Industry and Competitive Landscape
- Excel Dataset

Report Coverage
Revenue forecast, Company Analysis, Industry landscape, Growth factors, and Trends

Segment Covered
This text is related
to segments covered.

Regional Scope
North America, Europe, Asia Pacific, Middle East & Africa, South & Central America

Country Scope
This text is related
to country scope.
Trends and growth analysis reports related to Energy and Power : READ MORE..
- Vaisala
- NRG Systems
- Fugro
- John Wood Group PLC
- HALO Photonics
- Windar Photonics A/S
- ZX Lidars
- Everise Technology Ltd.
- Meatech Solutions LLP
- Velodyne
- Geo-Net South Africa PTY Ltd
- GeoWIND
 Get Free Sample For