Middle East & Africa and South America Drinking Water Adsorbents Market Trends by 2027
Middle East & Africa and South America Drinking Water Adsorbents Market Forecast to 2027 - COVID-19 Impact and Regional Analysis By Product (Zeolite, Clay, Activated Alumina, Activated Carbon, Manganese Oxide, Cellulose, Others)
- Report Date : May 2021
- Report Code : TIPRE00022106
- Category : Chemicals and Materials
- Status : Published
- Available Report Formats :


- No. of Pages : 104
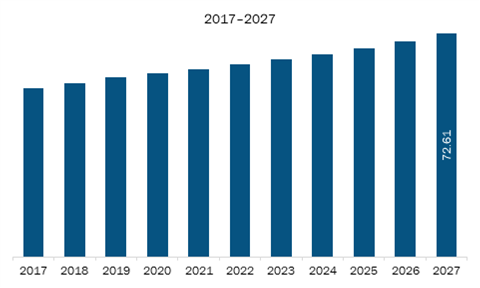
The drinking water adsorbents market in MEA is expected to grow from US$ 58.49 million in 2019 to US$ 72.61 million by 2027; it is estimated to grow at a CAGR of 2.8% from 2020 to 2027. Similarly, the drinking water adsorbents market in SAM is expected to grow from US$ 44.81 million in 2019 to US$ 57.25 million by 2027; it is estimated to grow at a CAGR of 3.2% from 2020 to 2027.
Bio-based adsorbents getting highly adopted is the major factor driving the MEA & SAM drinking water adsorbents market. Water quality has deteriorated over time, owing to the factors such as anthropogenic activity, unplanned urbanization, rapid industrialization, and unskilled use of natural water supplies. Further, increased awareness of the importance of providing impacts because of current environmental policies has moved the research community toward the creation of robust, economically viable, and environmentally sustainable processes capable of extracting pollutants from water while still protecting the health of populations. Owing to this, the demand for a few bio-based or organic adsorbents such as coconut shells, coal, and wood is growing in the drinking water adsorbents industry. Because of their superior adsorption performance, these products are highly useful in water quality management and purification. Further, they can also be used in a variety of applications for environmental preservation and regeneration. Moreover, bio-based adsorbents (also known as bio sorbents) are useful for purifying water as they can be generated from low-cost feedstocks, such as waste agricultural biomass or byproducts, have adsorption capacities comparable to other chemical adsorbents, and can be disposed of safely. Thus, the increasing focus on environment, which paves the way for the adoption of bio-based adsorbents, is emerging as a crucial trend in the MEA & SAM drinking water adsorbents market.
The ongoing COVID-19 pandemic is adversely impacting the MEA and SAM. Iran, Saudi Arabia, Qatar, South Africa, and the UAE are among the MEA countries with a high number of COVID-19 cases and deaths. These countries have experienced hindered economic and industrial growth in the past few months. The region comprises several growing economies such as the UAE, which are the prospective markets for drinking water adsorbents providers due to the presence of huge and diverse customer base. Most of the businesses in these countries have suspended their operations and are expected to operate with a slower pace. The MEA countries are taking significant containment measures to control the infection spread. The COVID-19 outbreak has severely affected the drinking water adsorbents market due to the shutdown of various drinking water adsorbents facilities in the MEA. In SAM, Brazil has reported the highest number of COVID-19 cases, followed by Ecuador, Peru, Chile, and Argentina, among others. The governments of SAM countries are taking several initiatives to protect people and control the spread of COVID-19 through lockdowns, trade bans, and travel restrictions. These measures are affecting their economic growth due to lower export revenues, both from the drop in commodity prices and reduction in export volumes. The outbreak has also resulted in the shutdown of production plants, which has impacted the growth of the chemical industries in SAM, thereby limiting the drinking water adsorbents market growth in the region.
With the new features and technologies, vendors can attract new customers and expand their footprints in emerging markets. This factor is likely to drive the MEA & SAM drinking water adsorbents market. The MEA & SAM drinking water adsorbents market is expected to grow at a good CAGR during the forecast period.
- Sample PDF showcases the content structure and the nature of the information with qualitative and quantitative analysis.
- Request discounts available for Start-Ups & Universities
MEA & SAM Drinking Water Adsorbents Market Segmentation
- Sample PDF showcases the content structure and the nature of the information with qualitative and quantitative analysis.
- Request discounts available for Start-Ups & Universities
MEA & SAM Drinking Water Adsorbents Market – By Product
- Zeolite
- Clay
- Activated Alumina
- Activated Carbon
- Manganese Oxide
- Cellulose
- Others
MEA & SAM Drinking Water Adsorbents Market, by Country
- MEA
- South Africa
- Saudi Arabia
- UAE
- Rest of MEA
- SAM
- Brazil
- Argentina
- Rest of SAM
MEA & SAM Drinking Water Adsorbents Market - Companies Mentioned
- BASF SE
- Dupont
- KURARAY CO. LTD
- Lenntech B.V.
- Purolite

Report Coverage
Revenue forecast, Company Analysis, Industry landscape, Growth factors, and Trends

Segment Covered
Product

Regional Scope
North America, Europe, Asia Pacific, Middle East & Africa, South & Central America

Country Scope
Saudi Arabia, Brazil, Argentina
1. Introduction
1.1 Study Scope
1.2 The Insight Partners Research Report Guidance
1.3 Market Segmentation
2. Key Takeaways
3. Research Methodology
3.1 Scope of the Study
3.2 Research Methodology
3.2.1 Data Collection:
3.2.2 Primary Interviews:
3.2.3 Hypothesis formulation:
3.2.4 Macro-economic factor analysis:
3.2.5 Developing base number:
3.2.6 Data Triangulation:
3.2.7 Country level data:
4. MEA & SAM Drinking Water Adsorbents Market Landscape
4.1 Market Overview
4.2 MEA PEST Analysis
4.3 SAM PEST Analysis
4.4 Expert Opinion
4.5 PFAS Water Pollution Problem and Potential Solutions
4.5.1 PFAS Overview and Water Pollution Problem
4.5.2 Potential Solutions To Address PFAS Contamination
5. MEA & SAM Drinking Water Adsorbents Market – Key Market Dynamics
5.1 Market Drivers
5.1.1 Activated Carbon Demand Rising
5.1.2 Favourable Government Initiatives Related to Drinking Water
5.2 Market Restraints
5.2.1 Presence of Substitutes
5.3 Market Opportunities
5.3.1 Rice Husk Derived Adsorbents Extensively Being Used for Water Purification
5.4 Future Trends
5.4.1 Bio-Based Adsorbents Getting Highly Adopted
5.5 Impact Analysis of Drivers and Restraints
6. Drinking Water Adsorbents Market – MEA & SAM Analysis
6.1 MEA Drinking Water Adsorbents Market Overview
6.2 MEA Drinking Water Adsorbents Market –Revenue and Forecast to 2027 (US$ Million)
6.3 SAM Drinking Water Adsorbents Market Overview
6.4 SAM Drinking Water Adsorbents Market –Revenue and Forecast to 2027 (US$ Million)
7. MEA & SAM Drinking Water Adsorbents Market Analysis – By Product
7.1 Overview
7.2 MEA Drinking Water Adsorbents Market, By Product (2019 and 2027)
7.3 SAM Drinking Water Adsorbents Market, By Product (2019 and 2027)
7.4 Zeolite
7.4.1 Overview
7.4.1.1 Zeolite: Drinking Water Adsorbents Market – Revenue, and Forecast to 2027 (US$ Million)
7.4.1.2 Zeolite: Drinking Water Adsorbents Market – Revenue, and Forecast to 2027 (US$ Million)
7.5 Clay
7.5.1 Overview
7.5.1.1 Clay: Drinking Water Adsorbents Market – Revenue, and Forecast to 2027 (US$ Million)
7.5.1.2 Clay: Drinking Water Adsorbents Market – Revenue, and Forecast to 2027 (US$ Million)
7.6 Activated Alumina
7.6.1 Overview
7.6.1.1 Activated Alumina: Drinking Water Adsorbents Market – Revenue, and Forecast to 2027 (US$ Million)
7.6.1.2 Activated Alumina: Drinking Water Adsorbents Market – Revenue, and Forecast to 2027 (US$ Million)
7.7 Activated Carbon
7.7.1 Overview
7.7.1.1 Activated Carbon: Drinking Water Adsorbents Market – Revenue, and Forecast to 2027 (US$ Million)
7.7.1.2 Activated Carbon: Drinking Water Adsorbents Market – Revenue, and Forecast to 2027 (US$ Million)
7.8 Manganese Oxide
7.8.1 Overview
7.8.1.1 Manganese Oxide: Drinking Water Adsorbents Market – Revenue, and Forecast to 2027 (US$ Million)
7.8.1.2 Manganese Oxide: Drinking Water Adsorbents Market – Revenue, and Forecast to 2027 (US$ Million)
7.9 Cellulose
7.9.1 Overview
7.9.1.1 Cellulose: Drinking Water Adsorbents Market – Revenue, and Forecast to 2027 (US$ Million)
7.9.1.2 Cellulose: Drinking Water Adsorbents Market – Revenue, and Forecast to 2027 (US$ Million)
7.10 Others
7.10.1 Overview
7.10.1.1 Others: Drinking Water Adsorbents Market – Revenue, and Forecast to 2027 (US$ Million)
7.10.1.2 Others: Drinking Water Adsorbents Market – Revenue, and Forecast to 2027 (US$ Million)
8. MEA Drinking Water Adsorbents Market – Country Analysis
8.1 Overview
8.1.1 MEA: Drinking Water Adsorbents Market, by Key Country
8.1.1.1 South Africa: Drinking Water Adsorbents Market – Revenue and Forecast to 2027 (US$ Million)
8.1.1.1.1 South Africa: Drinking Water Adsorbents Market, by Product
8.1.1.2 Saudi Arabia: Drinking Water Adsorbents Market – Revenue and Forecast to 2027 (US$ Million)
8.1.1.2.1 Saudi Arabia: Drinking Water Adsorbents Market, by Product
8.1.1.3 UAE: Drinking Water Adsorbents Market – Revenue and Forecast to 2027 (US$ Million)
8.1.1.3.1 UAE: Drinking Water Adsorbents Market, by Product
8.1.1.4 Rest of MEA: Drinking Water Adsorbents Market – Revenue and Forecast to 2027 (US$ Million)
8.1.1.4.1 Rest of MEA: Drinking Water Adsorbents Market, by Product
9. SAM Drinking Water Adsorbents Market – Country Analysis
9.1 Overview
9.1.1 SAM: Drinking Water Adsorbents Market, by Key Country
9.1.1.1 Brazil: Drinking Water Adsorbents Market – Revenue and Forecast to 2027 (US$ Million)
9.1.1.1.1 Brazil: Drinking Water Adsorbents Market, by Product
9.1.1.2 Argentina: Drinking Water Adsorbents Market – Revenue and Forecast to 2027 (US$ Million)
9.1.1.2.1 Argentina: Drinking Water Adsorbents Market, by Product
9.1.1.3 Rest of SAM: Drinking Water Adsorbents Market – Revenue and Forecast to 2027 (US$ Million)
9.1.1.3.1 Rest of SAM: Drinking Water Adsorbents Market, by Product
10. Impact of COVID-19 Pandemic on MEA & SAM Drinking Water Adsorbents Market
10.1 MEA: Impact Assessment of COVID-19 Pandemic
10.2 SAM: Impact Assessment of COVID-19 Pandemic
11. Company Profiles
11.1 BASF SE
11.1.1 Key Facts
11.1.2 Business Description
11.1.3 Products and Services
11.1.4 Financial Overview
11.1.5 SWOT Analysis
11.2 Dupont
11.2.1 Key Facts
11.2.2 Products and Services
11.2.3 Financial Overview
11.2.4 SWOT Analysis
11.3 KURARAY CO. LTD
11.3.1 Key Facts
11.3.2 Business Description
11.3.3 Products and Services
11.3.4 Financial Overview
11.3.5 SWOT Analysis
11.4 Lenntech B.V.
11.4.1 Key Facts
11.4.2 Business Description
11.4.3 Products And Services
11.4.4 Financial Overview
11.4.5 Swot Analysis
11.5 Purolite
11.5.1 Key Facts
11.5.2 Business Description
11.5.3 Products And Services
11.5.4 Financial Overview
11.5.5 Swot Analysis
12. Appendix
12.1 About The Insight Partners
12.2 Glossary
LIST OF TABLES
Table 1. MEA Drinking Water Adsorbents Market –Revenue and Forecast to 2027 (US$ Million)
Table 2. SAM Drinking Water Adsorbents Market –Revenue and Forecast to 2027 (US$ Million)
Table 3. South Africa Drinking Water Adsorbents Market, by Product – Revenue and Forecast to 2027 (USD Million)
Table 4. Saudi Arabia Drinking Water Adsorbents Market, by Product – Revenue and Forecast to 2027 (USD Million)
Table 5. UAE Drinking Water Adsorbents Market, by Product – Revenue and Forecast to 2027 (USD Million)
Table 6. Rest of MEA Drinking Water Adsorbents Market, by Product – Revenue and Forecast to 2027 (USD Million)
Table 7. Brazil Drinking Water Adsorbents Market, by Product – Revenue and Forecast to 2027 (USD Million)
Table 8. Argentina Drinking Water Adsorbents Market, by Product – Revenue and Forecast to 2027 (USD Million)
Table 9. Rest of South America Drinking Water Adsorbents Market, by Product – Revenue and Forecast to 2027 (USD Million)
Table 10. Glossary of Terms, Global Drinking Water Adsorbents Market
LIST OF FIGURES
Figure 1. MEA & SAM Drinking Water Adsorbents Market Segmentation
Figure 2. SAM & SAM Drinking Water Adsorbents Market Segmentation – By Country
Figure 3. Activated Carbon Segment Held Largest Share of MEA Drinking Water Adsorbents Market
Figure 4. Rest of MEA Held Largest Share of MEA Drinking Water Adsorbents Market
Figure 5. Activated Carbon Segment Held Largest Share of SAM Drinking Water Adsorbents Market
Figure 6. Brazil Held Largest Share of SAM Drinking Water Adsorbents Market
Figure 7. MEA: PEST Analysis
Figure 8. SAM: PEST Analysis
Figure 9. Expert Opinion
Figure 10. MEA & SAM Drinking Water Adsorbents Market Impact Analysis of Drivers and Restraints
Figure 11. MEA: Drinking Water Adsorbents Market – Revenue and Forecast to 2027 (US$ Million)
Figure 12. SAM: Drinking Water Adsorbents Market – Revenue and Forecast to 2027 (US$ Million)
Figure 13. MEA Drinking Water Adsorbents Market Revenue Share, by Product (2019 and 2027)
Figure 14. SAM Drinking Water Adsorbents Market Revenue Share, by Product (2019 and 2027)
Figure 15. MEA Zeolite: Drinking Water Adsorbents Market – Revenue, and Forecast to 2027 (US$ Million)
Figure 16. SAM Zeolite: Drinking Water Adsorbents Market – Revenue, and Forecast to 2027 (US$ Million)
Figure 17. MEA Clay: Drinking Water Adsorbents Market – Revenue, and Forecast to 2027 (US$ Million)
Figure 18. SAM Clay: Drinking Water Adsorbents Market – Revenue, and Forecast to 2027 (US$ Million)
Figure 19. MEA Activated Alumina: Drinking Water Adsorbents Market – Revenue, and Forecast to 2027 (US$ Million)
Figure 20. SAM Activated Alumina: Drinking Water Adsorbents Market – Revenue, and Forecast to 2027 (US$ Million)
Figure 21. MEA Activated Carbon: Drinking Water Adsorbents Market – Revenue, and Forecast to 2027 (US$ Million)
Figure 22. SAM Activated Carbon: Drinking Water Adsorbents Market – Revenue, and Forecast to 2027 (US$ Million)
Figure 23. MEA Manganese Oxide: Drinking Water Adsorbents Market – Revenue, and Forecast to 2027 (US$ Million)
Figure 24. SAM Manganese Oxide: Drinking Water Adsorbents Market – Revenue, and Forecast to 2027 (US$ Million)
Figure 25. MEA Cellulose: Drinking Water Adsorbents Market – Revenue, and Forecast to 2027 (US$ Million)
Figure 26. SAM Cellulose: Drinking Water Adsorbents Market – Revenue, and Forecast to 2027 (US$ Million)
Figure 27. MEA Others: Drinking Water Adsorbents Market – Revenue, and Forecast to 2027 (US$ Million)
Figure 28. SAM Others: Drinking Water Adsorbents Market – Revenue, and Forecast to 2027 (US$ Million)
Figure 29. MEA: Drinking Water Adsorbents Market, by Key Country – Revenue (2019) (US$ Million)
Figure 30. MEA: Drinking Water Adsorbents Market Revenue Share, by Key Country (2019 and 2027)
Figure 31. South Africa: Drinking Water Adsorbents Market – Revenue and Forecast to 2027 (US$ Million)
Figure 32. Saudi Arabia: Drinking Water Adsorbents Market – Revenue and Forecast to 2027 (US$ Million)
Figure 33. UAE: Drinking Water Adsorbents Market – Revenue and Forecast to 2027 (US$ Million)
Figure 34. Rest of MEA: Drinking Water Adsorbents Market – Revenue and Forecast to 2027 (US$ Million)
Figure 35. SAM: Drinking Water Adsorbents Market, by Key Country– Revenue (2019) (US$ Million)
Figure 36. SAM: Drinking Water Adsorbents Market Revenue Share, by Key Country (2019 and 2027)
Figure 37. Brazil: Drinking Water Adsorbents Market – Revenue and Forecast to 2027 (US$ Million)
Figure 38. Argentina: Drinking Water Adsorbents Market – Revenue and Forecast to 2027 (US$ Million)
Figure 39. Rest of SAM: Drinking Water Adsorbents Market – Revenue and Forecast to 2027 (US$ Million)
Figure 40. Impact of COVID-19 Pandemic in MEA Country Markets
Figure 41. Impact of COVID-19 Pandemic In SAM Country Markets
Yes! We provide a free sample of the report, which includes Report Scope (Table of Contents), report structure, and selected insights to help you assess the value of the full report. Please click on the "Download Sample" button or contact us to receive your copy.
Absolutely - analyst assistance is part of the package. You can connect with our analyst post-purchase to clarify report insights, methodology or discuss how the findings apply to your business needs.
Once your order is successfully placed, you will receive a confirmation email along with your invoice.
• For published reports: You'll receive access to the report within 4-6 working hours via a secured email sent to your email.
• For upcoming reports: Your order will be recorded as a pre-booking. Our team will share the estimated release date and keep you informed of any updates. As soon as the report is published, it will be delivered to your registered email.
We offer customization options to align the report with your specific objectives. Whether you need deeper insights into a particular region, industry segment, competitor analysis, or data cut, our research team can tailor the report accordingly. Please share your requirements with us, and we'll be happy to provide a customized proposal or scope.
The report is available in either PDF format or as an Excel dataset, depending on the license you choose.
The PDF version provides the full analysis and visuals in a ready-to-read format. The Excel dataset includes all underlying data tables for easy manipulation and further analysis.
Please review the license options at checkout or contact us to confirm which formats are included with your purchase.
Our payment process is fully secure and PCI-DSS compliant.
We use trusted and encrypted payment gateways to ensure that all transactions are protected with industry-standard SSL encryption. Your payment details are never stored on our servers and are handled securely by certified third-party processors.
You can make your purchase with confidence, knowing your personal and financial information is safe with us.
Yes, we do offer special pricing for bulk purchases.
If you're interested in purchasing multiple reports, we're happy to provide a customized bundle offer or volume-based discount tailored to your needs. Please contact our sales team with the list of reports you're considering, and we'll share a personalized quote.
Yes, absolutely.
Our team is available to help you make an informed decision. Whether you have questions about the report's scope, methodology, customization options, or which license suits you best, we're here to assist. Please reach out to us at sales@theinsightpartners.com, and one of our representatives will get in touch promptly.
Yes, a billing invoice will be automatically generated and sent to your registered email upon successful completion of your purchase.
If you need the invoice in a specific format or require additional details (such as company name, GST, or VAT information), feel free to contact us, and we'll be happy to assist.
Yes, certainly.
If you encounter any difficulties accessing or receiving your report, our support team is ready to assist you. Simply reach out to us via email or live chat with your order information, and we'll ensure the issue is resolved quickly so you can access your report without interruption.
The Insight Partners performs research in 4 major stages: Data Collection & Secondary Research, Primary Research, Data Analysis and Data Triangulation & Final Review.
- Data Collection and Secondary Research:
As a market research and consulting firm operating from a decade, we have published many reports and advised several clients across the globe. First step for any study will start with an assessment of currently available data and insights from existing reports. Further, historical and current market information is collected from Investor Presentations, Annual Reports, SEC Filings, etc., and other information related to company’s performance and market positioning are gathered from Paid Databases (Factiva, Hoovers, and Reuters) and various other publications available in public domain.
Several associations trade associates, technical forums, institutes, societies and organizations are accessed to gain technical as well as market related insights through their publications such as research papers, blogs and press releases related to the studies are referred to get cues about the market. Further, white papers, journals, magazines, and other news articles published in the last 3 years are scrutinized and analyzed to understand the current market trends.
- Primary Research:
The primarily interview analysis comprise of data obtained from industry participants interview and answers to survey questions gathered by in-house primary team.
For primary research, interviews are conducted with industry experts/CEOs/Marketing Managers/Sales Managers/VPs/Subject Matter Experts from both demand and supply side to get a 360-degree view of the market. The primary team conducts several interviews based on the complexity of the markets to understand the various market trends and dynamics which makes research more credible and precise.
A typical research interview fulfils the following functions:
- Provides first-hand information on the market size, market trends, growth trends, competitive landscape, and outlook
- Validates and strengthens in-house secondary research findings
- Develops the analysis team’s expertise and market understanding
Primary research involves email interactions and telephone interviews for each market, category, segment, and sub-segment across geographies. The participants who typically take part in such a process include, but are not limited to:
- Industry participants: VPs, business development managers, market intelligence managers and national sales managers
- Outside experts: Valuation experts, research analysts and key opinion leaders specializing in the electronics and semiconductor industry.
Below is the breakup of our primary respondents by company, designation, and region:

Once we receive the confirmation from primary research sources or primary respondents, we finalize the base year market estimation and forecast the data as per the macroeconomic and microeconomic factors assessed during data collection.
- Data Analysis:
Once data is validated through both secondary as well as primary respondents, we finalize the market estimations by hypothesis formulation and factor analysis at regional and country level.
- 3.1 Macro-Economic Factor Analysis:
We analyse macroeconomic indicators such the gross domestic product (GDP), increase in the demand for goods and services across industries, technological advancement, regional economic growth, governmental policies, the influence of COVID-19, PEST analysis, and other aspects. This analysis aids in setting benchmarks for various nations/regions and approximating market splits. Additionally, the general trend of the aforementioned components aid in determining the market's development possibilities.
- 3.2 Country Level Data:
Various factors that are especially aligned to the country are taken into account to determine the market size for a certain area and country, including the presence of vendors, such as headquarters and offices, the country's GDP, demand patterns, and industry growth. To comprehend the market dynamics for the nation, a number of growth variables, inhibitors, application areas, and current market trends are researched. The aforementioned elements aid in determining the country's overall market's growth potential.
- 3.3 Company Profile:
The “Table of Contents” is formulated by listing and analyzing more than 25 - 30 companies operating in the market ecosystem across geographies. However, we profile only 10 companies as a standard practice in our syndicate reports. These 10 companies comprise leading, emerging, and regional players. Nonetheless, our analysis is not restricted to the 10 listed companies, we also analyze other companies present in the market to develop a holistic view and understand the prevailing trends. The “Company Profiles” section in the report covers key facts, business description, products & services, financial information, SWOT analysis, and key developments. The financial information presented is extracted from the annual reports and official documents of the publicly listed companies. Upon collecting the information for the sections of respective companies, we verify them via various primary sources and then compile the data in respective company profiles. The company level information helps us in deriving the base number as well as in forecasting the market size.
- 3.4 Developing Base Number:
Aggregation of sales statistics (2020-2022) and macro-economic factor, and other secondary and primary research insights are utilized to arrive at base number and related market shares for 2022. The data gaps are identified in this step and relevant market data is analyzed, collected from paid primary interviews or databases. On finalizing the base year market size, forecasts are developed on the basis of macro-economic, industry and market growth factors and company level analysis.
- Data Triangulation and Final Review:
The market findings and base year market size calculations are validated from supply as well as demand side. Demand side validations are based on macro-economic factor analysis and benchmarks for respective regions and countries. In case of supply side validations, revenues of major companies are estimated (in case not available) based on industry benchmark, approximate number of employees, product portfolio, and primary interviews revenues are gathered. Further revenue from target product/service segment is assessed to avoid overshooting of market statistics. In case of heavy deviations between supply and demand side values, all thes steps are repeated to achieve synchronization.
We follow an iterative model, wherein we share our research findings with Subject Matter Experts (SME’s) and Key Opinion Leaders (KOLs) until consensus view of the market is not formulated – this model negates any drastic deviation in the opinions of experts. Only validated and universally acceptable research findings are quoted in our reports.
We have important check points that we use to validate our research findings – which we call – data triangulation, where we validate the information, we generate from secondary sources with primary interviews and then we re-validate with our internal data bases and Subject matter experts. This comprehensive model enables us to deliver high quality, reliable data in shortest possible time.

May 2021
Rhamnolipids Market
Size and Forecast (2021 - 2031), Global and Regional Share, Trend, and Growth Opportunity Analysis Report Coverage: By Type (Mono-rhamnolipids and Di-rhamnolipids), Application [Daily Chemicals (Laundry Detergents, Dishwashers, Surface Cleaners, and Others), Personal Care and Cosmetics, Agriculture, Food, Pharmaceuticals, Oilfield and Petroleum, Environmental Protection, and Others] and Geography (North America, Europe, Asia Pacific, Middle East and Africa, and South and Central America)
May 2021
Europe Spray Marking Paints Market
Size and Forecast (2021 - 2035), Regional Share, Trend, and Growth Opportunity Analysis Report Coverage: By Propellant Type [LPG, Dimethyl Ether (DME), and Others], By Technology (Solvent-Based, Water-Based, and Others), By Application [Construction (Geodesy and Topography in Building and Construction, Railway Marking, Landscaped/Agricultural/Military Site Marking, and Others), Forestry [Tree Marking, Log Marking, Plank Marking, and Others], Line Marking (Information Marking and Signaling, Parking Spaces, Safety Marking and Signage, and Space Delimitation), Packaging, and Others], and Country
May 2021
Adhesives Market
Size and Forecast (2021 - 2031), Global and Regional Share, Trend, and Growth Opportunity Analysis Report Coverage: By Resin Type (Epoxy, Polyurethane, Acrylic, and Others), By End-Use Industry (Automotive, Aerospace, Paper and Packaging, Building and Construction, Electrical and Electronics, Medical, and Others), and Geography (North America, Europe, Asia Pacific, Middle East and Africa, and South and Central America)
May 2021
Ester for Synthetic and Bio-Based Lubricants Market
Size and Forecast (2021 - 2031), Global and Regional Share, Trend, and Growth Opportunity Analysis Report Coverage: By Ester Type [Monoesters, Diesters, Polyol Esters (Trimethylolpropane Esters, Pentaerythritol Esters, Neopentyl Glycol Esters, Trimethylol Ethane Esters, and Dipentaerythritol Esters), Trimellitate Esters, Complex Esters, and Others], Lubricant Type (Synthetic Lubricants and Biobased Lubricants), Application [Engine Oil (MCO, PCMO, HDEO, and Other Engines), Compressor Oil, (Refrigeration, Air Compressors, Natural Gas Compressors, and Others Compressors), Hydraulic Fluids, Gear Oil, Transmission Oil, Coolants, and Others], and End Use [Automotive (Conventional Vehicles and Electric Vehicles), Textile, Marine, Mining and Metallurgy, Aviation, Energy and Power, and Others]
May 2021
Synthetic Ester Lubricants for the Telecommunications Market
Size and Forecast (2021 - 2031), Global and Regional Share, Trend, and Growth Opportunity Analysis Report Coverage: By Product Type (Gear Oil, Transformer Oil, Immersion Cooling Fluids, Refrigeration Oil, and Grease), End Use (Data Centers, Telecommunication Infrastructure, and Others), and Geography (North America, Europe, Asia Pacific, Middle East and Africa, and South and Central America
May 2021
Synthetic Ester Lubricants for Electrical and Electronics Market
Size and Forecast (2021 - 2031), Global and Regional Share, Trend, and Growth Opportunity Analysis Report Coverage: By Product Type (Gear Oil, Transformer Oil, Immersion Cooling Fluids, Refrigeration Oil, Grease, Metalworking Fluids, and Others) and End Use (General Air Conditioners, Automotive Air Conditioners, Refrigerators, and Others)
May 2021
Synthetic Ester Lubricants for Construction Market
Size and Forecast (2021 - 2031), Global and Regional Share, Trend, and Growth Opportunity Analysis Report Coverage: By Product Type (Engine Oil, Hydraulic Oil, Gear Oil, Grease, Turbine Oil, Metalworking Fluids, and Others) and End Use (Construction Machinery, Concrete and Construction Tools, Wire Ropes and Chains, and Others)
May 2021
Synthetic Ester Lubricants for Energy and Power Market
Size and Forecast (2021 - 2031), Global and Regional Share, Trend, and Growth Opportunity Analysis Report Coverage: By Product Type (Engine Oil, Hydraulic Oil, Gear Oil, Transformer Oil, Immersion Cooling Fluids, Refrigeration Oil, Grease, Turbine Oil, Metalworking Fluids, and Others) and End Use (River Dam, Offshore Wind Power, Energy Storage Systems, and Others)
 Get Free Sample For