The diagramming software market in MEA is expected to grow from US$ 26.53 million in 2021 to US$ 42.30 million by 2028; it is estimated to grow at a CAGR of 6.9% from 2021 to 2028.
The UAE, Saudi Arabia, and South Africa are major economies in MEA. Integration of advanced technologies with diagramming software is the major factor driving the growth of the MEA diagramming software market. Automation in documentation and diagramming is being highly adopted across industries to eliminate repetitive human work. Technologies like artificial intelligence (AI) are integrated with diagramming software to automate the creation of flowcharts, organization charts, mapping charts, and workflows. The integration of advanced technologies like AI with diagramming solutions is enabling the automation across both the creation and updating of charts based on pre-entered criteria. For instance, Edrawsoft offers an automatic vector-based org chart maker solution that enables enterprises to create organizational charts in various formats such as basic organization charts, photo organization charts, family trees, custom organization charts, and people organization charts. The solution is integrated with human resource systems, and it automatically makes the charts based on information and designation available on such systems. The solution also updates the information automatically when an employee leaves the organization. These advantages are expected to influence the adoption of technologically advanced diagramming software. Thus, the above-mentioned factors are expected to propel the growth of the MEA diagramming software market over the forecast period.Saudi Arabia, the UAE, Egypt, Morocco, and Kuwait are the main countries facing the impact of the COVID-19 outbreak in the Middle East and Africa. Saudi Arabia's economy shrank by 7%, indicating how hard the latest pandemic struck both the oil and non-oil industries, and unemployment reached a new high of 15.4%. The crisis adversely impacted the technological adoption and investment in the region. However, in the region, the rising adoption of remote working culture among enterprises to communicate efficiently among teams and clients propels the demand for diagramming solutions for making efficient flowcharts, grantt charts, org charts, and mind mapping. The major adoption of cloud solutions is experienced among SMEs across the region to expand their business activities. Thus, the COVID-19 outbreak pandemic is expected to positively impact the growth of the diagramming software market in the coming years.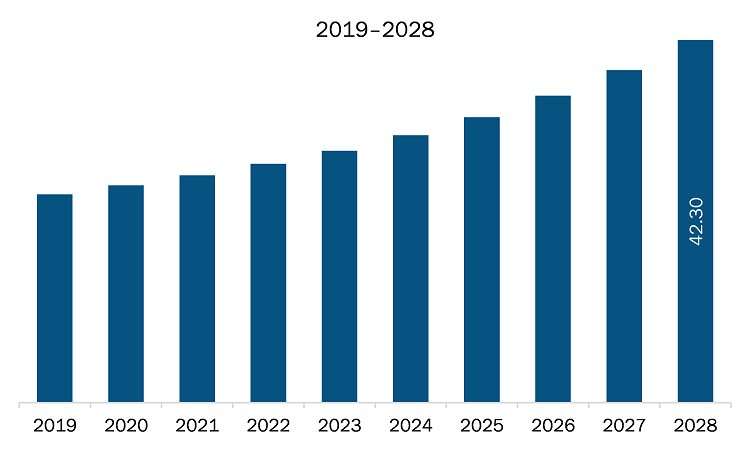
- Sample PDF showcases the content structure and the nature of the information with qualitative and quantitative analysis.
- Request discounts available for Start-Ups & Universities
MEA Diagramming Software Market Segmentation
MEA Diagramming Software Market – By Deployment Type
- Cloud
- On-Premises
MEA Diagramming Software Market – By Enterprise Size
- SMEs
- Large Enterprises
MEA Diagramming Software Market – By Application
- Corporates
- Educational Institutions
- Personal
MEA Diagramming Software Market– By Country
- UAE
- Saudi Arabia
- South Africa
- Rest of MEA
MEA Diagramming Software Market-Companies Mentioned
- CREATELY (CINERGIX PTY LTD)
- Edrawsoft
- Gliffy (Perforce Software, Inc.)
- Microsoft Corporation
- SmartDraw, LLC

Report Coverage
Revenue forecast, Company Analysis, Industry landscape, Growth factors, and Trends

Segment Covered
This text is related
to segments covered.

Regional Scope
North America, Europe, Asia Pacific, Middle East & Africa, South & Central America

Country Scope
This text is related
to country scope.
TABLE OF CONTENTS
1. Introduction
1.1 Study Scope
1.2 The Insight Partners Research Report Guidance
1.3 Market Segmentation
2. Key Takeaways
3. Research Methodology
3.1 Coverage
3.2 Secondary Research
3.3 Primary Research
4. MEA Diagramming Software Market Landscape
4.1 Market Overview
4.2 PEST Analysis
4.2.1 MEA
4.3 Ecosystem Analysis
4.4 Expert Opinion
5. MEA Diagramming Software Market – Key Market Dynamics
5.1 Market Drivers
5.1.1 Surge in Adoption of Diagramming Software Across Large Enterprises
5.1.2 Increasing Adoption of Cloud-Based Diagramming Software across Organizations
5.2 Market Restraints
5.2.1 Prevalence of Freely Available Diagramming Solutions
5.3 Market Opportunities
5.3.1 Integration of Advanced Technologies with Diagramming Software
5.4 Future Trends
5.4.1 Strategic initiatives by Major Players
5.5 Impact Analysis of Drivers and Restraints
6. Diagramming Software Market – MEA Analysis
6.1 Diagramming Software Market MEA Overview
6.2 MEA Diagramming Software Market –Revenue and Forecast to 2028 (US$ Million)
7. MEA Diagramming Software Market– By Deployment Type
7.1 Overview
7.2 MEA Diagramming Software Market, by Deployment Type (2020 and 2028)
7.3 Cloud
7.3.1 Overview
7.3.2 Cloud: MEA Diagramming Software Market – Revenue and Forecast to 2028 (US$ Million)
7.4 On-Premises
7.4.1 Overview
7.4.2 On-premises: MEA Diagramming Software Market – Revenue and Forecast to 2028 (US$ Million)
8. MEA Diagramming Software Market – By Enterprise Size
8.1 Overview
8.2 MEA Diagramming Software Market, by Enterprise Size (2020 and 2028)
8.3 SMEs
8.3.1 Overview
8.3.2 SMEs: MEA Diagramming Software Market – Revenue and Forecast to 2028 (US$ Million)
8.4 Large Enterprises
8.4.1 Overview
8.4.2 Large Enterprises: MEA Diagramming Software Market – Revenue and Forecast to 2028 (US$ Million)
9. MEA Diagramming Software Market – By Application
9.1 Overview
9.2 MEA Diagramming Software Market, by Application (2020 and 2028)
9.3 Educational Institutions
9.3.1 Overview
9.3.2 Educational Institutions: MEA Diagramming Software Market – Revenue and Forecast to 2028 (US$ Million)
9.4 Corporates
9.4.1 Overview
9.4.2 Corporates: MEA Diagramming Software Market – Revenue and Forecast to 2028 (US$ Million)
9.5 Personal
9.5.1 Overview
9.5.2 Personal: MEA Diagramming Software Market – Revenue and Forecast to 2028 (US$ Million)
10. MEA Diagramming Software Market – Country Analysis
10.1 MEA: Diagramming Software Market
10.1.1 MEA: Diagramming Software Market- by Key Country
10.1.1.1 South Africa: Diagramming Software Market – Revenue and Forecast to 2028 (US$ Million)
10.1.1.1.1 South Africa: Diagramming Software Market- By Deployment Type
10.1.1.1.2 South Africa: Diagramming Software Market- By Enterprise Size
10.1.1.1.3 South Africa: Diagramming Software Market- By Application
10.1.1.2 Saudi Arabia: Diagramming Software Market – Revenue and Forecast to 2028 (US$ Million)
10.1.1.2.1 Saudi Arabia: Diagramming Software Market- By Deployment Type
10.1.1.2.2 Saudi Arabia: Diagramming Software Market- By Enterprise Size
10.1.1.2.3 Saudi Arabia: Diagramming Software Market- By Application
10.1.1.3 UAE: Diagramming Software Market – Revenue and Forecast to 2028 (US$ Million)
10.1.1.3.1 UAE: Diagramming Software Market- By Deployment Type
10.1.1.3.2 UAE: Diagramming Software Market- By Enterprise Size
10.1.1.3.3 UAE: Diagramming Software Market- By Application
10.1.1.4 Rest of MEA: Diagramming Software Market – Revenue and Forecast to 2028 (US$ Million)
10.1.1.4.1 Rest of MEA: Diagramming Software Market- By Deployment Type
10.1.1.4.2 Rest of MEA: Diagramming Software Market- By Enterprise Size
10.1.1.4.3 Rest of MEA: Diagramming Software Market- By Application
11. Impact of COVID-19 Pandemic on MEA Diagramming Software Market
11.1 Middle East and Africa: Impact Assessment of COVID-19 Pandemic
12. MEA Diagramming Software Market- Industry Landscape
12.1 Overview
12.2 New Product Development
13. Company Profiles
13.1 CREATELY (CINERGIX PTY LTD)
13.1.1 Key Facts
13.1.2 Business Description
13.1.3 Products and Services
13.1.4 Financial Overview
13.1.5 SWOT Analysis
13.1.6 Key Developments
13.2 Microsoft Corporation
13.2.1 Key Facts
13.2.2 Business Description
13.2.3 Products and Services
13.2.4 Financial Overview
13.2.5 SWOT Analysis
13.2.6 Key Developments
13.3 SmartDraw, LLC
13.3.1 Key Facts
13.3.2 Business Description
13.3.3 Products and Services
13.3.4 Financial Overview
13.3.5 SWOT Analysis
13.3.6 Key Developments
13.4 Edrawsoft
13.4.1 Key Facts
13.4.2 Business Description
13.4.3 Products and Services
13.4.4 Financial Overview
13.4.5 SWOT Analysis
13.4.6 Key Developments
13.5 Gliffy (Perforce Software, Inc.)
13.5.1 Key Facts
13.5.2 Business Description
13.5.3 Products and Services
13.5.4 Financial Overview
13.5.5 SWOT Analysis
13.5.6 Key Developments
14. Appendix
14.1 About The Insight Partners
14.2 Word Index
LIST OF TABLES
Table 1. MEA Diagramming Software Market – Revenue and Forecast to 2028 (US$ Million)
Table 2. South Africa: Diagramming Software Market- By Deployment Type –Revenue and Forecast to 2028 (US$ Million)
Table 3. South Africa: Diagramming Software Market- By Enterprise Size –Revenue and Forecast to 2028 (US$ Million)
Table 4. South Africa: Diagramming Software Market- By Application –Revenue and Forecast to 2028 (US$ Million)
Table 5. Saudi Arabia: Diagramming Software Market- By Deployment Type –Revenue and Forecast to 2028 (US$ Million)
Table 6. Saudi Arabia: Diagramming Software Market- By Enterprise Size –Revenue and Forecast to 2028 (US$ Million)
Table 7. Saudi Arabia: Diagramming Software Market- By Application –Revenue and Forecast to 2028 (US$ Million)
Table 8. UAE: Diagramming Software Market- By Deployment Type –Revenue and Forecast to 2028 (US$ Million)
Table 9. UAE: Diagramming Software Market- By Enterprise Size –Revenue and Forecast to 2028 (US$ Million)
Table 10. UAE: Diagramming Software Market- By Application –Revenue and Forecast to 2028 (US$ Million)
Table 11. Rest of MEA: Diagramming Software Market- By Deployment Type –Revenue and Forecast to 2028 (US$ Million)
Table 12. Rest of MEA: Diagramming Software Market- By Enterprise Size –Revenue and Forecast to 2028 (US$ Million)
Table 13. Rest of MEA: Diagramming Software Market- By Application –Revenue and Forecast to 2028 (US$ Million)
Table 14. List of Abbreviation
LIST OF FIGURES
Figure 1. MEA Diagramming Software Market Segmentation
Figure 2. MEA Diagramming Software Market Segmentation – By Country
Figure 3. MEA Diagramming Software Market Overview
Figure 4. Cloud Segment Held the Largest Market Share in 2020
Figure 5. Large Enterprises Segment Held the Largest Market Share in 2020
Figure 6. Corporates Application Held the Largest Market Share in 2020
Figure 7. UAE was the Largest Revenue Contributor in 2020
Figure 8. MEA: PEST Analysis
Figure 9. Expert Opinion
Figure 10. MEA Diagramming Software Market Impact Analysis of Drivers and Restraints
Figure 11. MEA Diagramming Software Market – Revenue and Forecast to 2028 (US$ Million)
Figure 12. MEA Diagramming Software Market Revenue Share, by Deployment Type (2020 and 2028)
Figure 13. Cloud: MEA Diagramming Software Market – Revenue and Forecast to 2028 (US$ Million)
Figure 14. On-premises: MEA Diagramming Software Market – Revenue and Forecast to 2028 (US$ Million)
Figure 15. MEA Diagramming Software Market Revenue Share, by Enterprise Size (2020 and 2028)
Figure 16. SMEs: MEA Diagramming Software Market – Revenue and Forecast to 2028 (US$ Million)
Figure 17. Large Enterprises: MEA Diagramming Software Market – Revenue and Forecast to 2028 (US$ Million)
Figure 18. MEA Diagramming Software Market Revenue Share, by Application (2020 and 2028)
Figure 19. Educational Institutions: MEA Diagramming Software Market – Revenue and Forecast to 2028 (US$ Million)
Figure 20. Corporates: MEA Diagramming Software Market – Revenue and Forecast to 2028 (US$ Million)
Figure 21. Personal: MEA Diagramming Software Market – Revenue and Forecast to 2028 (US$ Million)
Figure 22. MEA: Diagramming Software Market – Revenue by Country to 2028 (US$ Million)
Figure 23. MEA: Diagramming Software Market Revenue Share, By Key Country (2020 and 2028)
Figure 24. South Africa: Diagramming Software Market – Revenue and Forecast to 2028 (US$ Million)
Figure 25. Saudi Arabia: Diagramming Software Market – Revenue and Forecast to 2028 (US$ Million)
Figure 26. UAE: Diagramming Software Market – Revenue and Forecast to 2028 (US$ Million)
Figure 27. Rest of MEA: Diagramming Software Market – Revenue and Forecast to 2028 (US$ Million)
Figure 28. Impact of COVID-19 Pandemic in Middle East and Africa Country Markets
- CREATELY (CINERGIX PTY LTD)
- Edrawsoft
- Gliffy (Perforce Software, Inc.)
- Microsoft Corporation
- SmartDraw, LLC
The Insight Partners performs research in 4 major stages: Data Collection & Secondary Research, Primary Research, Data Analysis and Data Triangulation & Final Review.
- Data Collection and Secondary Research:
As a market research and consulting firm operating from a decade, we have published many reports and advised several clients across the globe. First step for any study will start with an assessment of currently available data and insights from existing reports. Further, historical and current market information is collected from Investor Presentations, Annual Reports, SEC Filings, etc., and other information related to company’s performance and market positioning are gathered from Paid Databases (Factiva, Hoovers, and Reuters) and various other publications available in public domain.
Several associations trade associates, technical forums, institutes, societies and organizations are accessed to gain technical as well as market related insights through their publications such as research papers, blogs and press releases related to the studies are referred to get cues about the market. Further, white papers, journals, magazines, and other news articles published in the last 3 years are scrutinized and analyzed to understand the current market trends.
- Primary Research:
The primarily interview analysis comprise of data obtained from industry participants interview and answers to survey questions gathered by in-house primary team.
For primary research, interviews are conducted with industry experts/CEOs/Marketing Managers/Sales Managers/VPs/Subject Matter Experts from both demand and supply side to get a 360-degree view of the market. The primary team conducts several interviews based on the complexity of the markets to understand the various market trends and dynamics which makes research more credible and precise.
A typical research interview fulfils the following functions:
- Provides first-hand information on the market size, market trends, growth trends, competitive landscape, and outlook
- Validates and strengthens in-house secondary research findings
- Develops the analysis team’s expertise and market understanding
Primary research involves email interactions and telephone interviews for each market, category, segment, and sub-segment across geographies. The participants who typically take part in such a process include, but are not limited to:
- Industry participants: VPs, business development managers, market intelligence managers and national sales managers
- Outside experts: Valuation experts, research analysts and key opinion leaders specializing in the electronics and semiconductor industry.
Below is the breakup of our primary respondents by company, designation, and region:

Once we receive the confirmation from primary research sources or primary respondents, we finalize the base year market estimation and forecast the data as per the macroeconomic and microeconomic factors assessed during data collection.
- Data Analysis:
Once data is validated through both secondary as well as primary respondents, we finalize the market estimations by hypothesis formulation and factor analysis at regional and country level.
- 3.1 Macro-Economic Factor Analysis:
We analyse macroeconomic indicators such the gross domestic product (GDP), increase in the demand for goods and services across industries, technological advancement, regional economic growth, governmental policies, the influence of COVID-19, PEST analysis, and other aspects. This analysis aids in setting benchmarks for various nations/regions and approximating market splits. Additionally, the general trend of the aforementioned components aid in determining the market's development possibilities.
- 3.2 Country Level Data:
Various factors that are especially aligned to the country are taken into account to determine the market size for a certain area and country, including the presence of vendors, such as headquarters and offices, the country's GDP, demand patterns, and industry growth. To comprehend the market dynamics for the nation, a number of growth variables, inhibitors, application areas, and current market trends are researched. The aforementioned elements aid in determining the country's overall market's growth potential.
- 3.3 Company Profile:
The “Table of Contents” is formulated by listing and analyzing more than 25 - 30 companies operating in the market ecosystem across geographies. However, we profile only 10 companies as a standard practice in our syndicate reports. These 10 companies comprise leading, emerging, and regional players. Nonetheless, our analysis is not restricted to the 10 listed companies, we also analyze other companies present in the market to develop a holistic view and understand the prevailing trends. The “Company Profiles” section in the report covers key facts, business description, products & services, financial information, SWOT analysis, and key developments. The financial information presented is extracted from the annual reports and official documents of the publicly listed companies. Upon collecting the information for the sections of respective companies, we verify them via various primary sources and then compile the data in respective company profiles. The company level information helps us in deriving the base number as well as in forecasting the market size.
- 3.4 Developing Base Number:
Aggregation of sales statistics (2020-2022) and macro-economic factor, and other secondary and primary research insights are utilized to arrive at base number and related market shares for 2022. The data gaps are identified in this step and relevant market data is analyzed, collected from paid primary interviews or databases. On finalizing the base year market size, forecasts are developed on the basis of macro-economic, industry and market growth factors and company level analysis.
- Data Triangulation and Final Review:
The market findings and base year market size calculations are validated from supply as well as demand side. Demand side validations are based on macro-economic factor analysis and benchmarks for respective regions and countries. In case of supply side validations, revenues of major companies are estimated (in case not available) based on industry benchmark, approximate number of employees, product portfolio, and primary interviews revenues are gathered. Further revenue from target product/service segment is assessed to avoid overshooting of market statistics. In case of heavy deviations between supply and demand side values, all thes steps are repeated to achieve synchronization.
We follow an iterative model, wherein we share our research findings with Subject Matter Experts (SME’s) and Key Opinion Leaders (KOLs) until consensus view of the market is not formulated – this model negates any drastic deviation in the opinions of experts. Only validated and universally acceptable research findings are quoted in our reports.
We have important check points that we use to validate our research findings – which we call – data triangulation, where we validate the information, we generate from secondary sources with primary interviews and then we re-validate with our internal data bases and Subject matter experts. This comprehensive model enables us to deliver high quality, reliable data in shortest possible time.

Nov 2021
Flight Planning Software Market
Size and Forecast (2021 - 2031), Global and Regional Share, Trend, and Growth Opportunity Analysis Report Coverage: By Component (Software and Services), Deployment (Cloud and On-Premise), Application (Logistics and Cargo, Airport, Private Airlines, Commercial Airlines, Flight School and Training Center, and Military and Defense), and Geography
Nov 2021
Deepfake AI Detection Market
Size and Forecast (2021 - 2031), Global and Regional Share, Trend, and Growth Opportunity Analysis Report Coverage: By Component (Software and Services), Deployment (Cloud and On-Premises), Enterprise Size (Large Enterprises and SMEs), Industry Vertical (Media and Entertainment, BFSI, Government and Politics, Healthcare and Life Sciences, IT and Telecom, Retail and E-Commerce, and Others), and Geography
Nov 2021
Electronic Patient-Reported Outcomes (ePROS) Market
Size and Forecast (2021 - 2031), Global and Regional Share, Trend, and Growth Opportunity Analysis Report Coverage: By Delivery Mode (Cloud Based and On-Premises), Application (Oncology, Respiratory, and Others), End User [Contract Research Organizations (CROs), Pharmaceutical Companies, and Others], and Geography (North America, Europe, Asia Pacific, Middle East & Africa, and South & Central America)
Nov 2021
Travel and Expense Management Software Market
Size and Forecast (2021 - 2031), Global and Regional Share, Trend, and Growth Opportunity Analysis Report Coverage: By Deployment Mode (On-Premise and Cloud), Organization Size (Large Enterprises and Small and Medium Enterprises), Industry (BFSI, IT and Telecom, Manufacturing, Healthcare, Government and Defense, Retail, Transport and Logistics, and Others), and Geography
Nov 2021
Online Exam Proctoring Market
Size and Forecast (2021 - 2031), Global and Regional Share, Trend, and Growth Opportunity Analysis Report Coverage: By Type (Advanced Automated Proctoring, Recorded Proctoring, and Live Online Proctoring), Deployment (Cloud and On-Premises), End User (Educational Institutes, Enterprises, Government, and Online Learning Platforms), and Geography
Nov 2021
Manufacturing Execution System (MES) Market
Size and Forecast (2021 - 2031), Global and Regional Share, Trend, and Growth Opportunity Analysis Report Coverage: By Component (Software and Services), Services Type (Professional Services and Managed Services), Deployment (Cloud and On-Premise), Organization Size (Large Enterprises and SMEs), License Type (Subscription-Based and Licensed), Sales Channel (Direct Sales and Channel Partners), End User (Discrete Industry and Process Industry), and Geography
Nov 2021
Maritime Analytics Market
Size and Forecast (2021 - 2031), Global and Regional Share, Trend, and Growth Opportunity Analysis Report Coverage: By Component (Software and Services), Deployment (Cloud and On-Premises), Application (Predictive and Prescriptive Analytics, Optimal Route Mapping, Pricing Insights, Vessel Safety and Security, and Others), End User (Commercial and Military), and Geography
Nov 2021
Environmental Consulting Service Market
Size and Forecast (2021 - 2031), Global and Regional Share, Trend, and Growth Opportunity Analysis Report Coverage: By Service Type (Investment Assessment and Auditing, Permitting and Compliance, Project and Information Management, Monitoring and Testing, and Others), Media Type (Water Management, Waste Management, and Others), Vertical (Energy and Utilities, Chemical and Petroleum, Manufacturing and Process Industries, Transportation and Construction Industries, and Others), and Geography
 Get Free Sample For