North America Food Inclusions Market Trends and Analysis by 2028
North America Food Inclusions Market Forecast to 2028 - COVID-19 Impact and Regional Analysis By Type (Chocolates, Fruit and Nuts, Flavored Sugar and Caramels, and Others), by Form (Solid and Semi- Solid), and Application (Dairy and Frozen Desserts, Bakery Products, Breakfast Cereals, Chocolate and Confectionery Products, and Others)
- Report Date : Aug 2021
- Report Code : TIPRE00024120
- Category : Food and Beverages
- Status : Published
- Available Report Formats :


- No. of Pages : 121
The food inclusions market in North America is expected to grow from US$ 3,345.79 million in 2021 to US$ 4,898.41 million by 2028; it is estimated to grow at a CAGR of 5.6% from 2021 to 2028.
Food inclusions are ingredients or variegates incorporated in different food products and beverages to impart unique properties such as color, flavor, and texture. Several food inclusions are also known for their nutritional benefits. They have a wide application scope, including baked products, confectioneries, sweet and savory snacks, frozen desserts, beverages, breakfast cereals, and dairy products. The ingredients are available in forms such as freeze-dried, infused, case-frozen, micro-dried, individually quick frozen (IQF), spray-dried, and whole foods, and are selected depending on their application. Consumer buying behavior and consumption pattern, as well as eating experience are highly influenced by the texture and flavor of a food product. Thus, it is necessary to select the most suitable format of a food inclusions for a particular application. For instance, infused blueberries are used to render a complete mouth-feel and chewiness, whereas freeze-dried blueberries are used to achieve crispiness. Furthermore, dehydrated blueberries are used in foodstuffs or beverages requiring standout presence of blueberries. In the bakery segment, food inclusions have been in use for a long period to enhance the sensory properties, texture, aesthetics, and provide indulgence. Further, many of food inclusions are rich in proteins, essential fatty acids, vitamins, and fiber. Tree nuts, dried fruits, spices, herbs, exotics fruits, cocoa nibs, chocolate, etc., are the majorly used inclusions in bakery products. Further, fruits, nuts, and chocolates are the major food inclusions types used in dairy products and frozen desserts such as ice cream, yogurt, and cheese. For instance, in cultured yogurts, sweet fruits are mainly used as an inclusions to balance the tangy flavor of the cultured yogurt. Food inclusions are mainly added as individually quick-frozen ingredients in dairy products and frozen desserts. The frozen desserts and dairy products application of food inclusions is challenging as they highly influence the overall texture, flavor profile, and shelf life of the final product. Further, beverage manufacturers are highly focusing on food inclusions to cater the rising consumer demand for natural beverages. Exotic fruits, vegetables, tree nuts, and chocolate are the majorly consumed inclusions in various beverages. Beverages in which these ingredients are being incorporated include functional water, flavored water, tea, beer, energy drinks, wine, and milk. Such a wide application scope of food inclusions is a major factor driving the market growth.
The US has the highest number of confirmed cases of coronavirus, as, compared to Canada and Mexico. This has negatively affected the food & beverages industry in the region as the COVID-19 outbreak has negatively affected the supply and distribution chain. The unavailability of raw materials due to lockdown in many raw material supplying countries has halted the production. The food inclusions market has had a major impact on its product trends. The pandemic has propelled consumers to opt for healthy food products with various functional properties. Additionally, to break through the regular routine imposed due to the lockdown, the consumer’s desire for new and innovative products to experience different culinary adventure is also influencing the market trends for food inclusions. Fruits and nuts are expected to witness an increasing demand during the upcoming years owing to the health benefits offered by them. Travel restrictions are influencing the flavor trends in food. Thus, though the COVID-19 pandemic has had a negative impact on the production and supply of food inclusions, it has positively influenced the product trends in the market.
With the new features and technologies, vendors can attract new customers and expand their footprints in emerging markets. This factor is likely to drive the North America food inclusions market. The North America food inclusions market is expected to grow at a good CAGR during the forecast period.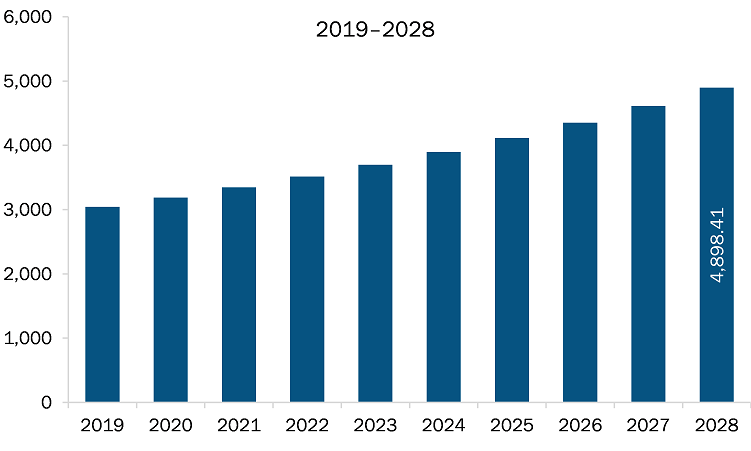
- Sample PDF showcases the content structure and the nature of the information with qualitative and quantitative analysis.
- Request discounts available for Start-Ups & Universities
North America Food Inclusions Market Segmentation
North America Food Inclusions Market – By Type
- Chocolates
- Fruit and Nuts
- Flavored Sugar and Caramels
- Others
North America Food Inclusions Market – By Form
- Solid
- Semi-Solid
North America Food Inclusions Market – By Application
- Dairy and Frozen Desserts
- Bakery Products
- Breakfast Cereals
- Chocolate and Confectionery Products
- Others
North America Food Inclusions Market – By Country
- US
- Canada
- Mexico
North America Food Inclusions Market – Companies Mentioned
- ADM
- AGRANA Beteiligungs-AG
- Puratos
- Barry Callebaut
- Cargill, Incorporated.
- Kerry Group
- Georgia Nut Company
- Taura Natural Ingredients Ltd
- Sensient Technologies

Report Coverage
Revenue forecast, Company Analysis, Industry landscape, Growth factors, and Trends

Segment Covered
Type, by Form, and Application

Regional Scope
North America, Europe, Asia Pacific, Middle East & Africa, South & Central America

Country Scope
US, Canada
1. Introduction
1.1 Study Scope
1.2 The Insight Partners Research Report Guidance
1.3 Market Segmentation
1.3.1 Food Inclusions Market, by Type
1.3.2 Food Inclusions Market, by Form
1.3.3 Food Inclusions Market, by Application
1.3.4 North America Food Inclusions Market, by Country
2. Key Takeaways
3. Research Methodology
3.1 Scope of the Study
3.2 Research Methodology
3.2.1 Data Collection:
3.2.2 Primary Interviews:
3.2.3 Hypothesis formulation:
3.2.4 Macro-economic factor analysis:
3.2.5 Developing base number:
3.2.6 Data Triangulation:
3.2.7 Country level data:
3.2.8 Assumptions and Limitations:
4. North America Food Inclusions Market Landscape
4.1 Market Overview
4.2 Value Chain Analysis
4.2.1 Macadamia Nuts
4.2.2 Raw Material:
4.2.3 Manufacturing/Processing:
4.2.4 Caramel
4.3 Porter’s Five Forces Analysis
4.4 Expert Opinion
5. North America Food Inclusions Market – Key Market Dynamics
5.1 Market Drivers
5.1.1 Broad Scope of Application
5.1.2 Raising Focus Towards Value Addition to Achieve Product Differentiation
5.2 Market Restraints
5.2.1 Up-surging Production Costs of Food Products and Beverages
5.3 Market Opportunities
5.3.1 Flourishing Demand for Functional and Healthy Food Products
5.4 Future Trends
5.4.1 Altering Consumer Preferences
5.5 Impact Analysis of Drivers and Restraint
6. North America Food Inclusions – Market Analysis
6.1 North America Food Inclusions Market Overview
6.2 North America Food Inclusions Market –Revenue and Forecast to 2028 (US$ Million)
7. North America Food Inclusions Market Analysis – By Type
7.1 Overview
7.2 North America: Food Inclusions Market, by Type
7.3 Chocolates
7.3.1 Overview
7.3.2 Chocolates: Food Inclusions Market – Revenue, and Forecast to 2028 (US$ Million)
7.4 Fruits and Nuts
7.4.1 Overview
7.4.2 Fruits and Nuts: Food Inclusions Market – Revenue, and Forecast to 2028 (US$ Million)
7.5 Flavored Sugar and Caramel
7.5.1 Overview
7.5.2 Flavored Sugar and Caramel: Food Inclusions Market – Revenue, and Forecast to 2028 (US$ Million)
7.6 Others
7.6.1 Overview
7.6.2 Others: Food Inclusions Market – Revenue, and Forecast to 2028 (US$ Million)
8. North America Food Inclusions Market Analysis – By Form
8.1 Overview
8.2 North America: Food Inclusions Market, by Form
8.3 Solid
8.3.1 Overview
8.3.2 Solid: Food Inclusions Market – Revenue, and Forecast to 2028 (US$ Million)
8.4 Semi- Solid
8.4.1 Overview
8.4.2 Semi- Solid: Food Inclusions Market – Revenue, and Forecast to 2028 (US$ Million)
9. North America Food Inclusions Market Analysis – By Application
9.1 Overview
9.2 North America: Food Inclusions Market, by Application
9.3 Dairy and Frozen Desserts
9.3.1 Overview
9.3.2 Dairy and Frozen Desserts: Food Inclusions Market, Revenue And Forecast to 2028 (US$ Million)
9.4 Bakery Products
9.4.1 Overview
9.4.2 Bakery Products: Food Inclusions Market, Revenue and Forecast to 2028 (US$ Million)
9.5 Breakfast Cereals
9.5.1 Overview
9.5.2 Breakfast Cereals: Food Inclusions Market, Revenue and Forecast to 2028 (US$ Million)
9.6 Chocolate and Confectionery Products
9.6.1 Overview
9.6.2 Chocolate and Confectionery Products: Food Inclusions Market, Revenue and Forecast to 2028 (US$ Million)
9.7 Others
9.7.1 Overview
9.7.2 Others: Food Inclusions Market, Revenue and Forecast to 2028 (US$ Million)
10. North America Food Inclusions Market – Country Analysis
10.1.1 North America: Food Inclusions Market, by Key Country
10.1.1.1 US: Food Inclusions Market –Revenue and Forecast to 2028 (US$ Million)
10.1.1.1.1 US: Food Inclusions Market, by Type
10.1.1.1.2 US: Food Inclusions Market, by Form
10.1.1.1.3 US: Food Inclusions Market, by Application
10.1.1.2 Canada: Food Inclusions Market –Revenue and Forecast to 2028 (US$ Million)
10.1.1.2.1 Canada: Food Inclusions Market, by Type
10.1.1.2.2 Canada: Food Inclusions Market, by Form
10.1.1.2.3 Canada: Food Inclusions Market, by Application
10.1.1.3 Mexico: Food Inclusions Market –Revenue and Forecast to 2028 (US$ Million)
10.1.1.3.1 Mexico: Food Inclusions Market, by Type
10.1.1.3.2 Mexico: Food Inclusions Market, by Form
10.1.1.3.3 Mexico: Food Inclusions Market, by Application
11. North America Food Inclusions Market – Impact of COVID-19
11.1 Overview
12. Industry Landscape
12.1 Overview
12.2 Mergers & acquisition
12.3 Product Launch
12.4 Expansion
13. Company Profiles
13.1 ADM
13.1.1 Key Facts
13.1.2 Business Description
13.1.3 Products and Services
13.1.4 Financial Overview
13.1.5 SWOT Analysis
13.1.6 Key Developments
13.2 AGRANA Beteiligungs-AG
13.2.1 Key Facts
13.2.2 Business Description
13.2.3 Products and Services
13.2.4 Financial Overview
13.2.5 SWOT Analysis
13.2.6 Key Developments
13.3 Puratos
13.3.1 Key Facts
13.3.2 Business Description
13.3.3 Products and Services
13.3.4 Financial Overview
13.3.5 SWOT Analysis
13.3.6 Key Developments
13.4 Barry Callebaut
13.4.1 Key Facts
13.4.2 Business Description
13.4.3 Products and Services
13.4.4 Financial Overview
13.4.5 SWOT Analysis
13.4.6 Key Developments
13.5 Cargill, Incorporated.
13.5.1 Key Facts
13.5.2 Business Description
13.5.3 Products and Services
13.5.4 Financial Overview
13.5.5 SWOT Analysis
13.5.6 Key Developments
13.6 Kerry Group
13.6.1 Key Facts
13.6.2 Business Description
13.6.3 Products and Services
13.6.4 Financial Overview
13.6.5 SWOT Analysis
13.6.6 Key Developments
13.7 Georgia Nut Company
13.7.1 Key Facts
13.7.2 Business Description
13.7.3 Products and Services
13.7.4 Financial Overview
13.7.5 SWOT Analysis
13.7.6 Key Developments
13.8 Taura Natural Ingredients Ltd.
13.8.1 Key Facts
13.8.2 Business Description
13.8.3 Products and Services
13.8.4 Financial Overview
13.8.5 SWOT Analysis
13.8.6 Key Developments
13.9 Sensient Technologies
13.9.1 Key Facts
13.9.2 Business Description
13.9.3 Products and Services
13.9.4 Financial Overview
13.9.5 SWOT Analysis
13.9.6 Key Developments
14. Appendix
14.1 About The Insight Partners
14.2 Glossary of Terms
LIST OF TABLES
Table 1. North America Food Inclusions Market –Revenue and Forecast to 2028 (US$ Million)
Table 2. North America Food Inclusions Market, by Country – Revenue and Forecast to 2028 (US$ Million)
Table 3. US Food Inclusions Market, by Type – Revenue and Forecast to 2028 (US$ Million)
Table 4. US Food Inclusions Market, by Form – Revenue and Forecast to 2028 (US$ Million)
Table 5. US Food Inclusions Market, by Application – Revenue and Forecast to 2028 (US$ Million)
Table 6. Canada Food Inclusions Market, by Type – Revenue and Forecast to 2028 (US$ Million)
Table 7. Canada Food Inclusions Market, by Form – Revenue and Forecast to 2028 (US$ Million)
Table 8. Canada Food Inclusions Market, by Application – Revenue and Forecast to 2028 (US$ Million)
Table 9. Mexico Food Inclusions Market, by Type – Revenue and Forecast to 2028 (US$ Million)
Table 10. Mexico Food Inclusions Market, by Form– Revenue and Forecast to 2028 (US$ Million)
Table 11. Mexico Food Inclusions Market, by Application – Revenue and Forecast to 2028 (US$ Million)
Table 12. Glossary of Terms, Food Inclusions Market
LIST OF FIGURES
Figure 1. Food Inclusions Market Segmentation
Figure 2. Food Inclusions Market Segmentation – By Country
Figure 3. North America Food Inclusions Market Overview
Figure 4. Chocolates Segment Held Largest Share of North America Food Inclusions Market
Figure 5. Europe Region Held Largest Share of North America Food Inclusions Market
Figure 6. North America Food Inclusions Market, Industry Landscape
Figure 7. Value Chain: Macadamia Nuts
Figure 8. Value Chain: Caramel
Figure 9. Porter’s Five Forces Analysis
Figure 10. Expert Opinion
Figure 11. Food Inclusions Market Impact Analysis of Driver and Restraint
Figure 12. North America Food Inclusions Market – Revenue and Forecast to 2028 (US$ Million)
Figure 13. North America: Food Inclusions Market Revenue Share, by Type (2020 and 2028)
Figure 14. Chocolates: Food Inclusions Market – Revenue, and Forecast to 2028 (US$ Million)
Figure 15. Fruits and Nuts: Food Inclusions Market – Revenue, and Forecast to 2028 (US$ Million)
Figure 16. Flavored Sugar and Caramel: Food Inclusions Market – Revenue, and Forecast to 2028 (US$ Million)
Figure 17. Others: Food Inclusions Market – Revenue, and Forecast to 2028 (US$ Million)
Figure 18. North America: Food Inclusions Market Revenue Share, by Form (2020 and 2028)
Figure 19. Solid: Food Inclusions Market – Revenue, and Forecast to 2028 (US$ Million)
Figure 20. Semi- Solid: Food Inclusions Market – Revenue, and Forecast to 2028 (US$ Million)
Figure 21. North America: Food Inclusions Market Revenue Share, by Application (2020 and 2028)
Figure 22. Dairy and Frozen Desserts: Food Inclusions Market, Revenue and Forecast to 2028 (US$ Million)
Figure 23. Bakery Products: Food Inclusions Market, Revenue and Forecast to 2028 (US$ Million)
Figure 24. Breakfast Cereals: Food Inclusions Market, Revenue and Forecast to 2028 (US$ Million)
Figure 25. Chocolate and Confectionery Products: Food Inclusions Market, Revenue and Forecast to 2028 (US$ Million)
Figure 26. Others: Food Inclusions Market, Revenue and Forecast to 2028 (US$ Million)
Figure 27. Geographic Overview of Food Inclusions Market
Figure 28. North America: Food Inclusions Market Revenue Share, by Key Country (2020 and 2028)
Figure 29. US: Food Inclusions Market –Revenue and Forecast to 2028 (US$ Million)
Figure 30. Canada: Food Inclusions Market –Revenue and Forecast to 2028 (US$ Million)
Figure 31. Mexico: Food Inclusions Market –Revenue and Forecast to 2028 (US$ Million)
Figure 32. Impact of COVID-19 Pandemic in North America
Yes! We provide a free sample of the report, which includes Report Scope (Table of Contents), report structure, and selected insights to help you assess the value of the full report. Please click on the "Download Sample" button or contact us to receive your copy.
Absolutely - analyst assistance is part of the package. You can connect with our analyst post-purchase to clarify report insights, methodology or discuss how the findings apply to your business needs.
Once your order is successfully placed, you will receive a confirmation email along with your invoice.
• For published reports: You'll receive access to the report within 4-6 working hours via a secured email sent to your email.
• For upcoming reports: Your order will be recorded as a pre-booking. Our team will share the estimated release date and keep you informed of any updates. As soon as the report is published, it will be delivered to your registered email.
We offer customization options to align the report with your specific objectives. Whether you need deeper insights into a particular region, industry segment, competitor analysis, or data cut, our research team can tailor the report accordingly. Please share your requirements with us, and we'll be happy to provide a customized proposal or scope.
The report is available in either PDF format or as an Excel dataset, depending on the license you choose.
The PDF version provides the full analysis and visuals in a ready-to-read format. The Excel dataset includes all underlying data tables for easy manipulation and further analysis.
Please review the license options at checkout or contact us to confirm which formats are included with your purchase.
Our payment process is fully secure and PCI-DSS compliant.
We use trusted and encrypted payment gateways to ensure that all transactions are protected with industry-standard SSL encryption. Your payment details are never stored on our servers and are handled securely by certified third-party processors.
You can make your purchase with confidence, knowing your personal and financial information is safe with us.
Yes, we do offer special pricing for bulk purchases.
If you're interested in purchasing multiple reports, we're happy to provide a customized bundle offer or volume-based discount tailored to your needs. Please contact our sales team with the list of reports you're considering, and we'll share a personalized quote.
Yes, absolutely.
Our team is available to help you make an informed decision. Whether you have questions about the report's scope, methodology, customization options, or which license suits you best, we're here to assist. Please reach out to us at sales@theinsightpartners.com, and one of our representatives will get in touch promptly.
Yes, a billing invoice will be automatically generated and sent to your registered email upon successful completion of your purchase.
If you need the invoice in a specific format or require additional details (such as company name, GST, or VAT information), feel free to contact us, and we'll be happy to assist.
Yes, certainly.
If you encounter any difficulties accessing or receiving your report, our support team is ready to assist you. Simply reach out to us via email or live chat with your order information, and we'll ensure the issue is resolved quickly so you can access your report without interruption.
The Insight Partners performs research in 4 major stages: Data Collection & Secondary Research, Primary Research, Data Analysis and Data Triangulation & Final Review.
- Data Collection and Secondary Research:
As a market research and consulting firm operating from a decade, we have published many reports and advised several clients across the globe. First step for any study will start with an assessment of currently available data and insights from existing reports. Further, historical and current market information is collected from Investor Presentations, Annual Reports, SEC Filings, etc., and other information related to company’s performance and market positioning are gathered from Paid Databases (Factiva, Hoovers, and Reuters) and various other publications available in public domain.
Several associations trade associates, technical forums, institutes, societies and organizations are accessed to gain technical as well as market related insights through their publications such as research papers, blogs and press releases related to the studies are referred to get cues about the market. Further, white papers, journals, magazines, and other news articles published in the last 3 years are scrutinized and analyzed to understand the current market trends.
- Primary Research:
The primarily interview analysis comprise of data obtained from industry participants interview and answers to survey questions gathered by in-house primary team.
For primary research, interviews are conducted with industry experts/CEOs/Marketing Managers/Sales Managers/VPs/Subject Matter Experts from both demand and supply side to get a 360-degree view of the market. The primary team conducts several interviews based on the complexity of the markets to understand the various market trends and dynamics which makes research more credible and precise.
A typical research interview fulfils the following functions:
- Provides first-hand information on the market size, market trends, growth trends, competitive landscape, and outlook
- Validates and strengthens in-house secondary research findings
- Develops the analysis team’s expertise and market understanding
Primary research involves email interactions and telephone interviews for each market, category, segment, and sub-segment across geographies. The participants who typically take part in such a process include, but are not limited to:
- Industry participants: VPs, business development managers, market intelligence managers and national sales managers
- Outside experts: Valuation experts, research analysts and key opinion leaders specializing in the electronics and semiconductor industry.
Below is the breakup of our primary respondents by company, designation, and region:

Once we receive the confirmation from primary research sources or primary respondents, we finalize the base year market estimation and forecast the data as per the macroeconomic and microeconomic factors assessed during data collection.
- Data Analysis:
Once data is validated through both secondary as well as primary respondents, we finalize the market estimations by hypothesis formulation and factor analysis at regional and country level.
- 3.1 Macro-Economic Factor Analysis:
We analyse macroeconomic indicators such the gross domestic product (GDP), increase in the demand for goods and services across industries, technological advancement, regional economic growth, governmental policies, the influence of COVID-19, PEST analysis, and other aspects. This analysis aids in setting benchmarks for various nations/regions and approximating market splits. Additionally, the general trend of the aforementioned components aid in determining the market's development possibilities.
- 3.2 Country Level Data:
Various factors that are especially aligned to the country are taken into account to determine the market size for a certain area and country, including the presence of vendors, such as headquarters and offices, the country's GDP, demand patterns, and industry growth. To comprehend the market dynamics for the nation, a number of growth variables, inhibitors, application areas, and current market trends are researched. The aforementioned elements aid in determining the country's overall market's growth potential.
- 3.3 Company Profile:
The “Table of Contents” is formulated by listing and analyzing more than 25 - 30 companies operating in the market ecosystem across geographies. However, we profile only 10 companies as a standard practice in our syndicate reports. These 10 companies comprise leading, emerging, and regional players. Nonetheless, our analysis is not restricted to the 10 listed companies, we also analyze other companies present in the market to develop a holistic view and understand the prevailing trends. The “Company Profiles” section in the report covers key facts, business description, products & services, financial information, SWOT analysis, and key developments. The financial information presented is extracted from the annual reports and official documents of the publicly listed companies. Upon collecting the information for the sections of respective companies, we verify them via various primary sources and then compile the data in respective company profiles. The company level information helps us in deriving the base number as well as in forecasting the market size.
- 3.4 Developing Base Number:
Aggregation of sales statistics (2020-2022) and macro-economic factor, and other secondary and primary research insights are utilized to arrive at base number and related market shares for 2022. The data gaps are identified in this step and relevant market data is analyzed, collected from paid primary interviews or databases. On finalizing the base year market size, forecasts are developed on the basis of macro-economic, industry and market growth factors and company level analysis.
- Data Triangulation and Final Review:
The market findings and base year market size calculations are validated from supply as well as demand side. Demand side validations are based on macro-economic factor analysis and benchmarks for respective regions and countries. In case of supply side validations, revenues of major companies are estimated (in case not available) based on industry benchmark, approximate number of employees, product portfolio, and primary interviews revenues are gathered. Further revenue from target product/service segment is assessed to avoid overshooting of market statistics. In case of heavy deviations between supply and demand side values, all thes steps are repeated to achieve synchronization.
We follow an iterative model, wherein we share our research findings with Subject Matter Experts (SME’s) and Key Opinion Leaders (KOLs) until consensus view of the market is not formulated – this model negates any drastic deviation in the opinions of experts. Only validated and universally acceptable research findings are quoted in our reports.
We have important check points that we use to validate our research findings – which we call – data triangulation, where we validate the information, we generate from secondary sources with primary interviews and then we re-validate with our internal data bases and Subject matter experts. This comprehensive model enables us to deliver high quality, reliable data in shortest possible time.

Aug 2021
Whey Powder Market
Size and Forecast (2021 - 2031), Global and Regional Share, Trend, and Growth Opportunity Analysis Report Coverage: By Type (Sweet Whey Powder, Acid Whey Powder, Deproteinized Whey Powder, and Demineralized Whey Powder), Category (Conventional and Organic), Application (Bakery and Confectionery, Dairy Products, Animal Feed, Infant Nutrition, Sauces and Soups, Nutritional Supplements, and Others), and Geography
Aug 2021
Seasoning Blends and Marinades Market
Size and Forecast (2021 - 2031), Global and Regional Share, Trend, and Growth Opportunity Analysis Report Coverage: By End Use (Food Manufacturing, Foodservice and Food Retail), Food Manufacturing by Product Type and Application (Seasoning Blends [Processed Meats; Soups, Stocks, and Noodles; Ready Meals; Sauces and Dressings; Snacks; Bakery; and Others], Marinades [Processed Meats; Soups, Stocks, and Noodles; Ready Meals; Snacks; Bakery; and Others]), Food Service by Product Type and Food Service Channel (Seasoning Blends [Restaurant Chains, Independent Restaurants, Hotels and Accommodation, Institutional Foodservice, Catering, and Others], Marinades [Restaurant Chains, Independent Restaurants, Hotels and Accommodation, Institutional Foodservice, Catering, and Others]), Food Retail by Product Type (Seasoning Blends [BBQ Seasoning, Ranch Seasoning, Cajun Seasoning, Italian Seasoning, Five Spice Powder, Berbere Powder, Chili and Lime Seasoning, Fajita Seasoning, Chipotle Seasoning, Tacos Seasoning, All-Purpose Seasoning, and Others] and Marinades), and Geography
Aug 2021
Halal Food for Service Market
Size and Forecast (2021 - 2031), Global and Regional Share, Trend, and Growth Opportunity Analysis Report Coverage: By Product Type (Prepared Meals and Entrees; Sandwiches and Wraps; Packaged Salads; Appetizers and Snacks; Soups, Sauces, and Condiments; Desserts; and Others), End User (Airlines, Railways, Maritime, Healthcare, Schools and Colleges, Theme Parks, and Others), and Geography
Aug 2021
Kosher Food for Service Market
Size and Forecast (2021 - 2031), Global and Regional Share, Trend, and Growth Opportunity Analysis Report Coverage: By Product Type (Prepared Meals and Entrees; Sandwiches and Wraps; Packaged Salads; Appetizers and Snacks; Soups, Sauces, and Condiments; Desserts; and Others), End User (Airlines, Railways, Maritime, Healthcare, Schools and Colleges, Theme Parks, and Others), and Geography
Aug 2021
Wheat Bran/Offal Market
Size and Forecast (2021 - 2031), Global and Regional Share, Trend, and Growth Opportunity Analysis Report Coverage: By Form (Flour/Meal, Flakes, and Pellets), Category (Organic and Conventional), Application (Animal Feed, Breakfast Cereals, Nutritional Bars, Beverages, Baked Goods, and Others), and Geography
Aug 2021
Blueberries Market
Size and Forecast (2021 - 2031), Global and Regional Share, Trend, and Growth Opportunity Analysis Report Coverage: By Form (Fresh, Frozen, and Dried), Category (Conventional and Organic), End Use (Food Service, Food Retail, and Food Processing), and Geography
Aug 2021
Resistant Starch Market
Size and Forecast (2021 - 2031), Global and Regional Share, Trend, and Growth Opportunity Analysis Report Coverage: By Form (Dry and Liquid), Type (Type1, Type2, Type3, and Type4), Application [Food and Beverages (Bakery and Confectionery, Dairy and Frozen Dessert, Beverages, Sweet and Savory Snacks, and Others), Dietary Supplements, and Animal Nutrition], and Geography
Aug 2021
Demineralized Whey Powder Market
Size and Forecast (2021 - 2031), Global and Regional Share, Trend, and Growth Opportunity Analysis Report Coverage: By Type (50% Demineralized Whey Powder, 70% Demineralized Whey Powder, 90% Demineralized Whey Powder, and Others), Category (Conventional and Organic), Application (Bakery and Confectionery, Dairy and Frozen Desserts, Infant Formula, Beverages, and Others), and Geography
 Get Free Sample For