North America Protective Cultures Market Key Players and Forecast by 2028
North America Protective Cultures Market Forecast to 2028 - COVID-19 Impact and Regional Analysis By Target Microorganism (Bacteria and Yeasts & Molds) and Application (Food Processing and Animal Feed)
- Status : Published
- Report Code : TIPRE00025729
- Category : Food and Beverages
- No. of Pages : 73
- Available Report Formats :


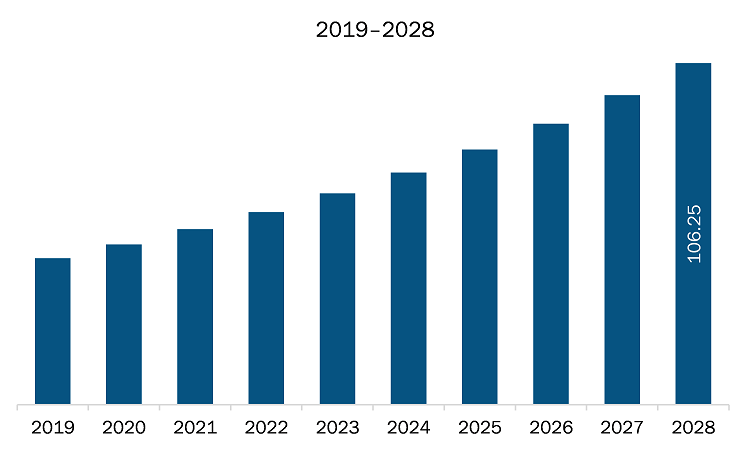
The protective cultures market in North America is expected to grow from US$ 54.62 million in 2021 to US$ 106.25 million by 2028; it is estimated to grow at a CAGR of 10.0% from 2021 to 2028.
The US, Canada, and Mexico are major economies in North America. Growing demand for natural preservatives are the major factor driving the growth of the North America protective cultures market. Consumer preference is shifting toward food and beverages with natural preservatives. Upsurge in the consumption of convenience and ready-to-eat food products propels the demand for foods with longer shelf life, which boosts the need for natural preservatives. Protective cultures are considered a promising alternative in comparison to lactic acid bacteria. The use of protective culture ensures the safety and quality of minimally processed foods items without chemical preservatives. It also extends the shelf life of ready-to-eat products with fresh-tasting. Rise in consumption of ready-to-eat food products coupled with increase in consumption of healthy food, specifically with clean label ingredients, are the major drivers projected to fuel the natural preservatives market growth. In addition, the consumer preference toward clean-label products is surging, owing to the use of bacterial cultures. For instance, in 2017, DSM launched the Delvo Guard range of clean-label dairy cultures designed to inhibit mold and yeast in fresh dairy products without affecting food quality or safety. The company stated that these protective cultures are an addition to DSM’s clean-label range. It delivers an entirely clean-label and natural solution to image-conscious brands looking to contribute to a more sustainable world and rise to the challenge of changing consumer trends and preferences. Moreover, before consumption, health-conscious consumers understand the ingredients used in products through transparent product labeling. Thus, the demand for clean label products comprising natural preservatives is increasing. According to the Food & Health Survey 2016, over 70% of consumers check expiry dates in supermarkets and hypermarkets. This shows that, while consumers value clean labels and natural products, shelf life is also a key driver of purchasing behavior. In addition, recent research has exhibited that consumers are willing to pay more for clean label products, with 1 in 2 people ready to pay at least 10% more for these products, such as yogurt free from artificial preservatives. All such factors drive the demand for the natural preservatives, which is further anticipated to drive the market in North America.North America is one of the worst-affected economies due to the COVID-19 pandemic. The US reported the highest number of confirmed cases of COVID-19, followed by Canada and Mexico. However, the COVID-19 pandemic has had a relatively positive impact on the protective cultures market. The pandemic helped to develop more awareness and interest in the microbial cultures. It has been a disagreeable and a stressful time for most of the population across the world, and therefore the people have started consuming clean label products. The COVID-19 pathophysiology has changed the consumer’s perception of clean beyond labels or products. They continue to maintain their focus on clean label for at-home as well as out-of-home purchases.
- Sample PDF showcases the content structure and the nature of the information with qualitative and quantitative analysis.
- Request discounts available for Start-Ups & Universities
North America Protective Cultures Market Segmentation
North America Protective Cultures Market – By Target Microorganism
- Bacteria
- Yeasts & Molds
North America Protective Cultures Market – By Application
- Food Processing
- Dairy Products
- Beverages
- Meat, Poultry, & Seafood Products
- Others
- Animal Feed
North America Protective Cultures Market– By Country
- US
- Canada
- Mexico
North America Protective Cultures Market-Companies Mentioned
- Bioprox
- Chr. Hansen Holding A/S
- DSM
- International Flavors & Fragrances Inc.
- Kerry Group
- Lallemand Inc.
- Sacco Systems

Report Coverage
Revenue forecast, Company Analysis, Industry landscape, Growth factors, and Trends

Segment Covered
This text is related
to segments covered.

Regional Scope
North America, Europe, Asia Pacific, Middle East & Africa, South & Central America

Country Scope
This text is related
to country scope.
TABLE OF CONTENTS
1. Introduction
1.1 Study Scope
1.2 The Insight Partners Research Report Guidance
1.3 Market Segmentation
2. Key Takeaways
3. Research Methodology
3.1 Scope of the Study
3.2 Research Methodology
3.2.1 Data Collection
3.2.2 Primary Interviews
3.2.3 Hypothesis Formulation
3.2.4 Macro-economic Factor Analysis
3.2.5 Developing Base Number
3.2.6 Data Triangulation
3.2.7 Country Level Data
3.2.8 Limitations & Assumptions
4. North America Protective Cultures Market Landscape
4.1 Market Overview
4.2 Porter’s Five Forces Analysis
4.2.1 Bargaining Power of Buyers:
4.2.2 Bargaining Power of Suppliers:
4.2.3 Threat of Substitutes:
4.2.4 Threat of New Entrants:
4.2.5 Competitive Rivalry:
4.3 Ecosystem Analysis
4.4 Expert Opinion
5. North America Protective Cultures Market – Key Market Dynamics
5.1 Market Drivers
5.1.1 Increasing Consumption of Dairy Products
5.1.2 Growing Demand for Natural Preservatives
5.2 Market Restraints
5.2.1 Stringent Regulations Regarding Usage of Protective Cultures
5.3 Market Opportunities
5.3.1 Emergence of Animal Feed as Lucrative Application
5.3.2 Rising Demand From Untapped Region
5.4 Future Trends
5.4.1 Increasing Concerns for Food Wastage
5.5 Impact Analysis of Drivers and Restraints
6. Protective Cultures – North America Market Analysis
6.1 North America Protective Cultures Market Overview
6.2 North America Protective Cultures Market –Revenue and Forecast to 2028 (US$ Million)
7. North America Protective Cultures Market Analysis – By Target Microorganism
7.1 Overview
7.2 North America Protective Cultures Market, By Category (2020 and 2028)
7.3 Bacteria
7.3.1 Overview
7.3.2 Bacteria: North America Protective Cultures Market – Revenue and Forecast to 2028 (US$ Million)
7.4 Yeasts & Molds
7.4.1 Overview
7.4.2 Yeasts & Molds: North America Protective cultures Market – Revenue and Forecast to 2028 (US$ Million)
8. North America Protective Cultures Market Analysis – By Application
8.1 Overview
8.2 North America Protective Cultures Market, By Application (2020 and 2028)
8.3 Food Processing
8.3.1 Overview
8.3.2 Food Processing: North America Protective Cultures Market – Revenue and Forecast to 2028 (US$ Million)
8.3.2.1 Dairy Products: North America Protective Cultures Market – Revenue and Forecast to 2028 (US$ Million)
8.3.2.2 Beverages: North America Protective Cultures Market – Revenue and Forecast to 2028 (US$ Million)
8.3.2.3 Meat, Poultry, & Seafood Products: North America Protective Cultures Market – Revenue and Forecast to 2028 (US$ Million)
8.3.2.4 Others: North America Protective Cultures Market – Revenue and Forecast to 2028 (US$ Million)
8.4 Animal Feed
8.4.1 Overview
8.4.2 Animal Feed: North America Protective Cultures Market – Revenue and Forecast to 2028 (US$ Million)
9. North America Protective Cultures Market – Country Analysis
9.1 North America: Protective Cultures Market
9.1.1 North America: Protective Cultures Market, by Key Country
9.1.1.1 US: Protective Cultures Market –Analysis and Forecast to 2028 (US$ Million)
9.1.1.1.1 US: Protective Cultures Market, by Target Microorganism
9.1.1.1.2 US: Protective Cultures Market, by Application
9.1.1.2 Canada: Protective Cultures Market –Analysis and Forecast to 2028 (US$ Million)
9.1.1.2.1 Canada: Protective Cultures Market, by Target Microorganism
9.1.1.2.2 Canada: Protective Cultures Market, by Application
9.1.1.3 Mexico: Protective Cultures Market –Analysis and Forecast to 2028 (US$ Million)
9.1.1.3.1 Mexico: Protective Cultures Market, by Target Microorganism
9.1.1.3.2 Mexico: Protective Cultures Market, by Application
10. Overview- Impact of Coronavirus Outbreak
10.1 Impact of COVID-19 Pandemic on Protective Cultures Market
11. Industry Landscape
11.1 Merger & Acquisition
11.2 Product Launch
12. Company Profiles
12.1 Bioprox
12.1.1 Key Facts
12.1.2 Business Description
12.1.3 Products and Services
12.1.4 Financial Overview
12.1.5 SWOT Analysis
12.1.6 Key Developments
12.2 Chr. Hansen Holding A/S
12.2.1 Key Facts
12.2.2 Business Description
12.2.3 Products and Services
12.2.4 Financial Overview
12.2.5 SWOT Analysis
12.2.6 Key Developments
12.3 DSM
12.3.1 Key Facts
12.3.2 Business Description
12.3.3 Products and Services
12.3.4 Financial Overview
12.3.5 SWOT Analysis
12.3.6 Key Developments
12.4 Lallemand Inc.
12.4.1 Key Facts
12.4.2 Business Description
12.4.3 Products and Services
12.4.4 Financial Overview
12.4.5 SWOT Analysis
12.4.6 Key Developments
12.5 International Flavors & Fragrances Inc.
12.5.1 Key Facts
12.5.2 Business Description
12.5.3 Products and Services
12.5.4 Financial Overview
12.5.5 SWOT Analysis
12.5.6 Key Developments
12.6 Kerry Group
12.6.1 Key Facts
12.6.2 Business Description
12.6.3 Products and Services
12.6.4 Financial Overview
12.6.5 SWOT Analysis
12.6.6 Key Developments
12.7 Sacco Systems
12.7.1 Key Facts
12.7.2 Business Description
12.7.3 Products and Services
12.7.4 Financial Overview
12.7.5 SWOT Analysis
12.7.6 Key Developments
13. Appendix
13.1 About The Insight Partners
13.2 Word Index
LIST OF TABLES
Table 1. North America Protective Cultures Market –Revenue and Forecast to 2028 (US$ Million)
Table 2. US Protective Cultures Market, by Target Microorganism – Revenue and Forecast to 2028 (US$ Million)
Table 3. US Protective Cultures Market, by Application– Revenue and Forecast to 2028 (US$ Million)
Table 4. Canada Protective Cultures Market, by Target Microorganism – Revenue and Forecast to 2028 (US$ Million)
Table 5. Canada Protective Cultures Market, by Application– Revenue and Forecast to 2028 (US$ Million)
Table 6. Mexico Protective Cultures Market, by Target Microorganism – Revenue and Forecast to 2028 (US$ Million)
Table 7. Mexico Protective Cultures Market, by Application– Revenue and Forecast to 2028 (US$ Million)
Table 8. List of Abbreviation
LIST OF FIGURES
Figure 1. North America Protective Cultures Market Segmentation
Figure 2. North America Protective Cultures Market Segmentation – By Country
Figure 3. North America Protective Cultures Market Overview
Figure 4. North America Protective Cultures Market, By Target Microorganism
Figure 5. US Protective Cultures Market, By Country
Figure 6. North America Protective Cultures Market, Industry Landscape
Figure 7. Porter ‘s Five Forces Analysis for North America Protective Cultures Market
Figure 8. North America Protective Cultures Market – Ecosystem Analysis
Figure 9. Expert Opinion
Figure 10. North America Protective Cultures Market Impact Analysis of Drivers and Restraints
Figure 11. North America Protective Cultures Market – Revenue and Forecast to 2028 (US$ Million)
Figure 12. North America Protective Cultures Market Revenue Share, By Target Microorganism (2020 and 2028)
Figure 13. Bacteria: North America Protective Cultures Market – Revenue and Forecast to 2028 (US$ Million)
Figure 14. Yeasts & Molds: North America Protective Cultures Market – Revenue and Forecast to 2028 (US$ Million)
Figure 15. North America Protective Cultures Market Revenue Share, By Application (2020 and 2028)
Figure 16. Food Processing: North America Protective Cultures Market – Revenue and Forecast to 2028 (US$ Million)
Figure 17. Dairy Products: North America Protective Cultures Market – Revenue and Forecast to 2028 (US$ Million)
Figure 18. Beverages: North America Protective Cultures Market – Revenue and Forecast to 2028 (US$ Million)
Figure 19. Meat, Poultry, & Seafood Products: North America Protective Cultures Market – Revenue and Forecast to 2028 (US$ Million)
Figure 20. Others: North America Protective Cultures Market – Revenue and Forecast to 2028 (US$ Million)
Figure 21. Animal Feed: North America Protective Cultures Market – Revenue and Forecast to 2028 (US$ Million)
Figure 22. North America: Protective Cultures Market – Revenue and Forecast by Country to 2028 (US$ Million)
Figure 23. North America: Protective Cultures Market Revenue Share, by Key Country (2020 and 2028)
Figure 24. US: Protective Cultures Market –Revenue and Forecast to 2028 (US$ Million)
Figure 25. Canada: Protective Cultures Market –Revenue and Forecast to 2028 (US$ Million)
Figure 26. Mexico: Protective Cultures Market –Revenue and Forecast to 2028 (US$ Million)
Figure 27. Impact of COVID-19 Pandemic in North America
Yes! We provide a free sample of the report, which includes Report Scope (Table of Contents), report structure, and selected insights to help you assess the value of the full report. Please click on the "Download Sample" button or contact us to receive your copy.
Absolutely - analyst assistance is part of the package. You can connect with our analyst post-purchase to clarify report insights, methodology or discuss how the findings apply to your business needs.
Once your order is successfully placed, you will receive a confirmation email along with your invoice.
• For published reports: You'll receive access to the report within 4-6 working hours via a secured email sent to your email.
• For upcoming reports: Your order will be recorded as a pre-booking. Our team will share the estimated release date and keep you informed of any updates. As soon as the report is published, it will be delivered to your registered email.
We offer customization options to align the report with your specific objectives. Whether you need deeper insights into a particular region, industry segment, competitor analysis, or data cut, our research team can tailor the report accordingly. Please share your requirements with us, and we'll be happy to provide a customized proposal or scope.
The report is available in either PDF format or as an Excel dataset, depending on the license you choose.
The PDF version provides the full analysis and visuals in a ready-to-read format. The Excel dataset includes all underlying data tables for easy manipulation and further analysis.
Please review the license options at checkout or contact us to confirm which formats are included with your purchase.
Our payment process is fully secure and PCI-DSS compliant.
We use trusted and encrypted payment gateways to ensure that all transactions are protected with industry-standard SSL encryption. Your payment details are never stored on our servers and are handled securely by certified third-party processors.
You can make your purchase with confidence, knowing your personal and financial information is safe with us.
Yes, we do offer special pricing for bulk purchases.
If you're interested in purchasing multiple reports, we're happy to provide a customized bundle offer or volume-based discount tailored to your needs. Please contact our sales team with the list of reports you're considering, and we'll share a personalized quote.
Yes, absolutely.
Our team is available to help you make an informed decision. Whether you have questions about the report's scope, methodology, customization options, or which license suits you best, we're here to assist. Please reach out to us at sales@theinsightpartners.com, and one of our representatives will get in touch promptly.
Yes, a billing invoice will be automatically generated and sent to your registered email upon successful completion of your purchase.
If you need the invoice in a specific format or require additional details (such as company name, GST, or VAT information), feel free to contact us, and we'll be happy to assist.
Yes, certainly.
If you encounter any difficulties accessing or receiving your report, our support team is ready to assist you. Simply reach out to us via email or live chat with your order information, and we'll ensure the issue is resolved quickly so you can access your report without interruption.
The Insight Partners performs research in 4 major stages: Data Collection & Secondary Research, Primary Research, Data Analysis and Data Triangulation & Final Review.
- Data Collection and Secondary Research:
As a market research and consulting firm operating from a decade, we have published many reports and advised several clients across the globe. First step for any study will start with an assessment of currently available data and insights from existing reports. Further, historical and current market information is collected from Investor Presentations, Annual Reports, SEC Filings, etc., and other information related to company’s performance and market positioning are gathered from Paid Databases (Factiva, Hoovers, and Reuters) and various other publications available in public domain.
Several associations trade associates, technical forums, institutes, societies and organizations are accessed to gain technical as well as market related insights through their publications such as research papers, blogs and press releases related to the studies are referred to get cues about the market. Further, white papers, journals, magazines, and other news articles published in the last 3 years are scrutinized and analyzed to understand the current market trends.
- Primary Research:
The primarily interview analysis comprise of data obtained from industry participants interview and answers to survey questions gathered by in-house primary team.
For primary research, interviews are conducted with industry experts/CEOs/Marketing Managers/Sales Managers/VPs/Subject Matter Experts from both demand and supply side to get a 360-degree view of the market. The primary team conducts several interviews based on the complexity of the markets to understand the various market trends and dynamics which makes research more credible and precise.
A typical research interview fulfils the following functions:
- Provides first-hand information on the market size, market trends, growth trends, competitive landscape, and outlook
- Validates and strengthens in-house secondary research findings
- Develops the analysis team’s expertise and market understanding
Primary research involves email interactions and telephone interviews for each market, category, segment, and sub-segment across geographies. The participants who typically take part in such a process include, but are not limited to:
- Industry participants: VPs, business development managers, market intelligence managers and national sales managers
- Outside experts: Valuation experts, research analysts and key opinion leaders specializing in the electronics and semiconductor industry.
Below is the breakup of our primary respondents by company, designation, and region:

Once we receive the confirmation from primary research sources or primary respondents, we finalize the base year market estimation and forecast the data as per the macroeconomic and microeconomic factors assessed during data collection.
- Data Analysis:
Once data is validated through both secondary as well as primary respondents, we finalize the market estimations by hypothesis formulation and factor analysis at regional and country level.
- 3.1 Macro-Economic Factor Analysis:
We analyse macroeconomic indicators such the gross domestic product (GDP), increase in the demand for goods and services across industries, technological advancement, regional economic growth, governmental policies, the influence of COVID-19, PEST analysis, and other aspects. This analysis aids in setting benchmarks for various nations/regions and approximating market splits. Additionally, the general trend of the aforementioned components aid in determining the market's development possibilities.
- 3.2 Country Level Data:
Various factors that are especially aligned to the country are taken into account to determine the market size for a certain area and country, including the presence of vendors, such as headquarters and offices, the country's GDP, demand patterns, and industry growth. To comprehend the market dynamics for the nation, a number of growth variables, inhibitors, application areas, and current market trends are researched. The aforementioned elements aid in determining the country's overall market's growth potential.
- 3.3 Company Profile:
The “Table of Contents” is formulated by listing and analyzing more than 25 - 30 companies operating in the market ecosystem across geographies. However, we profile only 10 companies as a standard practice in our syndicate reports. These 10 companies comprise leading, emerging, and regional players. Nonetheless, our analysis is not restricted to the 10 listed companies, we also analyze other companies present in the market to develop a holistic view and understand the prevailing trends. The “Company Profiles” section in the report covers key facts, business description, products & services, financial information, SWOT analysis, and key developments. The financial information presented is extracted from the annual reports and official documents of the publicly listed companies. Upon collecting the information for the sections of respective companies, we verify them via various primary sources and then compile the data in respective company profiles. The company level information helps us in deriving the base number as well as in forecasting the market size.
- 3.4 Developing Base Number:
Aggregation of sales statistics (2020-2022) and macro-economic factor, and other secondary and primary research insights are utilized to arrive at base number and related market shares for 2022. The data gaps are identified in this step and relevant market data is analyzed, collected from paid primary interviews or databases. On finalizing the base year market size, forecasts are developed on the basis of macro-economic, industry and market growth factors and company level analysis.
- Data Triangulation and Final Review:
The market findings and base year market size calculations are validated from supply as well as demand side. Demand side validations are based on macro-economic factor analysis and benchmarks for respective regions and countries. In case of supply side validations, revenues of major companies are estimated (in case not available) based on industry benchmark, approximate number of employees, product portfolio, and primary interviews revenues are gathered. Further revenue from target product/service segment is assessed to avoid overshooting of market statistics. In case of heavy deviations between supply and demand side values, all thes steps are repeated to achieve synchronization.
We follow an iterative model, wherein we share our research findings with Subject Matter Experts (SME’s) and Key Opinion Leaders (KOLs) until consensus view of the market is not formulated – this model negates any drastic deviation in the opinions of experts. Only validated and universally acceptable research findings are quoted in our reports.
We have important check points that we use to validate our research findings – which we call – data triangulation, where we validate the information, we generate from secondary sources with primary interviews and then we re-validate with our internal data bases and Subject matter experts. This comprehensive model enables us to deliver high quality, reliable data in shortest possible time.

Nov 2021
Soy Protein Market
Size and Forecast (2021 - 2034), Global and Regional Share, Trend, and Growth Opportunity Analysis Report Coverage: By Type (Soy Protein Concentrate, Soy Protein Isolate, Textured Soy Protein, and Soy Flour & Grits), Category (Conventional and Organic), Form (Dry and Liquid), Application (Bakery and Confectionery, Meat Alternatives, Dairy Alternatives, Infant Nutrition, Protein Supplements, Animal Nutrition, and Others), and Geography (North America, Europe, Asia Pacific, Middle East and Africa, and South and Central America)
Nov 2021
Retail Seasoning Blends Market
Size and Forecast (2021 - 2034), Global and Regional Share, Trend, and Growth Opportunity Analysis Report Coverage: By Type (BBQ Seasoning, Ranch Seasoning, Cajun Seasoning, Italian Seasoning, Five Spice Powder, Berbere Powder, Chili and Lime Seasoning, Fajita Seasoning, Chipotle Seasoning, Tacos Seasoning, All-Purpose, and Others) and Distribution Channel (Supermarkets and Hypermarkets, Convenience Stores, Online Retail, and Others)
Nov 2021
Wheat Tortilla and Wraps Market
Size and Forecast (2021 - 2031), Global and Regional Share, Trend, and Growth Opportunity Analysis Report Coverage: By Type (Wheat Tortilla, Wheat Pita, Wheat Roti or Chapati, and Others), Flavor (Plain or Regular, Herb, Tomato, Peri Peri or Chili, Masala Spiced, Garlic, and Others), Category (Low-Carb and Conventional), End Use [Food Retail (Supermarkets and Hypermarkets, Convenience Stores, Online Retail, and Others) and Foodservice (Quick Service Restaurants, Casual Dining Restaurants, Fine Dining Restaurants, Cafes and Bars, and Others)], and Geography (North America, Europe, Asia Pacific, Middle East and Africa, and South and Central America
Nov 2021
Fillings, Toppings, and Glazes Market
Size and Forecast (2021 - 2031), Global and Regional Share, Trend, and Growth Opportunity Analysis Report Coverage: By Product Type [Fruit Fillings and Jams (Berries, Apple, Pineapple, Cherry, Peach, Citrus, and Others), Chocolate Syrups and Sauces, Caramel Sauces, Sugar Glazes, Fruit Glazes, and Others], Application (Cakes and Pastries, Pies and Tarts, Ice Cream and Frozen Desserts, Chocolate and Confectionery, Waffles and Pancakes, and Others), and Geography (North America, Europe, Asia Pacific, Middle East & Africa, and South & Central America)
Nov 2021
Marinades Market
Size and Forecast (2021 - 2031), Global and Regional Share, Trend, and Growth Opportunity Analysis Report Coverage: By End Use [Food Manufacturing (Processed Meats; Soups, Stocks, and Noodles; Ready Meals; Sauces and Dressings; Snacks; Bakery; and Others), Foodservice, (Restaurant Chains, Independent Restaurants, Hotels and Accommodation, Institutional Foodservice, Catering, and Others), Food Retail], and Geography (North America, Europe, Asia Pacific, Middle East and Africa, and South and Central America)
Nov 2021
Seasoning Blends Market
Size and Forecast (2021 - 2031), Global and Regional Share, Trend, and Growth Opportunity Analysis Report Coverage: By End Use [Food Manufacturing (Processed Meats; Soups, Stocks, and Noodles; Ready Meals; Sauces and Dressings; Snacks; Bakery; and Others), Foodservice (Restaurant Chains, Independent Restaurants, Hotels and Accommodation, Institutional Foodservice, Catering, and Others), and Food Retail (BBQ Seasoning, Ranch Seasoning, Cajun Seasoning, Italian Seasoning, Five Spice Powder, Berbere Powder, Chili and Lime Seasoning, Fajita Seasoning, Chipotle Seasoning, Tacos Seasoning, All-Purpose Seasoning, and Others)], and Geography (North America, Europe, Asia Pacific, Middle East and Africa, and South and Central America)
Nov 2021
Equine Supplements Market
Size and Forecast (2021 - 2031), Global and Regional Share, Trend, and Growth Opportunity Analysis Report Coverage: By Type (Powder, Liquid, Pellets & Granules, and Others), Health Benefits (Digestive Health, Joint and Bone Health, Hoof and Laminitis, General Health and Immunity, Respiratory, Muscle Support, Skin and Coat, Calming and Nervous System, Vitamins & Minerals, Kidney/Renal, Liver/Hepatic, and Others), and Distribution Channel (Supermarkets and Hypermarkets, Pharmacies and Drugstores, Pet Stores, Online Retail, and Others)
Nov 2021
Maize Market
Size and Forecast (2021 - 2031), Global and Regional Share, Trend, and Growth Opportunity Analysis Report Coverage: By Crop Type (White Corn, Yellow Corn, Blue Corn, and Others), Category (Conventional and Organic), and Application (Food and Beverages [Breads and Rolls; Biscuits, Cookies, and Crackers; Snacks; Breakfast Cereals; and Others], Animal Feed, Pharmaceuticals and Nutraceuticals, Agriculture, and Biofuel)
 Get Free Sample For