South America 3D Mapping and Modelling Market Analysis and Opportunities by 2028
South America 3D Mapping and Modelling Market Forecast to 2028 - COVID-19 Impact and Regional Analysis By Deployment Mode (Cloud and On-Premises), Organization Size (SMEs and Large Enterprises), Component (Software Tools and Services), 3D Mapping Application (Inspection and Measurement, Object Reconstruction, Projection and Navigation, Reporting and Virtualization, and Other 3D Mapping Applications), 3D Modelling Application (Product Marketing, Animation and Movies, Gaming and Designing, Architectural Rendering, and Other 3D Modelling Applications), and Vertical (Retail and Consumer Goods, Engineering and Construction, Healthcare and Life Sciences, Transportation and Logistics, Government and Defence, Energy and Utilities, Media and Entertainment, Manufacturing, and Other Verticals)
- Status : Published
- Report Code : TIPRE00022191
- Category : Technology, Media and Telecommunications
- No. of Pages : 138
- Available Report Formats :


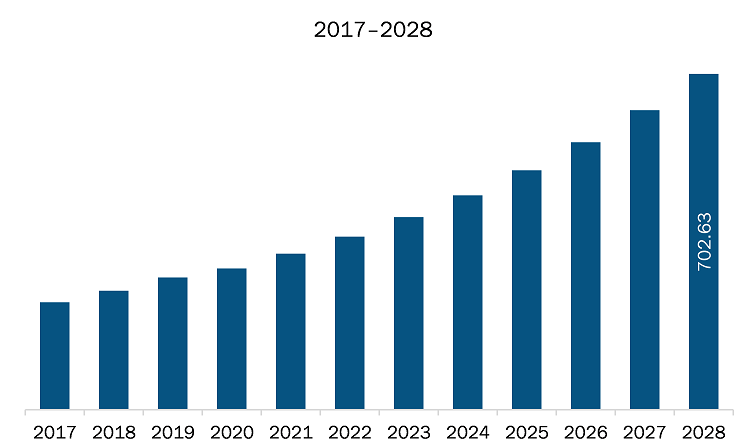
The 3D mapping and modelling market in SAM is expected to grow from US$ 295.27 million in 2020 to US$ 702.63 million by 2028; it is estimated to grow at a CAGR of 11.6% from 2021 to 2028.
The Brazil and Argentina are economies in SAM. Technological Advancement in 3D Mapping and Modelling Tools. Initially, the use of 3D mapping and modelling tools was limited as designers had to develop models of the objected from scratch, which was acting as a constrain for the market growth. However, over the last decade, technical advancement in image sensors, lenses, thermal sensors, and environment recognition and capturing devices have flourished the adoption of 3D mapping and modelling software across various industries, such as transport and logistics, engineering and construction, real estate, agriculture, and manufacturing. Therefore, capturing devices can identify object’s length, height, and width in-depth detail. The captured data can be integrated with 3D mapping and modelling tools, which allows designers and engineers to develop project models or plan for further changes, which ultimately saves cost and time by eliminating the need for designers and engineers to physically visit the facilities and manually measure the dimension. Owing to these capabilities, 3D mapping and modelling tools are enabling users to streamline the process of planning, optimize the floor space of project, assess structural conditions, and view thermal imaging to identify areas of weakness, among others. Hence, with the development of robust object and environment recognition and capturing devices coupled with the growing trend of creating enhanced user experience, the 3D mapping and modelling market is projected to witness a significant growth during the forecast period, is also bolstering the growth of the industry. Thus, the growth in the sector is expected to create a significant demand for 3D mapping and modelling market in the coming years, which is further anticipated to drive the market in SAM.Brazil has the highest number of COVID-19 cases in the region, followed by Colombia, Argentina, and Peru. The governments of various countries are taking several measures, such as trade bans, lockdowns, and travel restrictions to control the spread of COVID-19 in the region. Such measures are expected to have a direct negative impact on the region’s economic growth as the region will face lower export revenues. Thus, slowdown of overall economy of SAM due to poor exports and delay in construction and infrastructure projects is expected to hamper the adoption rate of advanced technologies including 3D mapping and modelling tools
- Sample PDF showcases the content structure and the nature of the information with qualitative and quantitative analysis.
- Request discounts available for Start-Ups & Universities
SAM 3D Mapping and Modelling Market Segmentation
SAM 3D Mapping and Modelling Market – By Deployment Type
- Cloud
- On-premises
SAM 3D Mapping and Modelling Market – By Organization Size
- SMEs
- Large Enterprises
SAM 3D Mapping and Modelling Market – By Component
- Software Tools
- Services
SAM 3D Mapping and Modelling Market – By3D Mapping Application
- Inspection and Measurement
- Object Reconstruction
- Projection and Navigation
- Reporting and Virtualization
- Others 3D Mapping Applications
SAM 3D Mapping and Modelling Market – By 3D Modelling Application
- Product Marketing
- Animation and Movies
- Gaming and Designing
- Architectural Rendering
- Other 3D Modelling Applications
SAM 3D Mapping and Modelling Market – By Vertical
- Retail and Consumer Goods
- Engineering and Construction
- Healthcare and Life Sciences
- Transportation and Logistics
- Government and Defence
- Energy and Utilities
- Media and Entertainment
- Manufacturing
- Other Verticals
SAM 3D Mapping and Modelling Market – By Country
- Brazil
- Argentina
- Rest of SAM
SAM 3D Mapping and Modelling Market-Companies Mentioned
- Bentley Systems Incorporated
- Alphabet Inc.
- Esri
- Autodesk, Inc.
- Trimble Inc
- SaaB AB
- Dassault Systèmes SE
- Adobe
- Mitsubishi Electric Corporation
- Topcon Corporation
- Apple Inc

Report Coverage
Revenue forecast, Company Analysis, Industry landscape, Growth factors, and Trends

Segment Covered
Deployment Mode, Organization Size, Component, 3D Mapping Application, 3D Modelling Application, and Vertical

Regional Scope
North America, Europe, Asia Pacific, Middle East & Africa, South & Central America

Country Scope
US, Canada, Brazil, Argentina
1. Introduction
1.1 Study Scope
1.2 The Insight Partners Research Report Guidance
1.3 Market Segmentation
1.3.1 3D Mapping and Modelling Market – By Deployment
1.3.2 3D Mapping and Modelling Market – By Organization Size
1.3.3 3D Mapping and Modelling Market – By Component
1.3.4 3D Mapping and Modelling Market – By 3D Mapping Application
1.3.5 3D Mapping and Modelling Market – By 3D Modelling Application
1.3.6 3D Mapping and Modelling Market – By Vertical
1.3.7 3D Mapping and Modelling Market- By Country
2. Key Takeaways
3. Research Methodology
3.1 Coverage
3.2 Secondary Research
3.3 Primary Research
4. SAM 3D Mapping and Modelling Market Landscape
4.1 Market Overview
4.2 PEST Analysis
4.2.1 South America
4.3 Ecosystem Analysis
4.4 Expert Opinions
5. SAM 3D Mapping and Modelling Market – Key Market Dynamics
5.1 Key Market Drivers
5.1.1 Rising Demand for 3D Animation
5.1.2 Technological Advancements in 3D Mapping and Modelling Tools
5.2 Key Market Restraints
5.2.1 Deficit of Skilled Workforce and Supporting Infrastructure in Developing Regions
5.3 Key Market Opportunities
5.3.1 Increasing Potential in Small & Medium-Sized Enterprises (SMEs)
5.4 Future Trends
5.4.1 Growth in Adoption of Cloud Solutions for High Scalability and Flexibility
5.5 Impact Analysis of Drivers and Restraints
6. 3D Mapping and Modelling Market – SAM Analysis
6.1 3D Mapping and Modelling Market SAM Overview
6.2 3D Mapping and Modelling Market – SAM Revenue and Forecast to 2028 (US$ Million)
7. SAM 3D Mapping and Modelling Market Analysis – By Component
7.1 Overview
7.2 SAM 3D Mapping and Modelling Market, By Component (2020 and 2028)
7.3 Software Tools
7.3.1 Overview
7.3.2 Software Tools: SAM 3D Mapping and Modelling Market – Revenue and Forecast to 2028 (US$ Million)
7.3.2.1 3D Mapping
7.3.2.1.1 Overview
7.3.2.1.2 3D Mapping: SAM 3D Mapping and Modelling Market- Revenue and Forecast to 2028 (US$ Million)
7.3.2.2 3D Modelling
7.3.2.2.1 Overview
7.3.2.2.2 3D Modelling: SAM 3D Mapping and Modelling Market- Revenue and Forecast to 2028 (US$ Million)
7.4 Services
7.4.1 Overview
7.4.2 Services: 3D Mapping and Modelling: SAM 3D Mapping and Modelling Market– Revenue and Forecast to 2028 (US$ Million)
7.4.2.1 Professional Services
7.4.2.1.1 Overview
7.4.2.1.2 Professional Services: SAM 3D Mapping and Modelling Market- Revenue and Forecast to 2028 (US$ Million)
7.4.2.2 Managed Services
7.4.2.2.1 Overview
7.4.2.2.2 Managed Services: SAM 3D Mapping and Modelling Market- Revenue and Forecast to 2028 (US$ Million)
8. SAM 3D Mapping and Modelling Market – By 3D Mapping Application
8.1 Overview
8.2 SAM 3D Mapping and Modelling Market, by 3D Mapping Application (2020 and 2028)
8.3 Inspection and Measurement
8.3.1 Overview
8.3.2 Inspection and Measurement: SAM 3D Mapping and Modelling Market – Revenue and Forecast to 2028 (US$ Million)
8.4 Object Reconstruction
8.4.1 Overview
8.4.2 Object Reconstruction: SAM 3D Mapping and Modelling Market – Revenue and Forecast to 2028 (US$ Million)
8.5 Projection and Navigation
8.5.1 Overview
8.5.2 Projection and Navigation: SAM 3D Mapping and Modelling Market – Revenue and Forecast to 2028 (US$ Million)
8.6 Reporting and Virtualization
8.6.1 Overview
8.6.2 Reporting and Virtualization: SAM 3D Mapping and Modelling Market – Revenue and Forecast to 2028 (US$ Million)
8.7 Other 3D Mapping Applications
8.7.1 Overview
8.7.2 Other SAM 3D Mapping Applications Market – Revenue and Forecast to 2028 (US$ Million)
9. SAM 3D Mapping and Modelling Market – By 3D Modelling Application
9.1 Overview
9.2 SAM 3D Mapping and Modelling Market, by 3D Modelling Application (2020 and 2028)
9.3 Product Marketing
9.3.1 Overview
9.3.2 Product Marketing: SAM 3D Mapping and Modelling Market – Revenue and Forecast to 2028 (US$ Million)
9.4 Animation & Movies
9.4.1 Overview
9.4.2 Animation & Movies: SAM 3D Mapping and Modelling Market – Revenue and Forecast to 2028 (US$ Million)
9.5 Gaming and Designing
9.5.1 Overview
9.5.2 Gaming and Designing: SAM 3D Mapping and Modelling Market – Revenue and Forecast to 2028 (US$ Million)
9.6 Architectural Rendering
9.6.1 Overview
9.6.2 Architectural Rendering: SAM 3D Mapping and Modelling Market – Revenue and Forecast to 2028 (US$ Million)
9.7 Other 3D Modelling Application
9.7.1 Overview
9.7.2 Other SAM 3D Modelling Application Market – Revenue and Forecast to 2028 (US$ Million)
10. SAM 3D Mapping and Modelling Market – By Deployment Type
10.1 Overview
10.2 SAM 3D Mapping and Modelling Market, by Deployment Type (2020 and 2028)
10.3 Cloud
10.3.1 Overview
10.3.2 Cloud: SAM 3D Mapping and Modelling Market – Revenue and Forecast to 2028 (US$ Million)
10.4 On-premises
10.4.1 Overview
10.4.2 On-premises: SAM 3D Mapping and Modelling Market – Revenue and Forecast to 2028 (US$ Million)
11. SAM 3D Mapping and Modelling Market – By Organization Size
11.1 Overview
11.2 SAM 3D Mapping and Modelling Market, by Organization Size (2020 and 2028)
11.3 SMEs
11.3.1 Overview
11.3.2 SMEs : SAM 3D Mapping and Modelling Market- Revenue and Forecast to 2028 (US$ Million)
11.4 Large Enterprises
11.4.1 Overview
11.4.2 Large Enterprises: SAM 3D Mapping and Modelling Market- Revenue and Forecast to 2028 (US$ Million)
12. SAM 3D Mapping and Modelling Market – By Vertical
12.1 Overview
12.2 SAM 3D Mapping and Modelling Market, by Vertical (2020 and 2028)
12.3 Retail and Consumer Goods
12.3.1 Overview
12.3.2 Retail and Consumer Goods : SAM 3D Mapping and Modelling Market- Revenue and Forecast to 2028 (US$ Million)
12.4 Engineering and Construction
12.4.1 Overview
12.4.2 Engineering and Construction : SAM 3D Mapping and Modelling Market- Revenue and Forecast to 2028 (US$ Million)
12.5 Healthcare and Life Sciences
12.5.1 Overview
12.5.2 Healthcare and Life Sciences : SAM 3D Mapping and Modelling Market- Revenue and Forecast to 2028 (US$ Million)
12.6 Transportation and Logistics
12.6.1 Overview
12.6.2 Transportation and Logistics : SAM 3D Mapping and Modelling Market- Revenue and Forecast to 2028 (US$ Million)
12.7 Government and Defence
12.7.1 Overview
12.7.2 Government and Defence : SAM 3D Mapping and Modelling Market- – Revenue and Forecast to 2028 (US$ Million)
12.8 Energy and Utilities
12.8.1 Overview
12.8.2 Energy and Utilities : SAM 3D Mapping and Modelling Market- Revenue and Forecast to 2028 (US$ Million)
12.9 Media and Entertainment
12.9.1 Overview
12.9.2 Media and Entertainment : SAM 3D Mapping and Modelling Market- Revenue and Forecast to 2028 (US$ Million)
12.10 Manufacturing
12.10.1 Overview
12.10.2 Manufacturing : SAM 3D Mapping and Modelling Market- Revenue and Forecast to 2028 (US$ Million)
12.11 Other Verticals
12.11.1 Overview
12.11.2 Other Verticals : SAM 3D Mapping and Modelling Market- Revenue and Forecast to 2028 (US$ Million)
13. SAM 3D Mapping and Modelling Market – Country Analysis
13.1 Overview
13.1.1 SAM: 3D Mapping and Modelling Market – Revenue and Forecast to 2028 (US$ Million)
13.1.2 SAM: 3D Mapping and Modelling Market- by Key Country
13.1.2.1 Brazil: 3D Mapping and Modelling Market – Revenue and Forecast to 2028 (US$ Million)
13.1.2.1.1 Brazil: 3D Mapping and Modelling Market- by Component
13.1.2.1.2 Brazil: 3D Mapping and Modelling Market- By 3D Mapping Application
13.1.2.1.3 Brazil: 3D Mapping and Modelling Market- By 3D Modelling Application
13.1.2.1.4 Brazil: 3D Mapping and Modelling Market- By Deployment Mode
13.1.2.1.5 Brazil: 3D Mapping and Modelling Market- By Organization Size
13.1.2.1.6 Brazil: 3D Mapping and Modelling Market- By Vertical
13.1.2.2 Argentina: 3D Mapping and Modelling Market – Revenue and Forecast to 2028 (US$ Million)
13.1.2.2.1 Argentina: 3D Mapping and Modelling Market- by Component
13.1.2.2.2 Argentina: 3D Mapping and Modelling Market- By 3D Mapping Application
13.1.2.2.3 Argentina: 3D Mapping and Modelling Market- By 3D Modelling Application
13.1.2.2.4 Argentina: 3D Mapping and Modelling Market- By Deployment Mode
13.1.2.2.5 Argentina: 3D Mapping and Modelling Market- By Organization Size
13.1.2.2.6 Argentina: 3D Mapping and Modelling Market- By Vertical
13.1.2.3 Rest of SAM: 3D Mapping and Modelling Market – Revenue and Forecast to 2028 (US$ Million)
13.1.2.3.1 Rest of SAM: 3D Mapping and Modelling Market- by Component
13.1.2.3.2 Rest of SAM: 3D Mapping and Modelling Market- By 3D Mapping Application
13.1.2.3.3 Rest of SAM: 3D Mapping and Modelling Market- By 3D Modelling Application
13.1.2.3.4 Rest of SAM: 3D Mapping and Modelling Market- By Deployment Mode
13.1.2.3.5 Rest of SAM: 3D Mapping and Modelling Market- By Organization Size
13.1.2.3.6 Rest of SAM: 3D Mapping and Modelling Market- By Vertical
14. SAM 3D Mapping and Modelling Market- COVID-19 Impact Analysis
14.1 South America
15. SAM 3D Mapping and Modelling Market-Industry Landscape
15.1 Overview
15.2 Market Initiative
15.3 New Development
15.4 Merger and Acquisition
16. Company Profiles
16.1 Bentley Systems Incorporated
16.1.1 Key Facts
16.1.2 Business Description
16.1.3 Products and Services
16.1.4 Financial Overview
16.1.5 SWOT Analysis
16.1.6 Key Developments
16.2 Alphabet Inc.
16.2.1 Key Facts
16.2.2 Business Description
16.2.3 Products and Services
16.2.4 Financial Overview
16.2.5 SWOT Analysis
16.2.6 Key Developments
16.3 Esri
16.3.1 Key Facts
16.3.2 Business Description
16.3.3 Products and Services
16.3.4 Financial Overview
16.3.5 SWOT Analysis
16.3.6 Key Developments
16.4 Autodesk, Inc.
16.4.1 Key Facts
16.4.2 Business Description
16.4.3 Products and Services
16.4.4 Financial Overview
16.4.5 SWOT Analysis
16.4.6 Key Developments
16.5 Trimble Inc.
16.5.1 Key Facts
16.5.2 Business Description
16.5.3 Products and Services
16.5.4 Financial Overview
16.5.5 SWOT Analysis
16.5.6 Key Developments
16.6 SaaB AB
16.6.1 Key Facts
16.6.2 Business Description
16.6.3 Products and Services
16.6.4 Financial Overview
16.6.5 SWOT Analysis
16.6.6 Key Developments
16.7 Dassault Systèmes SE
16.7.1 Key Facts
16.7.2 Business Description
16.7.3 Products and Services
16.7.4 Financial Overview
16.7.5 SWOT Analysis
16.7.6 Key Developments
16.8 Adobe
16.8.1 Key Facts
16.8.2 Business Description
16.8.3 Products and Services
16.8.4 Financial Overview
16.8.5 SWOT Analysis
16.8.6 Key Developments
16.9 Mitsubishi Electric Corporation
16.9.1 Key Facts
16.9.2 Business Description
16.9.3 Products and Services
16.9.4 Financial Overview
16.9.5 SWOT Analysis
16.9.6 Key Developments
16.10 Topcon Corporation
16.10.1 Key Facts
16.10.2 Business Description
16.10.3 Products and Services
16.10.4 Financial Overview
16.10.5 SWOT Analysis
16.10.6 Key Developments
16.11 Apple Inc.
16.11.1 Key Facts
16.11.2 Business Description
16.11.3 Products and Services
16.11.4 Financial Overview
16.11.5 SWOT Analysis
16.11.6 Key Developments
17. Appendix
17.1 About The Insight Partners
17.2 Word Index
LIST OF TABLES
Table 1. 3D Mapping and Modelling Market – Revenue, and Forecast to 2028 (US$ Million)
Table 2. Brazil: 3D Mapping and Modelling Market- by Component –Revenue and Forecast to 2028 (US$ Million)
Table 3. Brazil: 3D Mapping and Modelling Market- by Software Tools – Revenue and Forecast to 2028 (US$ Million)
Table 4. Brazil: 3D Mapping and Modelling Market- by Services– Revenue and Forecast to 2028 (US$ Million)
Table 5. Brazil: 3D Mapping and Modelling Market- By 3D Mapping Application –Revenue and Forecast to 2028 (US$ Million)
Table 6. Brazil: 3D Mapping and Modelling Market- By 3D Modelling Application –Revenue and Forecast to 2028 (US$ Million)
Table 7. Brazil: 3D Mapping and Modelling Market- By Deployment Mode –Revenue and Forecast to 2028 (US$ Million)
Table 8. Brazil: 3D Mapping and Modelling Market- By Organization Size –Revenue and Forecast to 2028 (US$ Million)
Table 9. Brazil: 3D Mapping and Modelling Market- By Vertical –Revenue and Forecast to 2028 (US$ Million)
Table 10. Argentina: 3D Mapping and Modelling Market- by Component –Revenue and Forecast to 2028 (US$ Million)
Table 11. Argentina: 3D Mapping and Modelling Market- by Software Tools – Revenue and Forecast to 2028 (US$ Million)
Table 12. Argentina: 3D Mapping and Modelling Market- by Services– Revenue and Forecast to 2028 (US$ Million)
Table 13. Argentina: 3D Mapping and Modelling Market- By 3D Mapping Application –Revenue and Forecast to 2028 (US$ Million)
Table 14. Argentina: 3D Mapping and Modelling Market- By 3D Modelling Application –Revenue and Forecast to 2028 (US$ Million)
Table 15. Argentina: 3D Mapping and Modelling Market- By Deployment Mode –Revenue and Forecast to 2028 (US$ Million)
Table 16. Argentina: 3D Mapping and Modelling Market- By Organization Size –Revenue and Forecast to 2028 (US$ Million)
Table 17. Argentina: 3D Mapping and Modelling Market- By Vertical –Revenue and Forecast to 2028 (US$ Million)
Table 18. Rest of SAM: 3D Mapping and Modelling Market- by Component–Revenue and Forecast to 2028 (US$ Million)
Table 19. Rest of SAM: 3D Mapping and Modelling Market- by Software Tools – Revenue and Forecast to 2028 (US$ Million)
Table 20. Rest of SAM: 3D Mapping and Modelling Market- by Services– Revenue and Forecast to 2028 (US$ Million)
Table 21. Rest of SAM: 3D Mapping and Modelling Market- By 3D Mapping Application –Revenue and Forecast to 2028 (US$ Million)
Table 22. Rest of SAM: 3D Mapping and Modelling Market- By 3D Modelling Application –Revenue and Forecast to 2028 (US$ Million)
Table 23. Rest of SAM: 3D Mapping and Modelling Market- By Deployment Mode –Revenue and Forecast to 2028 (US$ Million)
Table 24. Rest of SAM: 3D Mapping and Modelling Market- By Organization Size –Revenue and Forecast to 2028 (US$ Million)
Table 25. Rest of SAM: 3D Mapping and Modelling Market- By Vertical –Revenue and Forecast to 2028 (US$ Million)
Table 26. List of Abbreviation
LIST OF FIGURES
Figure 1. SAM 3D Mapping and Modelling Market Segmentation
Figure 2. SAM 3D Mapping and Modelling Market Segmentation – By Country
Figure 3. SAM 3D Mapping and Modelling Market Overview
Figure 4. Software Tools Segment Held the Largest Market Share in 2020
Figure 5. On-Premises Held the Largest Market Share in 2020
Figure 6. Large Enterprises Held the Largest Market Share in 2020
Figure 7. Engineering and Construction Industry Held the Largest Market Share in 2020
Figure 8. Argentina was the Largest Revenue Contributor in 2020
Figure 9. South America – PEST Analysis
Figure 10. SAM 3D Mapping and Modelling Market– Ecosystem Analysis
Figure 11. Expert Opinions
Figure 12. 3D Mapping and Modelling Market Impact Analysis of Drivers and Restraints
Figure 13. SAM 3D Mapping and Modelling Market – Revenue and Forecast to 2028 (US$ Million)
Figure 14. SAM 3D Mapping and Modelling Market Revenue Share, by Component (2020 and 2028)
Figure 15. Software Tools: SAM 3D Mapping and Modelling Market – Revenue and Forecast to 2028 (US$ Million)
Figure 1. 3D Mapping: SAM 3D Mapping and Modelling Market- Revenue and Forecast to 2028 (US$ Million)
Figure 2. 3D Modelling: SAM 3D Mapping and Modelling Market- Revenue and Forecast to 2028 (US$ Million)
Figure 3. Services: 3D Mapping and Modelling: SAM 3D Mapping and Modelling Market– Revenue and Forecast to 2028 (US$ Million)
Figure 4. Professional Services: SAM 3D Mapping and Modelling Market- Revenue and Forecast to 2028 (US$ Million)
Figure 5. Managed Services: SAM 3D Mapping and Modelling Market- Revenue and Forecast to 2028 (US$ Million)
Figure 6. SAM 3D Mapping and Modelling Market Revenue Share, by 3D Mapping Application (2020 and 2028)
Figure 7. Inspection and Measurement: SAM 3D Mapping and Modelling Market – Revenue and Forecast to 2028 (US$ Million)
Figure 8. Object Reconstruction: SAM 3D Mapping and Modelling Market – Revenue and Forecast to 2028 (US$ Million)
Figure 9. Projection and Navigation: SAM 3D Mapping and Modelling Market – Revenue and Forecast to 2028 (US$ Million)
Figure 10. Reporting and Virtualization: SAM 3D Mapping and Modelling Market – Revenue and Forecast to 2028 (US$ Million)
Figure 11. Other SAM 3D Mapping Applications Market – Revenue and Forecast to 2028 (US$ Million)
Figure 12. SAM 3D Mapping and Modelling Market Revenue Share, by 3D Modelling Application (2020 and 2028)
Figure 13. Product Marketing: SAM 3D Mapping and Modelling Market – Revenue and Forecast to 2028 (US$ Million)
Figure 14. Animation & Movies: SAM 3D Mapping and Modelling Market – Revenue and Forecast to 2028 (US$ Million)
Figure 15. Gaming and Designing: SAM 3D Mapping and Modelling Market – Revenue and Forecast to 2028 (US$ Million)
Figure 16. Architectural Rendering: SAM 3D Mapping and Modelling Market – Revenue and Forecast to 2028 (US$ Million)
Figure 17. Other SAM 3D Modelling Application Market – Revenue and Forecast to 2028 (US$ Million)
Figure 18. SAM 3D Mapping and Modelling Market Revenue Share, by Deployment Type (2020 and 2028)
Figure 19. Cloud: SAM 3D Mapping and Modelling Market – Revenue and Forecast to 2028 (US$ Million)
Figure 20. On-premises: SAM 3D Mapping and Modelling Market – Revenue and Forecast to 2028 (US$ Million)
Figure 21. SAM 3D Mapping and Modelling Market Revenue Share, by Organization Size (2020 and 2028)
Figure 22. SMEs : SAM 3D Mapping and Modelling Market- Revenue and Forecast to 2028 (US$ Million)
Figure 23. Large Enterprises: SAM 3D Mapping and Modelling Market- Revenue and Forecast to 2028 (US$ Million)
Figure 24. SAM 3D Mapping and Modelling Market Revenue Share, by Vertical (2020 and 2028)
Figure 25. Retail and Consumer Goods : SAM 3D Mapping and Modelling Market- Revenue and Forecast to 2028 (US$ Million)
Figure 26. Engineering and Construction : SAM 3D Mapping and Modelling Market- Revenue and Forecast to 2028 (US$ Million)
Figure 27. Healthcare and Life Sciences : SAM 3D Mapping and Modelling Market- Revenue and Forecast to 2028 (US$ Million)
Figure 28. Transportation and Logistics : SAM 3D Mapping and Modelling Market- Revenue and Forecast to 2028 (US$ Million)
Figure 29. Government and Defense : SAM 3D Mapping and Modelling Market- Revenue and Forecast to 2028 (US$ Million)
Figure 30. Energy and Utilities: SAM 3D Mapping and Modelling Market- Revenue and Forecast to 2028 (US$ Million)
Figure 31. Media and Entertainment : SAM 3D Mapping and Modelling Market- Revenue and Forecast to 2028 (US$ Million)
Figure 32. Manufacturing : SAM 3D Mapping and Modelling Market– Revenue and Forecast to 2028 (US$ Million)
Figure 33. Other Verticals : SAM 3D Mapping and Modelling Market- Revenue and Forecast to 2028 (US$ Million)
Figure 34. SAM: 3D Mapping and Modelling Market – Revenue By Country to 2028 (US$ Million)
Figure 35. SAM: 3D Mapping and Modelling Market Revenue Share, By Key Country (2020 and 2028)
Figure 36. Brazil: 3D Mapping and Modelling Market – Revenue and Forecast to 2028 (US$ Million)
Figure 37. Argentina: 3D Mapping and Modelling Market – Revenue and Forecast to 2028 (US$ Million)
Figure 38. Rest of SAM: 3D Mapping and Modelling Market – Revenue and Forecast to 2028 (US$ Million)
Figure 39. Impact of COVID-19 Pandemic in South and Central America Countries Market
Yes! We provide a free sample of the report, which includes Report Scope (Table of Contents), report structure, and selected insights to help you assess the value of the full report. Please click on the "Download Sample" button or contact us to receive your copy.
Absolutely - analyst assistance is part of the package. You can connect with our analyst post-purchase to clarify report insights, methodology or discuss how the findings apply to your business needs.
Once your order is successfully placed, you will receive a confirmation email along with your invoice.
• For published reports: You'll receive access to the report within 4-6 working hours via a secured email sent to your email.
• For upcoming reports: Your order will be recorded as a pre-booking. Our team will share the estimated release date and keep you informed of any updates. As soon as the report is published, it will be delivered to your registered email.
We offer customization options to align the report with your specific objectives. Whether you need deeper insights into a particular region, industry segment, competitor analysis, or data cut, our research team can tailor the report accordingly. Please share your requirements with us, and we'll be happy to provide a customized proposal or scope.
The report is available in either PDF format or as an Excel dataset, depending on the license you choose.
The PDF version provides the full analysis and visuals in a ready-to-read format. The Excel dataset includes all underlying data tables for easy manipulation and further analysis.
Please review the license options at checkout or contact us to confirm which formats are included with your purchase.
Our payment process is fully secure and PCI-DSS compliant.
We use trusted and encrypted payment gateways to ensure that all transactions are protected with industry-standard SSL encryption. Your payment details are never stored on our servers and are handled securely by certified third-party processors.
You can make your purchase with confidence, knowing your personal and financial information is safe with us.
Yes, we do offer special pricing for bulk purchases.
If you're interested in purchasing multiple reports, we're happy to provide a customized bundle offer or volume-based discount tailored to your needs. Please contact our sales team with the list of reports you're considering, and we'll share a personalized quote.
Yes, absolutely.
Our team is available to help you make an informed decision. Whether you have questions about the report's scope, methodology, customization options, or which license suits you best, we're here to assist. Please reach out to us at sales@theinsightpartners.com, and one of our representatives will get in touch promptly.
Yes, a billing invoice will be automatically generated and sent to your registered email upon successful completion of your purchase.
If you need the invoice in a specific format or require additional details (such as company name, GST, or VAT information), feel free to contact us, and we'll be happy to assist.
Yes, certainly.
If you encounter any difficulties accessing or receiving your report, our support team is ready to assist you. Simply reach out to us via email or live chat with your order information, and we'll ensure the issue is resolved quickly so you can access your report without interruption.
The Insight Partners performs research in 4 major stages: Data Collection & Secondary Research, Primary Research, Data Analysis and Data Triangulation & Final Review.
- Data Collection and Secondary Research:
As a market research and consulting firm operating from a decade, we have published many reports and advised several clients across the globe. First step for any study will start with an assessment of currently available data and insights from existing reports. Further, historical and current market information is collected from Investor Presentations, Annual Reports, SEC Filings, etc., and other information related to company’s performance and market positioning are gathered from Paid Databases (Factiva, Hoovers, and Reuters) and various other publications available in public domain.
Several associations trade associates, technical forums, institutes, societies and organizations are accessed to gain technical as well as market related insights through their publications such as research papers, blogs and press releases related to the studies are referred to get cues about the market. Further, white papers, journals, magazines, and other news articles published in the last 3 years are scrutinized and analyzed to understand the current market trends.
- Primary Research:
The primarily interview analysis comprise of data obtained from industry participants interview and answers to survey questions gathered by in-house primary team.
For primary research, interviews are conducted with industry experts/CEOs/Marketing Managers/Sales Managers/VPs/Subject Matter Experts from both demand and supply side to get a 360-degree view of the market. The primary team conducts several interviews based on the complexity of the markets to understand the various market trends and dynamics which makes research more credible and precise.
A typical research interview fulfils the following functions:
- Provides first-hand information on the market size, market trends, growth trends, competitive landscape, and outlook
- Validates and strengthens in-house secondary research findings
- Develops the analysis team’s expertise and market understanding
Primary research involves email interactions and telephone interviews for each market, category, segment, and sub-segment across geographies. The participants who typically take part in such a process include, but are not limited to:
- Industry participants: VPs, business development managers, market intelligence managers and national sales managers
- Outside experts: Valuation experts, research analysts and key opinion leaders specializing in the electronics and semiconductor industry.
Below is the breakup of our primary respondents by company, designation, and region:

Once we receive the confirmation from primary research sources or primary respondents, we finalize the base year market estimation and forecast the data as per the macroeconomic and microeconomic factors assessed during data collection.
- Data Analysis:
Once data is validated through both secondary as well as primary respondents, we finalize the market estimations by hypothesis formulation and factor analysis at regional and country level.
- 3.1 Macro-Economic Factor Analysis:
We analyse macroeconomic indicators such the gross domestic product (GDP), increase in the demand for goods and services across industries, technological advancement, regional economic growth, governmental policies, the influence of COVID-19, PEST analysis, and other aspects. This analysis aids in setting benchmarks for various nations/regions and approximating market splits. Additionally, the general trend of the aforementioned components aid in determining the market's development possibilities.
- 3.2 Country Level Data:
Various factors that are especially aligned to the country are taken into account to determine the market size for a certain area and country, including the presence of vendors, such as headquarters and offices, the country's GDP, demand patterns, and industry growth. To comprehend the market dynamics for the nation, a number of growth variables, inhibitors, application areas, and current market trends are researched. The aforementioned elements aid in determining the country's overall market's growth potential.
- 3.3 Company Profile:
The “Table of Contents” is formulated by listing and analyzing more than 25 - 30 companies operating in the market ecosystem across geographies. However, we profile only 10 companies as a standard practice in our syndicate reports. These 10 companies comprise leading, emerging, and regional players. Nonetheless, our analysis is not restricted to the 10 listed companies, we also analyze other companies present in the market to develop a holistic view and understand the prevailing trends. The “Company Profiles” section in the report covers key facts, business description, products & services, financial information, SWOT analysis, and key developments. The financial information presented is extracted from the annual reports and official documents of the publicly listed companies. Upon collecting the information for the sections of respective companies, we verify them via various primary sources and then compile the data in respective company profiles. The company level information helps us in deriving the base number as well as in forecasting the market size.
- 3.4 Developing Base Number:
Aggregation of sales statistics (2020-2022) and macro-economic factor, and other secondary and primary research insights are utilized to arrive at base number and related market shares for 2022. The data gaps are identified in this step and relevant market data is analyzed, collected from paid primary interviews or databases. On finalizing the base year market size, forecasts are developed on the basis of macro-economic, industry and market growth factors and company level analysis.
- Data Triangulation and Final Review:
The market findings and base year market size calculations are validated from supply as well as demand side. Demand side validations are based on macro-economic factor analysis and benchmarks for respective regions and countries. In case of supply side validations, revenues of major companies are estimated (in case not available) based on industry benchmark, approximate number of employees, product portfolio, and primary interviews revenues are gathered. Further revenue from target product/service segment is assessed to avoid overshooting of market statistics. In case of heavy deviations between supply and demand side values, all thes steps are repeated to achieve synchronization.
We follow an iterative model, wherein we share our research findings with Subject Matter Experts (SME’s) and Key Opinion Leaders (KOLs) until consensus view of the market is not formulated – this model negates any drastic deviation in the opinions of experts. Only validated and universally acceptable research findings are quoted in our reports.
We have important check points that we use to validate our research findings – which we call – data triangulation, where we validate the information, we generate from secondary sources with primary interviews and then we re-validate with our internal data bases and Subject matter experts. This comprehensive model enables us to deliver high quality, reliable data in shortest possible time.

May 2021
Emergency Response Software Market
Size and Forecast (2021 - 2034), Global and Regional Share, Trend, and Growth Opportunity Analysis Report Coverage: By Incident Lifecycle (Before the Incident, During the Incident, and After the Incident), Deployment (Cloud and On-premises), Application (Disaster Management, Incident Management, Risk Management, and Others), and Geography (North America, Europe, Asia Pacific, Middle East and Africa, and South and Central America)
May 2021
AI in Automotive Market
Size and Forecast (2021 - 2034), Global and Regional Share, Trend, and Growth Opportunity Analysis Report Coverage: By Component (Software, Hardware, and Services), Deployment (Cloud and On Premises), Organization Size (Large Enterprises and SMEs), and Geography (North America, Europe, Asia Pacific, Middle East and Africa, and South America)
May 2021
AI in Healthcare Market
Size and Forecast (2021 - 2034), Global and Regional Share, Trend, and Growth Opportunity Analysis Report Coverage: By Component (Software, Hardware, and Services), Deployment (Cloud and On Premises), Organization Size (Large Enterprises and SMEs), and Geography (North America, Europe, Asia Pacific, Middle East and Africa, and South America)
May 2021
AI in BFSI Market
Size and Forecast (2021 - 2034), Global and Regional Share, Trend, and Growth Opportunity Analysis Report Coverage: By Component (Software, Hardware and Services), Deployment (Cloud and On Premises), Organization Size (Large Enterprises and SMEs), and Geography (North America, Europe, Asia Pacific, Middle East and Africa, and South America)
May 2021
AI in IT and Telecom Market
Size and Forecast (2021 - 2034), Global and Regional Share, Trend, and Growth Opportunity Analysis Report Coverage: By Component (Software, Hardware, and Services), Deployment (Cloud and On-Premises ), Organization Size (Large Enterprises and SMEs), and Geography (North America, Europe, Asia Pacific, Middle East and Africa, and South America)
May 2021
Public Safety Solutions Market
Size and Forecast (2021 - 2034), Global and Regional Share, Trend, and Growth Opportunity Analysis Report Coverage: By Component (Hardware, Software, and Services), Hardware Type (Imaging and Video Hardware, Mobile and Wearable Devices, Connectivity and Edge Hardware, Sensors and Telemetry Devices, In-Vehicle Computing Hardware, Medical Devices (EMS-Focused), and Others), Software Type (Cloud-Based Public Safety Platforms, Analytics and AI Software, Video and Imaging Software, Responder Mobile Applications, In-Vehicle Software (Mobile Apps), and Others), Imaging And Video Hardware Type (Dash Cameras, Thermal Cameras, and In Cab Cameras), Mobile And Wearable Devices Type (Body-Worn Cameras, Rugged Smartphones, and Handheld Radios), Connectivity And Edge Hardware Type (LTE or 5G Routers, Vehicle Gateways and Edge Computing Devices), Sensors And Telemetry Devices Type (GPS Sensors, Accelerometers, Crash Sensors, and Environmental Sensors), In-vehicle Computing Hardware (Mobile Data Terminals, Rugged Laptops, and Vehicle Mounted Tablets), Medical Devices Type (Cardiac Monitors, Connected Defibrillators and Pulse Oximeters), Vehicle Type (Patrol Cars, Ambulances, Fire Trucks, Specialized Emergency Vehicles, and Others), End User (Law Enforcement or Police, Medical Emergency, Fire, and Others), and Geography (North America, Europe, Asia Pacific, Middle East and Africa, South and Central America)
May 2021
Data Center Air Cooling Market
Size and Forecast (2021 - 2031), Global and Regional Share, Trend, and Growth Opportunity Analysis Report Coverage: By Cooling Type (Room-Based Cooling, Row-Based Cooling, and Rack-Based Cooling), Data Center Type (Hyperscale Data Center, Colocation Data Center, Wholesale Data Center, and Enterprise Data Center), Industry Vertical (IT and Telecom, BFSI, Healthcare, Manufacturing, Government and Defense, Media and Entertainment, Retail, Energy, and Others), and Geography (North America, Europe, Asia Pacific, Middle East and Africa, and South and Central America)
May 2021
Infrastructure Cybersecurity Market
Size and Forecast (2021 - 2031), Global and Regional Share, Trend, and Growth Opportunity Analysis Report Coverage: By Component (Solution and Services), Organization Size (Large Enterprises and SMEs), Industry Vertical (BFSI, IT and Telecom, Government, Healthcare, Manufacturing, Retail and Ecommerce, and Others), and Geography (North America, Europe, Asia Pacific, Middle East and Africa, and South and Central America)
 Get Free Sample For