
Utility Communication Market Developments and Forecast by 2031
Utility Communication Market Size and Forecast (2021 - 2031) Global and Regional Share, Trend, and Growth Opportunity Analysis Report Coverage By : Technology [Wired (Optic Fiber, Power Line Carrier (PLC), Ethernet, Other Technology Types) and Wireless]; Utility Type (Private Utility and Public Utility); and Geography
- Status : Data Released
- Report Code : TIPRE00009082
- Category : Electronics and Semiconductor
- No. of Pages : 150
- Available Report Formats :


- Last update date : August 01, 2024

2023 Market Size
US$ 21.16 Bn
Base year value
2031 Forecast
US$ 32.28 Bn
Projected by 2031
CAGR 2024-2031
5.4 %
Growth rate
Addressable Market
US$ 216.04 Bn
(2024-2031)
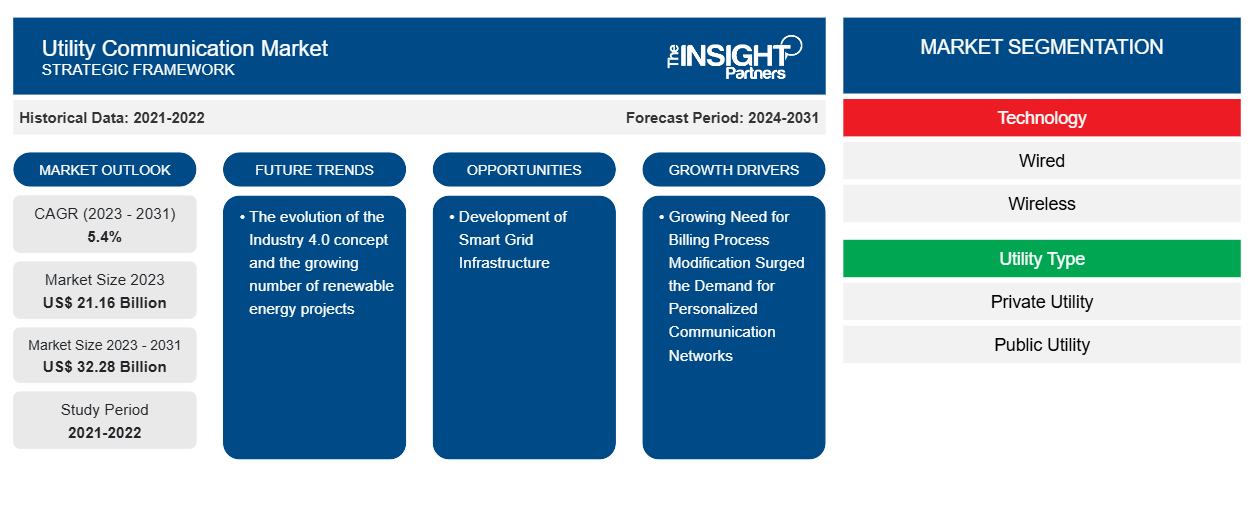
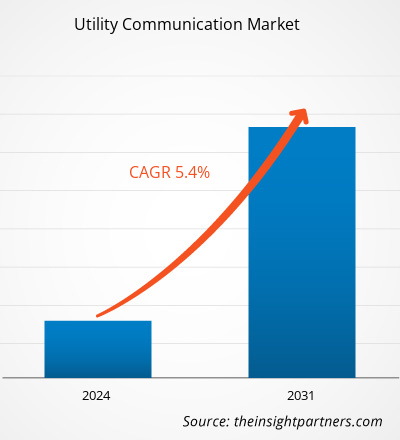
The utility communication market size is projected to reach US$ 32.28 billion by 2031 from US$ 21.16 billion in 2023. The market is expected to register a CAGR of 5.4% in 2023–2031. The evolution of the Industry 4.0 concept and the growing number of renewable energy projects are likely to remain a key utility communication market trends.
Utility Communication Market Analysis
The utility communication market is growing at a rapid pace due to the growing need for billing process modification surged the demand for personalized communication networks and the increasing demand for distributed energy resources (DER). The market is expanding steadily, driven by favorable government initiatives and investment to promote to development of power infrastructure. Moreover, the development of smart grid infrastructure and the rising adoption of technologically advanced systems integrated with the Internet of Things (IoT) and artificial intelligence (AI) are providing lucrative opportunities for market growth.
Utility Communication Market Overview
Utility communication is systems that ensure more reliable, secure, and safe transmission of data, video, and voice across WANs and LANs. This communication system offers users the benefits of easy installation in hazardous locations. The utility communication system works by using numerous networks, including video surveillance, smart grid, supervisory control & data acquisition (SADA) system, and ethernet-based connectivity. Moreover, the growing demand for wired and wireless communication systems by utility for monitoring power consumption and distribution is boosting the market during the forecast period.
Market Research Highlights
- Global market for Utility Communication was valued at US$ 21.16 Billion in 2023
- Annual market size is expected to reach US$ 32.28 Billion by 2031
- Total addressable market (TAM) during 2024-2031 is projected to reach approximately US$ 216.04 Billion
- Market is anticipated to register a CAGR of 5.4% during the forecast period
- The United States represents a key market, supported by Growing Need for Billing Process Modification Surged the Demand for Personalized Communication Networks, as well as evolving industry dynamics
- Market analysis covers North America, Europe, Asia-Pacific, South and Central America, Middle East and Africa, with growth evaluated across the forecast period
- Market opportunities such as Development of Smart Grid Infrastructure are expected to influence market dynamics and addressable market
- Report profiles industry participants, including ABB Ltd, FUJITSU LIMITED, General Electric Company, Honeywell International Inc, OMICRON Electronics GmbH, Rockwell Automation, Inc., Schneider Electric SE, Siemens AG, Tejas Networks, Telefonaktiebolaget LM Ericsson, while analyzing competitive strategies and innovation developments
-
Source: The Insight Partners' analysis based on proprietary research, government publications, company annual reports, investor presentations, industry databases, and expert interviews.
● REPORT CUSTOMIZATION
Tailor This Report To Align With Your Specific Business Requirements
This report can be customized to align precisely with your business objectives, scope, and target markets. Customization options include tailored segmentation, geography, competitive analysis, and strategic insights to support informed decision-making.
Customize This Report →WHAT YOU CAN ADJUST
- ● Segmentations
- ● Geography
- ● Competitive Analysis
- ● Language Preferences
Utility Communication Market: Strategic Insights
-
Get Top Key Market Trends of this report.This FREE sample will include data analysis, ranging from market trends to estimates and forecasts.
Utility Communication Market Drivers and Opportunities
Growing Need for Billing Process Modification Surged the Demand for Personalized Communication Networks is Driving the Market
Utility bills are the primary method used by utilities for informing individuals about their electricity consumption, followed by bill payments from consumers. The bills are also used to inform and remind consumers of their outstanding amounts from earlier usage. The modification of billing systems makes it easier to track consumers with bad debt or those engaging in fraudulent operations. These modifications encourage market players to launch new innovative accounting solutions for a variety of applications. For example, the Siemens EnergyIP Meter Data Management (MDM) program streamlines smart meter data management business operations. Its extensive collection of tools enables utilities to handle conventional use cases, such as meter-to-cash billing data and emergent use cases, which leverage loT-driven data from registers, times, and time-of-use to serve a variety of mission-critical business applications. Furthermore, distributed power generation and multiple distribution lines make the invoicing process more complex and prone to errors. This is increasing demand for the standardization and automation of utility communication billing and bill payment methods, resulting in a desire for individualized communication networks.
Development of Smart Grid Infrastructure - An Opportunity in the Utility Communication Market
Smart grid infrastructure is crucial in the communications industry of energy and power utilities. A smart grid influences ICT to converge and allow for the flow of real-time information between power utilities and their suppliers, partners, and commercial and residential customers operating inside power utilities. The implementation of smart grids heavily relies on a strong, secure, highly ascendable, and constant availability of communication network. An effective communication network has the willingness to increase service efficiency by allowing the utility industry to assure regulatory compliance and reduce the negative effects of cost-cutting measures. Thus, the utility communications network serves as the foundation of a two-way connection between systems with all data points. It helps utility operators to track and manage grid equipment, measure network output, and provide real-time data. Hence, the expanding use of smart grid systems in the utility communications sector is expected to create opportunities for the worldwide utility communication market during the forecast period.
Utility Communication Market Report Segmentation Analysis
Key segments that contributed to the derivation of the utility communication market analysis are technology and utility type.
- Based on technology, the utility communication market is divided into wired and wireless. The wired segment is further subsegmented into optic fiber, power line carrier (PLC), ethernet, other technology types. The wired segment held a larger market share in 2023.
- In terms of utility type, the utility communication market is categorized as private utility and public utility. The public utility segment held a larger market share in 2023.
Utility Communication Market Share Analysis by Geography
The geographic scope of the utility communication market report is mainly divided into five regions: North America, Asia Pacific, Europe, Middle East & Africa, and South America/South & Central America.
The market in Asia Pacific is projected to expand during the forecast period, due to the expanding utility industry and the growing demand for smart city infrastructure. Governments of various nations, including China, India, Japan, and others, are making significant investments to develop and upgrade existing power infrastructure. Moreover, the growing demand for real-time monitoring, power consumption, and reducing outages surging the demand and incorporation of utility communication networks. Moreover, the rising adoption of the Internet of Things (IoT) and artificial intelligence (AI) technologies to automate the utility communication system is expected to create opportunities for market growth.
Utility Communication Market News and Recent Developments
The utility communication market is evaluated by gathering qualitative and quantitative data post primary and secondary research, which includes important corporate publications, association data, and databases. The following is a list of developments in the market for utility communication and strategies:
- In July 2022, The Truckee Donner Public Utility District (TDPUD) unveiled a new Outage Management System, which will improve the timeliness and accuracy of outage communication with customers. The TDPUD has committed to providing this community with the best power and water service possible and continuing to reinvest rate-payer dollars back into our utilities and infrastructure. (Source: Truckee Donner Public Utility District (TDPUD), Press Release, 2022)
- In March 2021, Itron Inc. announced the launch of its eHZ-B residential smart meter for utilities and cities in Germany. The latest addition to Itron’s proven 3.HZ FNN-compliant portfolio, the eHZ-B smart meter is built with advanced functionality to support Germany’s ongoing energy transition to a low carbon, environmentally sound, reliable, and affordable energy supply and equip utilities and cities to safely migrate to a smart and connected distribution network. (Source: Itron Inc., Press Release, 2021)
Utility Communication Market Report Coverage and Deliverables
The “Utility Communication Market Size and Forecast (2023–2031)” report provides a detailed analysis of the market covering below areas:
- Market size and forecast at global, regional, and country levels for all the key market segments covered under the scope
- Market dynamics such as drivers, restraints, and key opportunities
- Key future trends
- Detailed PEST/Porter’s Five Forces and SWOT analysis
- Global and regional market analysis covering key market trends, major players, regulations, and recent market developments
- Industry landscape and competition analysis covering market concentration, heat map analysis, prominent players, and recent developments
- Detailed company profiles
Utility Communication Market Report Scope
| Report Attribute | Details |
|---|---|
| Market size in 2023 | US$ 21.16 Billion |
| Market Size by 2031 | US$ 32.28 Billion |
| Global CAGR (2023 - 2031) | 5.4% |
| Historical Data | 2021-2022 |
| Forecast period | 2024-2031 |
| Segments Covered |
By Technology
|
| Regions and Countries Covered |
North America
|
| Market leaders and key company profiles |
|
Utility Communication Market Players Density: Understanding Its Impact on Business Dynamics
The Utility Communication Market is growing rapidly, driven by increasing end-user demand due to factors such as evolving consumer preferences, technological advancements, and greater awareness of the product's benefits. As demand rises, businesses are expanding their offerings, innovating to meet consumer needs, and capitalizing on emerging trends, which further fuels market growth.
Frequently Asked Questions

- Comprehensive Market Sizing and Forecast Analysis
- Detailed Segmentation Analysis
- In-Depth Market Dynamics Assessment
- Regional and Country-Level Insights
- Competitive Landscape and Company Benchmarking
- Strategic Business Intelligence
Recent Reports
Testimonials
The Insight Partners' SCADA System Market report is comprehensive, with valuable insights on current trends and future forecasts. The team was highly professional, responsive, and supportive throughout. We are very satisfied and highly recommend their services.
RAN KEDEM Partner, Reali Technologies LTDsI requested a report on a very specific software market and the team produced the report in a few days. The information was very relevant and well presented. I then requested some changes and additions to the report. The team was again very responsive and I got the final report in less than a week.
JEAN-HERVE JENN Chairman, Future AnalyticaWe worked with The Insight Partners for an important market study and forecast. They gave us clear insights into opportunities and risks, which helped shape our plans. Their research was easy to use and based on solid data. It helped us make smart, confident decisions. We highly recommend them.
PIYUSH NAGPAL Sr. Vice President, High Beam GlobalThe Insight Partners delivered insightful, well-structured market research with strong domain expertise. Their team was professional and responsive throughout. The user-friendly website made accessing industry reports seamless. We highly recommend them for reliable, high-quality research services
YUKIHIKO ADACHI CEO, Deep Blue, LLC.This is the first time I have purchased a market report from The Insight Partners.While I was unsure at first, I visited their web site and felt more comfortable to take the risk and purchase a market report.I am completely satisfied with the quality of the report and customer service. I had several questions and comments with the initial report, but after a couple of dialogs over email with their analyst I believe I have a report that I can use as input to our strategic planning process.Thank you so much for taking the extra time and making this a positive experience.I will definitely recommend your service to others and you will be my first call when we need further market data.
JOHN SUZUKI President and Chief Executive Officer, Board Director, BK TechnologiesI wish to appreciate your support and the professionalism you displayed in the course of attending to my request for information regarding to infectious disease IVD market in Nigeria. I appreciate your patience, your guidance, and the fact that you were willing to offer a discount, which eventually made it possible for us to close a deal. I look forward to engaging The Insight Partners in the future, all thanks to the impression you have created in me as a result of this first encounter.
DR CHIJIOKE ONYIA MANAGING DIRECTOR, PineCrest Healthcare Ltd.Reason to Buy
- Informed Decision-Making
- Understanding Market Dynamics
- Competitive Analysis
- Identifying Emerging Markets
- Customer Insights
- Market Forecasts
- Risk Mitigation
- Boosting Operational Efficiency
- Strategic Planning
- Investment Justification
- Tracking Industry Innovations
- Aligning with Regulatory Trends


