大麻测试市场分析及预测(按规模、份额、增长和趋势)2028
大麻测试市场规模及预测至 2028 年——COVID-19 影响及全球分析,按产品(分析仪器、耗材和软件)、类型(效力测试、萜烯分析、残留溶剂筛选、微生物分析、农药筛选、重金属测试和基因测试)、最终用户(测试实验室、药品制造商和研究机构)、便携性(手持设备和独立设备)和地理位置划分
- 状态 : 已发布
- 报告代码 : TIPHE100001394
- 类别 : 生命科学
- 页数 : 214
- 可用报告格式 :


- 最后更新日期 : June 13, 2024


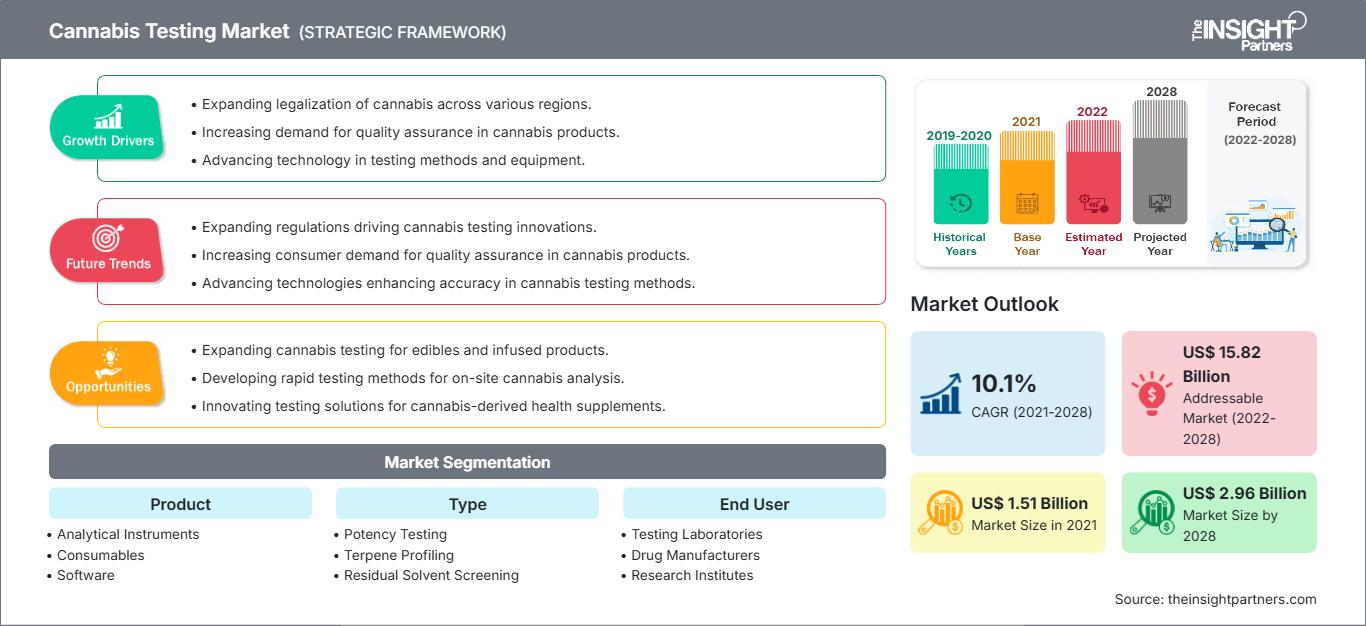
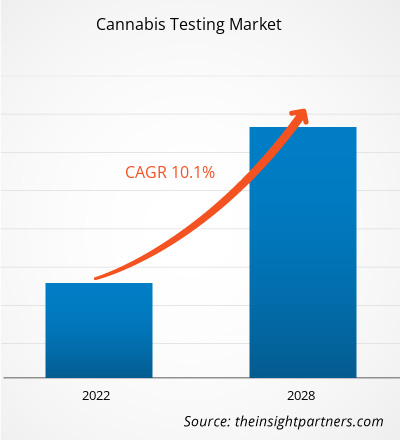
[研究报告]2021 年大麻检测市场价值 15.1206 亿美元,预计到 2028 年将达到 29.602 亿美元;预计 2021 年至 2028 年的复合年增长率为 10.1%。市场洞察和分析师观点:
大麻检测用于各种应用,包括确定各种分析样品(例如药物)中的大麻浓度。它还有助于检测细菌和真菌等污染物。此外,大麻检测还用于测定砷、镉等微量金属,如果不加以控制,这些金属会对健康产生不利影响。这些测试借助各种分析技术进行,包括色谱分析、光谱法、ELISA、聚合酶链式反应 (PCR) 等。医用大麻合法化以及通过会议、研讨会等提高认识等因素……研讨会促进了大麻检测市场的增长。此外,大麻检测实验室越来越多地采用 LIMS 也推动了大麻检测市场的增长。
增长动力和挑战:
美国的大麻检测市场预计将成为医用大麻使用增长的主要驱动力。美国已有 30 个州将大麻合法化。这 30 个州的人口占总人口的 60%,并已批准使用医用大麻。这已成为整个北美地区大麻检测增长的驱动力。目前,美国拥有超过 8000 个有效的大麻业务许可证。它是唯一拥有如此多市场参与者的国家。欧洲是另一个大麻检测市场增长率不错的地区。欧洲国家的大麻合法化进程正在加快。2018 年 11 月,英国政府宣布医用大麻合法。大麻需求增长的主要动力是欧洲将大麻用于杀虫剂。越来越多的大麻检测实验室刺激了欧洲地区对大麻的需求。
亚太地区对大麻检测市场的需求巨大。这是因为大麻的医疗用途是治疗各种疾病,例如慢性神经性疼痛和任何脊髓损伤。它还有助于治疗艾滋病毒感染引起的厌食症,这是该地区面临的主要挑战。2018年12月,泰国成为东南亚第一个将大麻合法化的国家。对大麻检测实验室的投资大幅增加,最近的法律变化也导致了对大麻和大麻制品的接受。
同样,2019年,在印度中央邦,邦政府将工业和药用大麻种植合法化。此外,印度其他几个邦也正在将大麻种植合法化。例如,2021年3月,喜马偕尔邦首席部长宣布,该邦政府正在制定新政策,允许种植用于医疗和工业用途的大麻,以促进当地经济发展。此外,印度特里普拉邦政府正在组建一个专家小组,以推动大麻种植合法化。
因此,随着大麻合法化的不断推进,大麻检测市场预计将快速增长。
自定义此报告以满足您的要求
您将免费获得任何报告的定制,包括本报告的部分内容,或国家级分析、Excel 数据包,以及为初创企业和大学提供超值优惠和折扣
大麻测试市场: 战略洞察
-
获取本报告的主要市场趋势。这个免费样本将包括数据分析,从市场趋势到估计和预测。
“全球大麻检测市场”根据产品、应用、最终用途、便携性和地域进行细分。大麻检测市场按产品细分为分析仪器、耗材和软件。分析仪器进一步细分为色谱仪器、光谱仪和其他分析仪器。根据应用,大麻检测市场细分为效力测试、萜烯分析、残留溶剂筛选、微生物分析、农药筛选、重金属检测和基因检测。根据最终用途,大麻检测市场细分为检测实验室、药品制造商和研究机构。根据便携性,大麻检测市场细分为手持设备和独立设备。根据地域划分,大麻测试市场分为北美(美国、加拿大和墨西哥)、欧洲(德国、法国、意大利、英国、俄罗斯和欧洲其他地区)、亚太地区(澳大利亚、中国、日本、印度、韩国和亚太其他地区)、中东和非洲(南非、沙特阿拉伯、阿联酋和中东和非洲其他地区)以及南美洲和中美洲(巴西、阿根廷和南美洲和中美洲其他地区)。
分部分析:
根据产品,大麻测试市场分为分析仪器、消耗品和软件。分析仪器进一步细分为色谱仪器、光谱仪和其他分析仪器。分析仪器部门在 2020 年占据了最大的市场份额;而消耗品部门在预测期内可能会以最高速度增长。患者和消费者依赖他们所消费的产品的安全性和一致性。耗材涵盖大多数多用户产品,这些产品与色谱和光谱仪器配合使用,可进行多项大麻测试。用于大麻测试的耗材范围包括色谱柱、标准品和 CRMS、耗材和其他配件。由于耗材产品会被多次购买,且大多数不可重复使用,因此预计耗材领域将在全球大麻测试市场中增长最快。因此,对大麻的研究日益深入,预计将产生更多耗材需求,从而推动大麻测试市场的增长。
根据应用,大麻测试市场可细分为效力测试、萜烯分析、残留溶剂筛选、微生物分析、农药筛选、重金属测试和基因测试。效力测试领域在 2020 年占据了最大的市场份额;并且该领域在预测期内可能会以更高的速度增长。由于近期大麻法律的变化和态度的变化,大麻如今已成为全球一个快速增长的产业。医用大麻需要经过实验室测试,需要聘请了解实验室设置和各种测试程序的合格人员。大麻的效力是指被测样品中所含大麻素的百分比。根据测试所在州的不同,需要检测样品的四氢大麻酚 (THC) 和大麻二酚 (CBD) 含量,以及四氢大麻酚和大麻二酚酸。其他实验室也可能选择检测样品的大麻二酚 (CBC) 和大麻二酚 (CBG)。效力测试涉及多种基质的气相色谱或液相色谱分析。
根据最终用途,大麻测试市场可细分为测试实验室、药品制造商和研究机构。测试实验室在 2020 年占据了最大的市场份额;并且该细分市场在预测期内可能会以更高的速度增长。适当的大麻测试对于证明这些产品不含有害水平的污染物或掺假物并且可供公众安全消费至关重要。在过去的几十年里,美国和许多其他工业化国家的检测实验室数量和规模显著增加。这种增长的原因有很多,但观察人士普遍认为,产品检测的增长是主要原因。安全性、客观性和经济性是未来几年该领域增长的三个关键因素。
根据便携性,大麻检测市场可细分为手持设备和独立设备。独立设备在2020年占据了最大的市场份额;而手持设备在预测期内可能会以更高的速度增长。新鲜植物中的大麻素含量每天都在变化。因此,选择合适的收获时间非常困难。此外,由于检测费用昂贵或不准确,一些种植者在监测植物方面面临诸多问题。种植者在实验室检测上花费了大量资金。因此,开发便携式且价格合理的大麻检测仪有助于避免法医实验室结果的延迟。
区域分析:
根据地理位置,大麻检测市场分为五个主要区域:北美、欧洲、亚太地区、南美和中美以及中东和非洲。2020 年,北美占据全球大麻检测市场的最大份额,预计亚太地区在预测期内的复合年增长率最高。北美是大麻药物检测的最大市场,其中美国占有最大的市场份额,其次是加拿大。北美的增长特点是大麻药品审批的增加。此外,药物调查服务的增加、大麻药用应用的增加以及毒理学实验室数量的增加是促进大麻检测市场增长的关键因素。
行业发展与未来机遇:
全球大麻检测市场主要参与者采取的各种举措如下:
- 2023年1月,布法罗实验室获得美国大麻管理办公室(OAC)的大麻检测批准。获批实验室可检测农药、重金属和水分等物质。
- 2021年1月,安捷伦科技公司宣布推出MassHunter Workstation Plus 11.0、MassHunter BioConfirm和MassHunter Networked Workstation 11.0。这些产品符合欧盟(EMEA)和美国FDA的监管要求。
- 2020年11月,沃特世公司推出了全新的RADIAN ASAP系统。这是一款专为非质谱 (MS) 专业人士设计的新型直接质谱检测器,可快速准确地分析固体和液体,且样品制备工作量极少。
- 2020 年 7 月,安捷伦科技公司宣布推出创新型在线工具和全新耗材套装。该套装可加快大麻和汉麻效力以及农药/霉菌毒素检测的设置和分析速度。该产品在市场上被称为大麻和汉麻效力试剂盒和大麻农药和霉菌毒素试剂盒。
大麻测试市场区域洞察
The Insight Partners 的分析师已详尽阐述了预测期内影响大麻测试市场的区域趋势和因素。本节还讨论了北美、欧洲、亚太地区、中东和非洲以及南美和中美洲的大麻测试市场细分和地域分布。
大麻测试市场报告范围
| 报告属性 | 细节 |
|---|---|
| 市场规模 2021 | US$ 1.51 Billion |
| 市场规模 2028 | US$ 2.96 Billion |
| 全球复合年增长率 (2021 - 2028) | 10.1% |
| 历史数据 | 2019-2020 |
| 预测期 | 2022-2028 |
| 涵盖的领域 |
By 产品
|
| 覆盖地区和国家 |
北美
|
| 市场领导者和主要公司简介 |
|
大麻测试市场参与者密度:了解其对商业动态的影响
大麻测试市场正在快速增长,这得益于终端用户需求的不断增长,而这些需求的驱动因素包括消费者偏好的演变、技术进步以及对产品益处的认知度的提升。随着需求的增长,企业正在扩展其产品线,不断创新以满足消费者需求,并抓住新兴趋势,从而进一步推动市场增长。
- 获取 大麻测试市场 主要参与者概述
COVID-19 疫情影响了全球多个国家的经济和行业。北美、欧洲、亚太地区 (APAC)、南美和中美 (SAM) 以及中东和非洲 (MEA) 的封锁、旅行限制和企业倒闭阻碍了包括医疗保健行业在内的多个行业的增长。制造部门的关闭扰乱了全球供应链、制造活动、交付时间表以及各种必需品和非必需品(包括医疗保健产品和服务)的销售。多家公司宣布 2020 年产品交付可能出现延迟,产品未来销量也可能出现下滑。这还包括 COVID-19 疫情对所有地区市场的影响。疫情的影响和全球研究活动的减少也损害了大麻测试市场中多家公司的运营和财务执行。由于学术和研究机构以及测试实验室的关闭,实验室进行的大麻测试数量有所减少。例如,根据 MJBizDaily 在 2020 年 3 月发布的一份报告,加拿大大多数联邦管理的大麻实验室都协助进行 COVID-19 检测,从而影响了实验室进行的大麻检测数量。此外,由于商店关门、检测实验室关闭、供应链中断、全球经济放缓以及人员流动受限,大麻市场也损失了一些收入。
竞争格局和主要公司:
全球大麻检测市场的一些知名参与者包括 Purpl Scientific、Orange Photonics Inc、Agilent Technologies Inc.、Shimadzu Corporation、Merck KGaA、Restek Corporation、WATERS、CannaSafe Analytics、Accelerated Technology Laboratories, Inc 和 Digipath Inc.。这些公司专注于新产品的推出和地域扩张,以满足全球不断增长的消费者需求,并增加其专业产品组合的范围。它们拥有广泛的全球影响力,这使它们能够服务于大量客户,从而增加其市场份额。

Mrinal 是一位经验丰富的研究分析师,在生命科学市场情报和咨询领域拥有超过 8 年的经验。凭借战略思维和对卓越的不懈追求,她在医药预测、市场机遇评估和行业基准制定方面积累了深厚的专业知识。她的工作致力于提供切实可行的洞察,帮助客户做出明智的战略决策。
Mrinal 的核心优势在于将复杂的定量数据集转化为有意义的商业智能。她敏锐的分析能力有助于制定市场进入 (GTM) 战略,并发掘制药和医疗器械行业的增长机会。作为一名值得信赖的顾问,她始终致力于简化工作流程并建立最佳实践,从而为客户推动创新并提高运营效率。
- 全面的市场规模与预测分析
- 详细的细分市场分析
- 深入的市场动态评估
- 区域及国家级洞察
- 竞争格局与企业对标分析
- 战略性商业情报
客户评价
Insight Partners 的 SCADA 系统市场报告内容全面,对当前趋势和未来预测提供了宝贵的见解。该团队始终高度专业、响应迅速且乐于助人。我们非常满意,强烈推荐他们的服务。
兰·凯德姆 伙伴, Reali Technologies LTD我请求一份关于特定软件市场的报告,团队在几天内就完成了。报告信息非常相关,而且呈现得非常出色。之后,我请求对报告进行一些修改和补充。团队再次迅速响应,不到一周我就收到了最终报告。
让-埃尔韦·詹恩 主席, 未来分析公司我们与 Insight Partners 合作进行了一项重要的市场研究和预测。他们清晰地洞察了机遇和风险,帮助我们制定了计划。他们的研究简单易用,数据可靠,帮助我们做出了明智而自信的决策。我们强烈推荐他们。
皮尤什·纳格帕尔 高级副总裁, 远光全球Insight Partners 凭借其深厚的行业专业知识,提供了富有洞察力、结构合理的市场研究。他们的团队始终专业且响应迅速。用户友好的网站让访问行业报告变得顺畅无阻。我们强烈推荐他们可靠、高质量的研究服务。
安达幸彦 首席执行官, 深蓝有限责任公司这是我第一次从The Insight Partners购买市场报告。起初我有些犹豫,但访问了他们的网站后,我更放心地冒险购买市场报告。我对报告的质量和客户服务非常满意。我对最初的报告有一些疑问和意见,但在与他们的分析师通过电子邮件沟通了几次后,我相信这份报告可以作为我们战略规划流程的参考。非常感谢您抽出宝贵的时间,让这次体验如此愉快。我一定会向其他人推荐你们的服务,当我们需要更多市场数据时,你们将是我的首选。
约翰·铃木 总裁兼首席执行官、董事会董事, BK科技感谢您在处理我关于尼日利亚传染病体外诊断市场信息请求的过程中所展现的支持和专业精神。感谢您的耐心、指导,以及您愿意提供的折扣,最终促成了这笔交易。我期待未来与 Insight Partners 继续合作,这一切都要归功于您与我初次接触后留下的良好印象。
奇吉奥克博士 ONYIA 董事总经理, PineCrest 医疗保健有限公司购买理由
- 明智的决策
- 了解市场动态
- 竞争分析
- 客户洞察
- 市场预测
- 风险规避
- 战略规划
- 投资论证
- 识别新兴市场
- 优化营销策略
- 提升运营效率
- 顺应监管趋势


