
一次性纸杯市场趋势、规模及2034年预测
一次性纸杯市场规模及预测(2021-2034 年),全球及区域份额、趋势及增长机会分析报告涵盖范围:按类型(单层热饮杯、双层热饮杯、冷饮杯和特殊用途杯)、按材料(原生纸板和再生纸板)、按涂层技术(PLA 涂层及其他)、按最终用途行业(餐饮服务、零售、商业和机构)以及按地域(北美、欧洲、亚太、中东和非洲以及南美和中美洲)划分。
- 状态 : 已发布
- 报告代码 : TIPRE00022454
- 类别 : 消费品
- 页数 : 355
- 可用报告格式 :


- 最后更新日期 : May 25, 2026

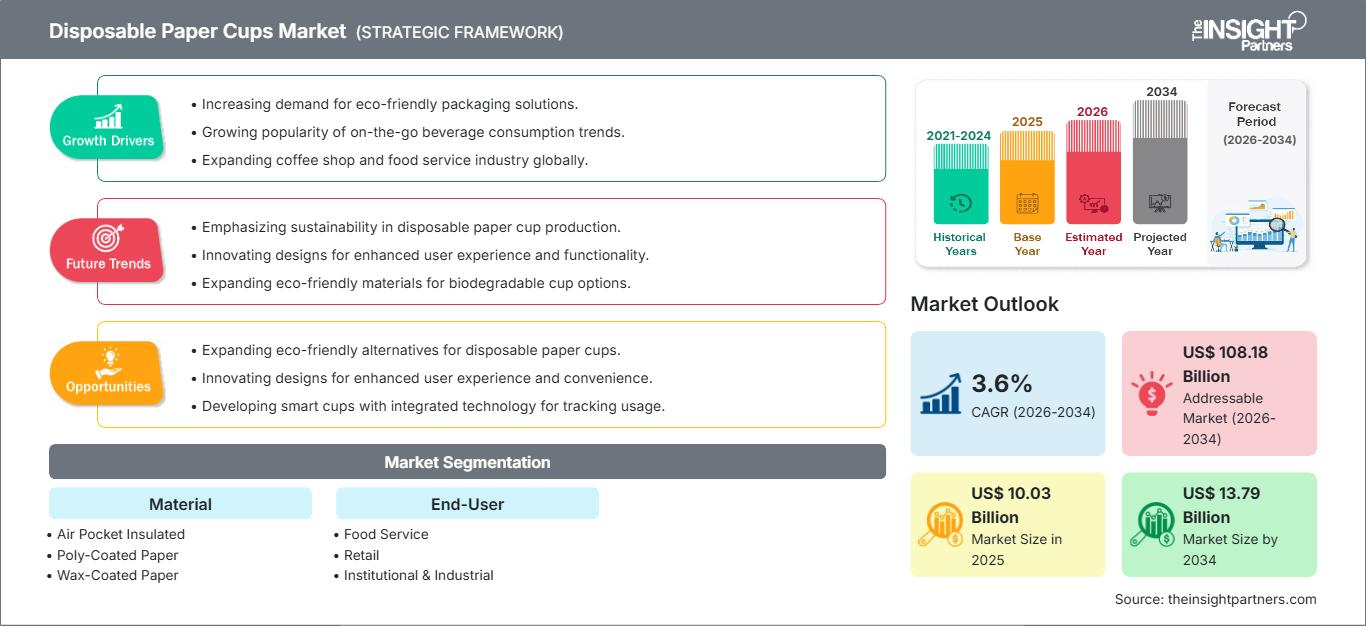
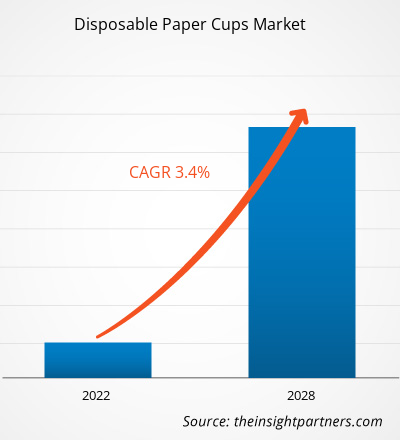
预计到2034年,一次性纸杯市场规模将从2025年的131.2亿美元增长至226.8亿美元。预计2026年至2034年,该市场将以6.3%的复合年增长率增长。
一次性纸杯市场分析
一次性纸杯市场的增长主要受消费者对便捷卫生饮品解决方案日益增长的需求驱动。全球咖啡馆和快餐店的快速扩张进一步推动了这一趋势,同时消费者对外卖和即饮饮品的需求也在不断增长。此外,生活方式的改变和城市化进程也在加速市场需求。可持续发展趋势也在影响着市场,消费者和企业都在转向环保的塑料替代品。
纸杯通常被认为更安全、更环保。外卖文化和食品配送服务的兴起,推动了全球对一次性纸杯的需求增长。消费者对便捷性和便携性的追求,进一步促进了一次性饮料包装的普及。为此,制造商不断推出改进型设计,例如双层隔热、防漏盖和可回收涂层,以提升纸杯的功能性和用户体验。此外,发展中国家有组织的餐饮服务业的蓬勃发展,以及国际咖啡连锁店的扩张,也为整体市场增长提供了支撑。
一次性纸杯市场概览
一次性纸杯是由纸板制成,内衬一层薄膜以防止渗漏的单次使用饮料容器。它们常用于咖啡馆、办公室、活动场所和餐饮服务点盛装咖啡、茶、软饮料和果汁。这些纸杯轻便、价格实惠,设计便捷卫生,非常适合快节奏的环境。
在全球范围内,由于外卖饮品的日益普及和餐饮服务的不断拓展,一次性纸杯的需求量正在上升。随着可持续发展理念的日益重要,可生物降解内衬、水性涂层和可回收材料等创新技术也越来越受欢迎。新的趋势包括在杯子上定制品牌标识、改进隔热设计以及推出可堆肥产品。此外,人们卫生意识的提高,尤其是在公共和商业场所,以及全球零售和酒店行业的持续扩张,也推动了市场增长。
根据您的需求定制此报告
获取免费定制服务一次性纸杯市场:战略洞察
-
获取本报告的主要市场趋势。这份免费样品将包含数据分析,内容涵盖市场趋势、估算和预测等。
一次性纸杯市场:驱动因素和机遇
市场驱动因素:
推动一次性纸杯市场增长的主要因素是对便捷、清洁的饮料包装日益增长的需求。由于生活节奏加快和城市化进程加快,北美、欧洲和亚太地区的消费者越来越倾向于随时随地饮用饮料。一次性纸杯使用方便、便于携带,且污染风险较低,因此在餐饮服务行业广受欢迎。
咖啡馆、快餐店和外卖服务的兴起显著增加了一次性杯子的使用量。人们卫生和安全意识的提高也推动了对一次性产品的需求。限制塑料使用的环保法规也促使人们转向纸质替代品。因此,制造商正在投资研发可持续材料和创新设计,以满足不断变化的消费者需求和监管标准。
市场机遇:
市场蕴藏着巨大的创新机遇,尤其是在开发可持续和环保解决方案方面。传统的聚乙烯涂层杯占据了较大的市场份额。然而,日益增长的环境问题促使人们对可生物降解、可堆肥和可回收的产品产生了需求。制造商可以通过开发植物基内衬、水性涂层以及增强可回收性的杯子来把握这一趋势。此外,定制化和品牌化也为产品差异化和市场成功提供了宝贵的机会。
企业经常使用印花杯进行市场营销和与客户建立联系。高端咖啡馆和特色饮品店的兴起,增加了对高质量、美观包装的需求。此外,电子商务和外卖服务的蓬勃发展也推动了对耐用防漏杯的需求。随着持续创新、全球分销渠道的拓展以及对可持续发展的日益重视,无论在发达经济体还是新兴经济体,该市场都拥有强劲的增长潜力。
一次性纸杯市场报告细分分析
一次性纸杯市场被划分为不同的细分市场,以便更清晰地了解其运作方式、增长潜力以及最新趋势。以下是行业报告中常用的标准细分方法:
按类型
- 单层保温杯:单层保温杯通常用于盛装咖啡、茶等热饮。这种杯子价格实惠、轻便易携,非常适合繁忙的咖啡馆和快餐店使用。
- 双层保温杯:双层保温杯通过增加一层隔热层,提供更佳的保温效果,更适合盛装热饮。它们能更有效地保持热量,无需杯套,提升用户舒适度,同时外观也更显档次。
- 冷饮杯:冷饮杯专为盛装冷饮而设计,例如软饮料、冰咖啡和果汁。这些杯子通常带有涂层,以防止冷凝并保持其在使用过程中的形状。
- 特殊杯:特殊杯包括定制和特定类型的杯子,例如品牌杯、保温杯和环保杯。它们满足小众需求,瞄准市场上的高端客户群体。
按材料
- 原生纸板:原生纸板杯采用新鲜木浆制成,具有强度高、卫生性好、印刷质量高等优点。
- 再生纸板:再生纸板杯由回收的纸材料制成,使其更具可持续性和成本效益。
通过涂层技术
- PLA涂层:PLA涂层杯使用聚乳酸作为内衬材料,该材料来源于可再生资源。
- 其他:此类纸杯包括聚乙烯涂层纸杯、水性涂层纸杯和无涂层纸杯。这些纸杯因其耐用性、防潮性和成熟的生产工艺而广受欢迎。
按最终用途行业划分
- 餐饮服务:餐饮服务部门包括咖啡馆、餐厅和快餐店,这些场所使用一次性杯子来盛装饮料。
- 零售:零售部门包括超市和商店,消费者在这些商店购买一次性杯子供个人使用。
- 商业用途:商业用途包括办公室和工作场所,在这些场所,一次性杯子用于日常饮料消费。
- 机构用途:机构用途包括学校、医院和公共设施,这些场所出于卫生和便利需要大量一次性杯子。
按地理位置:
- 北美
- 欧洲
- 亚太地区
- 南美洲和中美洲
- 中东和非洲
一次性纸杯市场报告范围
| 报告属性 | 细节 |
|---|---|
| 2025年市场规模 | 131.2亿美元 |
| 到2034年市场规模 | 226.8亿美元 |
| 全球复合年增长率(2026-2034 年) | 6.3% |
| 史料 | 2021-2024 |
| 预测期 | 2026-2034 |
| 涵盖部分 |
按类型
|
| 覆盖地区和国家 |
北美
|
| 市场领导者和主要公司简介 |
|
一次性纸杯市场参与者密度:了解其对业务动态的影响
一次性纸杯市场正快速增长,这主要得益于终端用户需求的不断增长,而终端用户需求的增长又源于消费者偏好的转变、技术的进步以及消费者对产品优势认知的提高。随着需求的增长,企业不断拓展产品线、创新以满足消费者需求,并把握新兴趋势,这些都进一步推动了市场增长。
一次性纸杯市场份额地域分析
亚太地区在一次性纸杯市场占据主导地位,这主要得益于低酒精饮料需求的增长。南美和中美洲、中东和非洲等新兴市场为主要企业提供了尚未开发的扩张机遇。
一次性纸杯市场的增长情况因地区而异。以下是各地区市场份额和趋势的概述:
1. 北美洲
- 市场份额:占据相当大的市场份额
-
关键驱动因素:
- 外卖饮料消费量高,且成熟的连锁咖啡店占据主导地位。
- 趋势:转向使用可回收和可堆肥的杯子。
2. 欧洲
- 市场份额:占据相当大的市场份额
-
关键驱动因素:
- 对一次性塑料制品的严格规定以及人们对环境问题的强烈关注,正在增加对纸质替代品的需求。
- 趋势:向可生物降解涂料和循环经济实践的转变正在影响市场发展。
3. 亚太地区
- 市场份额:占据市场主导地位,市场份额逐年增长。
-
关键驱动因素:
- 快速的城市化进程、不断增长的可支配收入以及餐饮服务场所的增长。
- 趋势:对价格实惠、大容量包装解决方案的需求不断增长。
4. 南美洲和中美洲
- 市场份额:市场快速扩张,市场份额持续增长。
-
关键驱动因素:
- 零售和餐饮服务业蓬勃发展。
- 趋势:转向可持续包装解决方案。
5. 中东和非洲
- 市场份额:市场规模较小,但扩张速度很快
-
关键驱动因素:
- 酒店业、旅游业和快餐业蓬勃发展。
- 趋势:餐饮服务基础设施投资不断增加。
市场密度高,竞争激烈
由于 Medac Srl、Papierverarbeitung Peters GmbH & Co KG 和 Seda International Packaging Group 等老牌企业的参与,竞争非常激烈。
激烈的竞争促使企业通过提供以下服务来脱颖而出:
- 产品种类丰富
- 可持续和符合道德规范的采购
- 竞争性定价模式
- 强大的客户支持和便捷的集成
机遇与战略举措
- 专注于研发活动以实现市场差异化
- 通过收购包装公司来扩大全球业务版图和能力
- 通过推出创新产品来扩展产品组合
研究过程中分析的其他公司:
- Vegware有限公司
- Duni AB
- 图形包装控股公司
- Go-Pak 英国有限公司
- CEE Schisler 包装解决方案
- F Bender有限公司
- Huhtamaki Oyj
- 日本制纸工业株式会社
- ProAmpac
- 科勒集团
一次性纸杯市场:新闻及最新动态
- Vanguard Vertex – 扩张:2025年7月,Vanguard Vertex收购了TPPC 100%的股份,旨在拓展其可持续食品包装产品组合并提升营业额。TPPC旗下运营着The Printed Cup Company和The Paper Cup Company,在兰开夏郡克利瑟罗设有生产工厂。其产品系列包括纸质饮料杯、食品罐、可回收塑料杯及相关配件,服务于英国和欧洲大陆的客户。
- Atar Capital – 并购:2025年7月,Atar Capital旗下子公司WinCup收购了Conver Pack Inc.,进一步巩固了其在可持续餐饮包装领域的地位。此次收购将Conver Pack获得SFI认证的纸杯纳入WinCup的产品组合,该组合此前已包含Phade品牌的海洋可生物降解和家庭可堆肥产品。
一次性纸杯市场报告涵盖范围及成果
《一次性纸杯市场规模及预测(2021-2034)》报告对市场进行了详细分析,涵盖以下领域:
- 一次性纸杯市场规模及预测,涵盖区域和国家层面的所有细分市场。
- 一次性纸杯市场趋势,以及驱动因素、制约因素和关键机遇等动态因素。
- 详细的波特五力模型和SWOT分析
- 一次性纸杯市场分析,涵盖关键趋势、全球和区域格局、主要参与者、法规和最新发展
- 一次性纸杯市场的行业格局和竞争分析,包括市场集中度、热力图分析、主要参与者和最新发展动态
- 公司详细概况

- 全面的市场规模与预测分析
- 详细的细分市场分析
- 深入的市场动态评估
- 区域及国家级洞察
- 竞争格局与企业对标分析
- 战略性商业情报
客户评价
Insight Partners 的 SCADA 系统市场报告内容全面,对当前趋势和未来预测提供了宝贵的见解。该团队始终高度专业、响应迅速且乐于助人。我们非常满意,强烈推荐他们的服务。
兰·凯德姆 伙伴, Reali Technologies LTD我请求一份关于特定软件市场的报告,团队在几天内就完成了。报告信息非常相关,而且呈现得非常出色。之后,我请求对报告进行一些修改和补充。团队再次迅速响应,不到一周我就收到了最终报告。
让-埃尔韦·詹恩 主席, 未来分析公司我们与 Insight Partners 合作进行了一项重要的市场研究和预测。他们清晰地洞察了机遇和风险,帮助我们制定了计划。他们的研究简单易用,数据可靠,帮助我们做出了明智而自信的决策。我们强烈推荐他们。
皮尤什·纳格帕尔 高级副总裁, 远光全球Insight Partners 凭借其深厚的行业专业知识,提供了富有洞察力、结构合理的市场研究。他们的团队始终专业且响应迅速。用户友好的网站让访问行业报告变得顺畅无阻。我们强烈推荐他们可靠、高质量的研究服务。
安达幸彦 首席执行官, 深蓝有限责任公司这是我第一次从The Insight Partners购买市场报告。起初我有些犹豫,但访问了他们的网站后,我更放心地冒险购买市场报告。我对报告的质量和客户服务非常满意。我对最初的报告有一些疑问和意见,但在与他们的分析师通过电子邮件沟通了几次后,我相信这份报告可以作为我们战略规划流程的参考。非常感谢您抽出宝贵的时间,让这次体验如此愉快。我一定会向其他人推荐你们的服务,当我们需要更多市场数据时,你们将是我的首选。
约翰·铃木 总裁兼首席执行官、董事会董事, BK科技感谢您在处理我关于尼日利亚传染病体外诊断市场信息请求的过程中所展现的支持和专业精神。感谢您的耐心、指导,以及您愿意提供的折扣,最终促成了这笔交易。我期待未来与 Insight Partners 继续合作,这一切都要归功于您与我初次接触后留下的良好印象。
奇吉奥克博士 ONYIA 董事总经理, PineCrest 医疗保健有限公司购买理由
- 明智的决策
- 了解市场动态
- 竞争分析
- 客户洞察
- 市场预测
- 风险规避
- 战略规划
- 投资论证
- 识别新兴市场
- 优化营销策略
- 提升运营效率
- 顺应监管趋势


