
环保吸管市场分析及预测(按规模、份额、增长和趋势)2031
环保吸管市场规模和预测(2021-2031 年)、全球和区域份额、趋势和增长机会分析报告范围:按产品类型(直吸管、柔性吸管等)、材料[纸、聚羟基脂肪酸酯 (PHA)、聚乳酸 (PLA)、竹子、甘蔗渣、硅胶等]、最终用户[食品服务(快餐店、咖啡馆和酒吧、酒店和高级餐厅、餐饮服务等)和零售(超市和大卖场、便利店、在线零售等)]和地理
- 状态 : 已发布
- 报告代码 : TIPRE00010209
- 类别 : 消费品
- 页数 : 336
- 可用报告格式 :


- 最后更新日期 : July 10, 2025

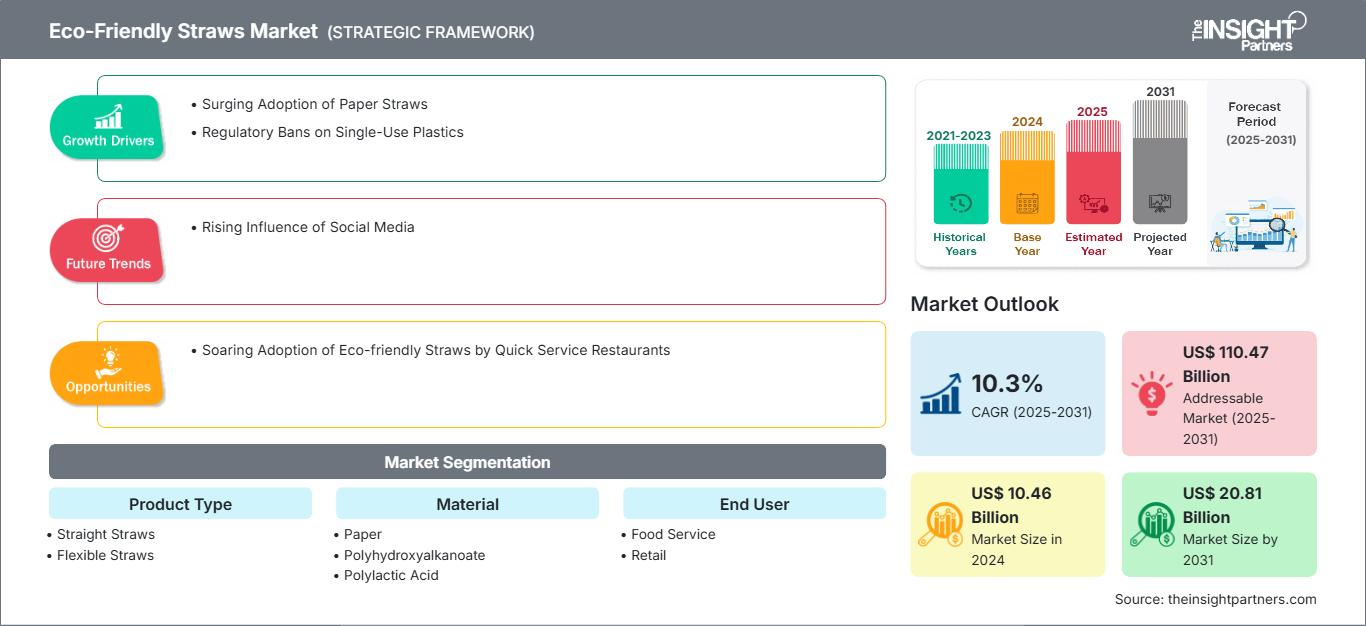
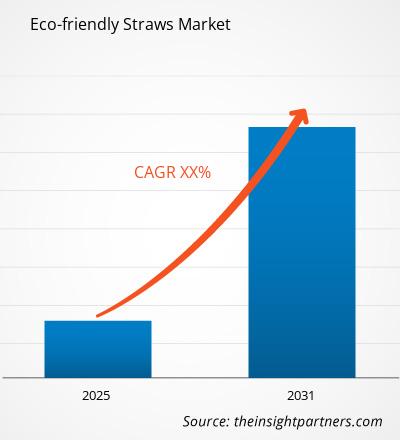
预计到 2031 年,环保吸管市场规模将从 2024 年的 104.6 亿美元增至 208.1 亿美元。预计该市场在 2025 年至 2031 年期间的复合年增长率为 10.3%。社交媒体日益增长的影响力预计将在预测期内为环保吸管市场带来新的趋势。
环保吸管市场分析
随着人们对塑料垃圾意识的提高,环保吸管越来越受欢迎。材料和制造技术的创新提高了其耐用性、可用性和美观性。各公司正在投资可生物降解涂层、防水纸层和植物基聚合物。这些创新在不损害环境目标的前提下提高了这些吸管的性能。消费者越来越多地将环保行为与品牌忠诚度联系起来。该协会推动企业将环保吸管的使用作为更广泛的企业社会责任 (CSR) 战略的一部分。
环保吸管市场概览
全球环保吸管市场的增长得益于日益增长的环境问题以及人们逐渐放弃使用一次性塑料制品。人们对塑料污染(尤其是海洋和水道中的塑料污染)的认识正在不断提高。这加速了消费者对餐饮和个人用品中可持续替代品的需求。各地区的政府和监管机构正在实施对塑料吸管的禁令和限制。这些限制推动了可生物降解和可堆肥材料的采用,例如纸质、竹子、金属、玻璃和聚乳酸 (PLA) 吸管。为了应对监管压力和消费者偏好,餐厅、咖啡馆和大型连锁酒店正在将环保吸管纳入其可持续发展计划。
自定义此报告以满足您的要求
您将免费获得任何报告的定制,包括本报告的部分内容,或国家级分析、Excel 数据包,以及为初创企业和大学提供超值优惠和折扣
环保吸管市场: 战略洞察
-
获取本报告的主要市场趋势。这个免费样本将包括数据分析,从市场趋势到估计和预测。
环保吸管市场驱动因素和机遇
一次性塑料的监管禁令
据 Ukhi India Pvt. Ltd. 称,全球每年产生约 4 亿吨塑料垃圾。一次性塑料占这些垃圾的很大一部分。据估计,每年有 800 万吨塑料垃圾(包括塑料吸管)进入海洋。随着人们对塑料污染认识的提高,各国政府已出台法规,以限制一次性塑料的使用。2022 年 1 月,法国实施了一次性塑料禁令。它的目标是到 2040 年消除所有形式的一次性塑料的使用。2021 年 7 月,德国采取分阶段的方式,禁止使用一次性塑料并征收一次性塑料税。该税于2022年1月生效。
2022年12月,加拿大发布了一项联邦禁令,禁止使用包括塑料吸管在内的六种一次性塑料制品。该禁令旨在到2030年实现零塑料垃圾。2021年,中国宣布到2025年底将食品服务行业的一次性塑料使用量减少30%。2022年7月,印度发布了一项全国性禁令,禁止使用包括塑料吸管在内的一次性塑料制品。世界各国对一次性塑料的监管禁令鼓励使用环保吸管。
环保吸管由生物塑料、竹子、甘蔗渣和其他可持续材料制成。这些吸管分解成有机物,不会留下有害的微塑料。它们通常在陆地环境(如土壤或堆肥)中2至6周内分解。甘蔗渣吸管完全可生物降解和堆肥。它们通常在自然条件下3至6个月内分解。此外,竹吸管在自然环境条件下一年内即可生物降解。这一特性使其成为传统一次性塑料吸管的高度可持续替代品。
快餐店环保吸管采用率飙升
环保吸管影响着食品服务行业消费者的购买行为。消费者选择使用可持续包装(例如吸管)可以成为品牌认知的关键差异化因素。快餐店产生的塑料垃圾对环境构成了严峻挑战,严重加剧了海洋污染和垃圾填埋场。一次性吸管、杯子和其他包装产品的堆积对全球海洋生态系统造成了不利影响。
作为其可持续发展举措的一部分,快餐店正在采用可重复使用和可清洗的包装替代品。 2021年,汉堡王宣布推出八种可持续包装产品,除勺子、刀具、饮料盖等外,还包括吸管。星巴克于2020年停止使用所有一次性塑料吸管,并提供可与非塑料吸管配合使用或不与非塑料吸管配合使用的杯盖。2018年,加拿大A&W食品服务公司在其餐厅停止使用塑料吸管,用可生物降解的纸质吸管取而代之。2020年,塔可钟宣布在受塑料禁令约束的门店,将塑料吸管改用纸质吸管。
快餐店可以简化废物管理流程、削减采购成本,并从长远来看提高运营效率和财务稳定性。他们可以通过减少对一次性塑料的依赖来实现这些好处。实施并支持可持续发展计划的快餐连锁店能够留住并吸引具有环保意识的消费者。因此,快餐店越来越多地采用环保吸管,预计将在未来为市场带来丰厚的利润。
环保吸管市场报告细分分析
促成环保吸管市场分析的关键细分是产品类型、材料和最终用户。
- 按产品类型,环保吸管市场分为直吸管、柔性吸管和其他吸管。2024 年,直吸管占据了环保吸管市场的最大份额。
- 按材料,环保吸管市场分为纸、聚羟基脂肪酸酯 (PHA)、聚乳酸 (PLA)、竹子、甘蔗渣、硅胶和其他。2024 年,纸质吸管占据了环保吸管市场的最大份额。
- 根据最终用户,市场分为餐饮服务和零售。餐饮服务细分市场可细分为快餐店、咖啡馆和酒吧、酒店和高级餐厅、餐饮服务等。零售细分市场包括超市和大卖场、便利店、在线零售等。2024 年,餐饮服务占据了环保吸管市场的最大份额。
按地区划分的环保吸管市场份额分析
环保吸管市场报告的地理范围分为五个区域:北美、亚太地区、欧洲、中东和非洲以及南美和中美洲。预计亚太地区的环保吸管市场在预测期内将大幅增长。
亚太地区环保吸管市场细分为澳大利亚、中国、印度、日本、韩国和亚太其他地区。包括新机场和区域高速公路在内的基础设施的快速发展,为食品连锁店的开设提供了便利。这家企业正在创造对环保吸管的需求。由于这些平台提供的便利,在线订餐业务日益增长,这推动了对纸质吸管、竹吸管、硅胶吸管和聚乳酸吸管的需求。由于日益严峻的环境挑战、政府法规的出台、消费者观念的转变以及企业社会责任的履行,亚太地区开始使用环保吸管。可重复使用和可生物降解的吸管已成为年轻人和注重健康的消费者的生活方式选择。麦当劳、星巴克咖啡公司和肯德基已在整个地区统一了其可持续发展目标,并在当地门店替换了塑料吸管。澳大利亚、中国、印度和日本是饮料(包括热饮、冷饮和冷冻饮)普及率最高的国家。西方文化对该地区民众的影响日益增强,正在影响该地区对饮料的需求。随着全球化的持续发展,烹饪交流,尤其是来自北美和欧洲的烹饪交流,在亚太地区的消费者中越来越受欢迎。
各大企业正在通过将产品推广到亚太地区的餐厅和快餐店来扩大其影响力。 2021年,比利时华夫饼公司 (The Belgian Waffle Co.) 扩大了业务范围,开设了新的门店,并通过电商平台和实体店进军快速消费品领域。该品牌的目标是进军快餐店、电商平台、现代渠道和一线精品店等多个领域。各年龄段人群对奶昔、珍珠奶茶和其他饮料的需求激增,推动了该地区市场的增长。
环保吸管市场
环保吸管市场The Insight Partners 的分析师已详尽阐述了预测期内影响环保吸管市场的区域趋势和因素。本节还探讨了北美、欧洲、亚太地区、中东和非洲以及南美和中美洲的环保吸管市场细分和地域分布。
环保吸管市场报告范围
| 报告属性 | 细节 |
|---|---|
| 市场规模 2024 | US$ 10.46 Billion |
| 市场规模 2031 | US$ 20.81 Billion |
| 全球复合年增长率 (2025 - 2031) | 10.3% |
| 历史数据 | 2021-2023 |
| 预测期 | 2025-2031 |
| 涵盖的领域 |
By 产品类型
|
| 覆盖地区和国家 |
北美
|
| 市场领导者和主要公司简介 |
|
环保吸管市场参与者密度:了解其对商业动态的影响
环保吸管市场正在快速增长,这得益于终端用户需求的不断增长,而这些需求的驱动因素包括消费者偏好的演变、技术进步以及对产品优势的认知度不断提高。随着需求的增长,企业正在扩大产品线,不断创新以满足消费者需求,并抓住新兴趋势,从而进一步推动市场增长。
- 获取 环保吸管市场 主要参与者概述
环保吸管市场新闻及最新发展
环保吸管市场的评估是通过收集一手和二手研究后的定性和定量数据进行的。这些数据包括公司出版物、协会数据和数据库。环保吸管市场的主要发展如下:
- 澳大利亚 B-Corp 和全球可堆肥包装企业 BioPak 已扩展到香港市场。此次扩张旨在帮助整个地区的行业转向可持续替代品。(来源:Biopak,新闻稿,2024 年 4 月)
- Transcend Packaging 宣布在欧洲推出一款新型热杯,该杯由 Transcend 位于威尔士 Ystrad Mynach 的工厂设计和制造。这款创新型杯子用矿物涂层取代了塑料内衬。这是该技术在咖啡杯上的首次大规模应用。 (来源:Transcend Packaging,新闻稿,2025 年 5 月)
环保吸管市场报告覆盖范围和可交付成果
《环保吸管市场规模和预测(2021-2031)》报告对市场进行了详细的分析,涵盖以下领域:
- 涵盖范围内所有主要细分市场的全球、区域和国家/地区环保吸管市场规模和预测
- 环保吸管市场趋势以及市场动态,例如驱动因素、限制因素和关键机遇
- 详细的波特五力模型和 SWOT 分析
- 环保吸管市场分析,涵盖主要市场趋势、全球和区域框架、主要参与者、法规和最新市场发展
- 行业格局和竞争分析,涵盖市场集中度、热图分析、知名参与者和环保吸管的最新发展市场
- 详细的公司简介

- 全面的市场规模与预测分析
- 详细的细分市场分析
- 深入的市场动态评估
- 区域及国家级洞察
- 竞争格局与企业对标分析
- 战略性商业情报
客户评价
Insight Partners 的 SCADA 系统市场报告内容全面,对当前趋势和未来预测提供了宝贵的见解。该团队始终高度专业、响应迅速且乐于助人。我们非常满意,强烈推荐他们的服务。
兰·凯德姆 伙伴, Reali Technologies LTD我请求一份关于特定软件市场的报告,团队在几天内就完成了。报告信息非常相关,而且呈现得非常出色。之后,我请求对报告进行一些修改和补充。团队再次迅速响应,不到一周我就收到了最终报告。
让-埃尔韦·詹恩 主席, 未来分析公司我们与 Insight Partners 合作进行了一项重要的市场研究和预测。他们清晰地洞察了机遇和风险,帮助我们制定了计划。他们的研究简单易用,数据可靠,帮助我们做出了明智而自信的决策。我们强烈推荐他们。
皮尤什·纳格帕尔 高级副总裁, 远光全球Insight Partners 凭借其深厚的行业专业知识,提供了富有洞察力、结构合理的市场研究。他们的团队始终专业且响应迅速。用户友好的网站让访问行业报告变得顺畅无阻。我们强烈推荐他们可靠、高质量的研究服务。
安达幸彦 首席执行官, 深蓝有限责任公司这是我第一次从The Insight Partners购买市场报告。起初我有些犹豫,但访问了他们的网站后,我更放心地冒险购买市场报告。我对报告的质量和客户服务非常满意。我对最初的报告有一些疑问和意见,但在与他们的分析师通过电子邮件沟通了几次后,我相信这份报告可以作为我们战略规划流程的参考。非常感谢您抽出宝贵的时间,让这次体验如此愉快。我一定会向其他人推荐你们的服务,当我们需要更多市场数据时,你们将是我的首选。
约翰·铃木 总裁兼首席执行官、董事会董事, BK科技感谢您在处理我关于尼日利亚传染病体外诊断市场信息请求的过程中所展现的支持和专业精神。感谢您的耐心、指导,以及您愿意提供的折扣,最终促成了这笔交易。我期待未来与 Insight Partners 继续合作,这一切都要归功于您与我初次接触后留下的良好印象。
奇吉奥克博士 ONYIA 董事总经理, PineCrest 医疗保健有限公司购买理由
- 明智的决策
- 了解市场动态
- 竞争分析
- 客户洞察
- 市场预测
- 风险规避
- 战略规划
- 投资论证
- 识别新兴市场
- 优化营销策略
- 提升运营效率
- 顺应监管趋势


