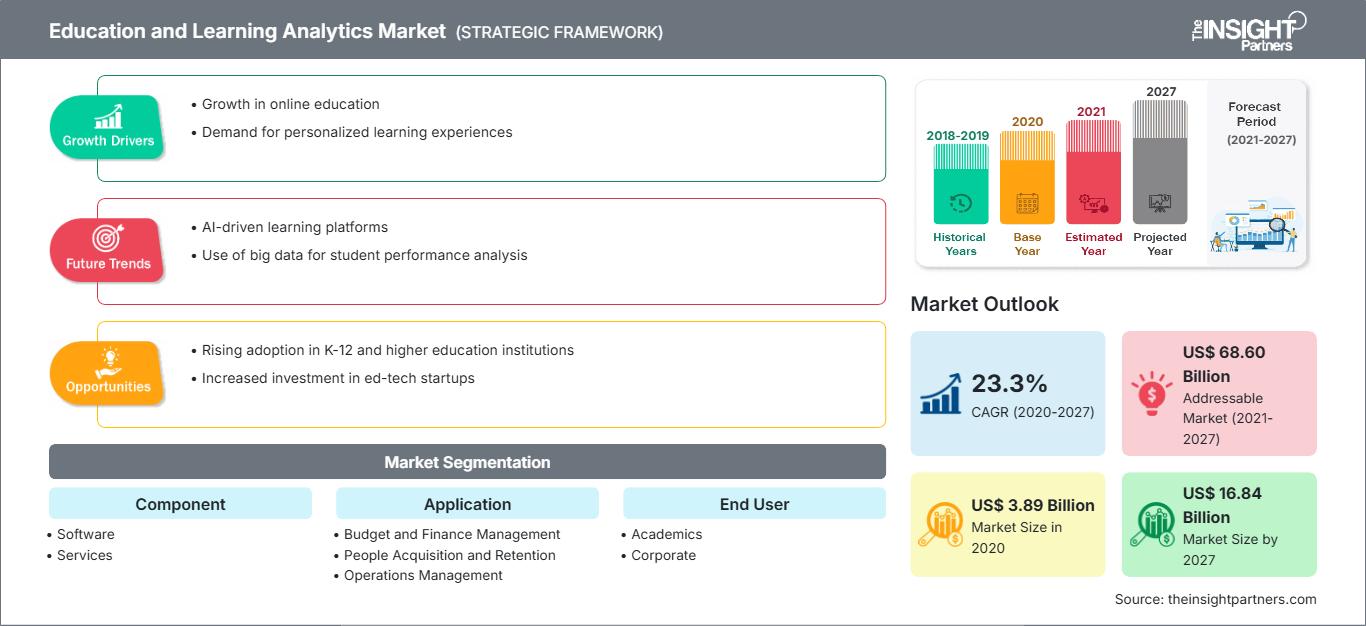
教育和学习分析市场基于(关键地区、市场参与者、规模和份额)- 到 2031 年的预测

  • Report Code : TIPTE00002452
  • Category : Technology, Media and Telecommunications
  • Status : Published
  • No. of Pages : 186
Buy Now

[研究报告]教育和学习分析市场预计将从 2020 年的 38.903 亿美元增长到 2027 年的 168.359 亿美元;预计 2020 年至 2027 年复合年增长率为 23.3%。

市场的增长导致对在线课程和专业认证的需求不断增加。对在线课程的需求不断增长以及在线课程注册数量的急剧增加,为教育和学习分析市场的供应商创造了巨大的机会。由于全球市场上存在大量参与者,在线课程市场高度分散。学习分析供应商必须注重与在线课程提供商的合作,以扩大其全球足迹。

在线学习正在成为教育领域的重要组成部分。越来越多的学生正在寻找灵活的证书、课程和学位课程形式,以支持职业安置和继续深造,这日益推动了在线课程的招生。注册校内课程的学生在注册期间也专注于注册混合课程和完全在线课程。在线大师由于学习体验中的高质量技术援助,许多著名的大型机构正在转向各种在线学位课程,学位在学生中蓬勃发展。此外,企业专业人士也致力于学习各种课程以促进其职业发展。因此,在线课程需求的激增预计将为全球教育和学习分析供应商提供巨大的机会。

COVID-19 大流行对教育和学习的影响分析市场

尽管对于 COVID-19 可能造成的损害存在不同的观点,但事实仍然是,COVID-19 正在全球范围内传播。美国、加拿大、欧洲、非洲、中东、印度、澳大利亚、韩国、印度和日本等几个国家的新病例正在增加。尽管对各种企业的影响众所周知,但教育部门也面临着近期以来最大的破坏。

世界各地的教育机构正在应对旅行禁令和隔离转向在线学习。紧急情况可能会引发在线教育热潮——或者至少可以让各国更好地应对下一次紧急情况


教育和学习分析市场的利润丰厚的地区


市场洞察–教育和学习分析市场

发展中国家的教育机构越来越多地采用先进技术

教育机构正在大力投资先进技术技术以获得竞争优势并采用最好的教育体系。另一方面,学生也愿意投资以获得最好的教育。教育机构和学生都有很大的潜力投资于技术驱动的教育系统,这对市场增长产生了很大的影响。学校和大学正在投资技术来改善其教育运营,例如财务规划、课程规划、学生保留以及向学生提供信息的有效流程。   
  

教育部门尝试了从课堂课程到基于应用程序的学习等多种技术进步。有些技术已经成为高等教育系统的永久组成部分。快速发展的技术正在改变教育部门。

大数据分析等先进技术为教育工作者以新的方式接触学生提供了前所未有的机会。它可以更深入地了解学生的学习经历,也有助于评估教育系统的状况。大数据在教育领域发挥关键作用的一些关键领域包括定制课程、提高学生成绩、减少辍学等。同样,学习分析可以改进课程交付流程、绩效管理、运营管理、财务管理等。所有这些与技术相关的优势使得教育机构能够采用智能技术解决方案。教育领域越来越多地采用先进技术解决方案,预计将在预测期内推动全球教育和学习分析市场的发展。


基于组件的见解< /p>

根据组件,教育和学习分析市场分为软件和服务。软件细分市场在 2019 年占据最大市场份额。

战略洞察

教育和学习分析市场的参与者主要集中在开发先进、高效的产品。

  • 2019 年,SAS Institute Inc. 投资于分析背后的人员,帮助教育新一代改变现状并为经济转型培训劳动力。一些新的计划和举措—— SAS 致力于促进全民分析教育的全部承诺 –在 SAS® 期间推出2019 年全球论坛。
  • 2019 年,微软从旧金山公司 BrightBytes 收购了 DataSense,这是一款面向教育解决方案提供商和美国学区的集成平台即服务 (IPaaS) 产品。作为交易的一部分,开发团队将加入微软的全球教育部门。

教育和学习分析市场细分如下:< /p>


教育和学习分析市场 –按组件划分

  • 软件
  • 服务

教育和学习分析市场 -按应用划分

  • 绩效管理
  • 运营管理
  • 预算和财务管理
  • 人员招募和保留
  • < li>课程开发和干预管理

教育和学习分析市场 -按最终用户划分

  • 学术界
  • 企业

教育和学习分析市场 -按地理位置

  • 北美洲
    • 美国
    • 加拿大
    • 墨西哥
  • < li>欧洲
    • 法国
    • 德国
    • 意大利
    • 俄罗斯
    • 英国
    • 其他欧洲
  • 亚太地区 (APAC)
    • 日本
    • 中国
    • 澳大利亚
    • < li>印度
    • 韩国
    • 亚太地区其他地区
  • 中东和非洲 (MEA)
    • 沙特阿拉伯
    • 阿联酋
    • 南非
    • MEA其他地区
  • 南美洲(SAM)< ul>
  • 巴西
  • 阿根廷
  • SAM 的其他地区

教育和学习分析市场 -公司简介

  • Watershed Systems, Inc.
  • SAS Institute Inc.
  • SAP SE
  • Microsoft Corporation
  • Happiest Minds
  • Ellucian Company LP
  • Blackboard Inc.
  • Alteryx Inc.
  • InetSoft Technology Corp.
  • Saba Software, Inc.
Report Coverage
Report Coverage

Revenue forecast, Company Analysis, Industry landscape, Growth factors, and Trends

Segment Covered
Segment Covered

This text is related
to segments covered.

Regional Scope
Regional Scope

North America, Europe, Asia Pacific, Middle East & Africa, South & Central America

Country Scope
Country Scope

This text is related
to country scope.

Frequently Asked Questions


Which component led the education and learning analytics market?

Software segment by component in the education and learning analytics market led the market in 2019. Along with increasing digitalization, businesses of all sizes are focusing on adopting automated solutions to ease their business process. The advancements in applications of Information, Communication, and Technology (ICT) are paving the way for effective businesses. Education and learning analytics software helps to improve the quality of education is increasing with the growing volume of student’s data generated from different systems, such as Virtual Learning Environment (VLE), Learning Management System (LMS), student information system, or a variety of library systems. The software segment exceeds the services segment and is expected to witness the maturation in the future due to the higher adoption of education and learning analytics software solutions.

Which factor is driving the education and learning analytics market?

Increasing demand for quality assurance and quality improvement in education system is driving the demand for learning analytics. Many educational institutes are focusing on quality assurance and quality improvement in the education system to fulfill the demand from end-users. Teaching staffs are using various data to improve teaching practices. Most of the colleges and universities are using learning analytics tool as a diagnostic tool on an individual and systematic level. At the individual level, the learning analytics are used for identifying issues, and at a systematic level, it is used for the design of modules and degree programs.

Which region led education and learning analytics market?

The education and learning analytics market was dominated by North America due to developed economies such as the US, Canada, and Mexico. The US and Canada are among the most advanced countries in the region, in terms of technology adoption in almost every sector, including education and training. Moreover, the presence of major education and learning analytics players, along with the widespread awareness regarding these solutions, is anticipated to further propel the market growth during the forecast period.

The List of Companies - Global Education and Learning Analytics Market

  1. Watershed Systems, Inc.
  2. SAS Institute Inc.
  3. SAP SE
  4. Microsoft Corporation
  5. Happiest Minds
  6. Ellucian Company L.P.
  7. Blackboard Inc.
  8. Alteryx Inc.
  9. InetSoft Technology Corp.
  10. Saba Software, Inc.

The Insight Partners performs research in 4 major stages: Data Collection & Secondary Research, Primary Research, Data Analysis and Data Triangulation & Final Review.

  1. Data Collection and Secondary Research:

As a market research and consulting firm operating from a decade, we have published and advised several client across the globe. First step for any study will start with an assessment of currently available data and insights from existing reports. Further, historical and current market information is collected from Investor Presentations, Annual Reports, SEC Filings, etc., and other information related to company’s performance and market positioning are gathered from Paid Databases (Factiva, Hoovers, and Reuters) and various other publications available in public domain.

Several associations trade associates, technical forums, institutes, societies and organization are accessed to gain technical as well as market related insights through their publications such as research papers, blogs and press releases related to the studies are referred to get cues about the market. Further, white papers, journals, magazines, and other news articles published in last 3 years are scrutinized and analyzed to understand the current market trends.

  1. Primary Research:

The primarily interview analysis comprise of data obtained from industry participants interview and answers to survey questions gathered by in-house primary team.

For primary research, interviews are conducted with industry experts/CEOs/Marketing Managers/VPs/Subject Matter Experts from both demand and supply side to get a 360-degree view of the market. The primary team conducts several interviews based on the complexity of the markets to understand the various market trends and dynamics which makes research more credible and precise.

A typical research interview fulfils the following functions:

  • Provides first-hand information on the market size, market trends, growth trends, competitive landscape, and outlook
  • Validates and strengthens in-house secondary research findings
  • Develops the analysis team’s expertise and market understanding

Primary research involves email interactions and telephone interviews for each market, category, segment, and sub-segment across geographies. The participants who typically take part in such a process include, but are not limited to:

  • Industry participants: VPs, business development managers, market intelligence managers and national sales managers
  • Outside experts: Valuation experts, research analysts and key opinion leaders specializing in the electronics and semiconductor industry.

Below is the breakup of our primary respondents by company, designation, and region:

Research Methodology

Once we receive the confirmation from primary research sources or primary respondents, we finalize the base year market estimation and forecast the data as per the macroeconomic and microeconomic factors assessed during data collection.

  1. Data Analysis:

Once data is validated through both secondary as well as primary respondents, we finalize the market estimations by hypothesis formulation and factor analysis at regional and country level.

  • Macro-Economic Factor Analysis:

We analyse macroeconomic indicators such the gross domestic product (GDP), increase in the demand for goods and services across industries, technological advancement, regional economic growth, governmental policies, the influence of COVID-19, PEST analysis, and other aspects. This analysis aids in setting benchmarks for various nations/regions and approximating market splits. Additionally, the general trend of the aforementioned components aid in determining the market's development possibilities.

  • Country Level Data:

Various factors that are especially aligned to the country are taken into account to determine the market size for a certain area and country, including the presence of vendors, such as headquarters and offices, the country's GDP, demand patterns, and industry growth. To comprehend the market dynamics for the nation, a number of growth variables, inhibitors, application areas, and current market trends are researched. The aforementioned elements aid in determining the country's overall market's growth potential.

  • Company Profile:

The “Table of Contents” is formulated by listing and analyzing more than 25 - 30 companies operating in the market ecosystem across geographies. However, we profile only 10 companies as a standard practice in our syndicate reports. These 10 companies comprise leading, emerging, and regional players. Nonetheless, our analysis is not restricted to the 10 listed companies, we also analyze other companies present in the market to develop a holistic view and understand the prevailing trends. The “Company Profiles” section in the report covers key facts, business description, products & services, financial information, SWOT analysis, and key developments. The financial information presented is extracted from the annual reports and official documents of the publicly listed companies. Upon collecting the information for the sections of respective companies, we verify them via various primary sources and then compile the data in respective company profiles. The company level information helps us in deriving the base number as well as in forecasting the market size.

  • Developing Base Number:

Aggregation of sales statistics (2020-2022) and macro-economic factor, and other secondary and primary research insights are utilized to arrive at base number and related market shares for 2022. The data gaps are identified in this step and relevant market data is analyzed, collected from paid primary interviews or databases. On finalizing the base year market size, forecasts are developed on the basis of macro-economic, industry and market growth factors and company level analysis.

  1. Data Triangulation and Final Review:

The market findings and base year market size calculations are validated from supply as well as demand side. Demand side validations are based on macro-economic factor analysis and benchmarks for respective regions and countries. In case of supply side validations, revenues of major companies are estimated (in case not available) based on industry benchmark, approximate number of employees, product portfolio, and primary interviews revenues are gathered. Further revenue from target product/service segment is assessed to avoid overshooting of market statistics. In case of heavy deviations between supply and demand side values, all thes steps are repeated to achieve synchronization.

We follow an iterative model, wherein we share our research findings with Subject Matter Experts (SME’s) and Key Opinion Leaders (KOLs) until consensus view of the market is not formulated – this model negates any drastic deviation in the opinions of experts. Only validated and universally acceptable research findings are quoted in our reports.

We have important check points that we use to validate our research findings – which we call – data triangulation, where we validate the information, we generate from secondary sources with primary interviews and then we re-validate with our internal data bases and Subject matter experts. This comprehensive model enables us to deliver high quality, reliable data in shortest possible time.

Your data will never be shared with third parties, however, we may send you information from time to time about our products that may be of interest to you. By submitting your details, you agree to be contacted by us. You may contact us at any time to opt-out.

Related Reports