高速摄像机市场概况、增长、趋势、分析、研究报告(2018-2027 年)
历史数据 : 2016-2017 | 基准年 : 2018 | 预测期 : 2019-20272027 年高速摄像机市场 - 全球分析与预测,按组件(图像传感器、镜头、电池、图像处理器、风扇和冷却系统、存储系统等);按分辨率(2 MP、2 - 5 MP、5 MP 及以上)、按帧速率(1,000 - 5,000、5,000 - 20,000、20,000 - 100,000 和 100,000 及以上)和应用(汽车与运输、工业制造、食品与饮料、消费电子、媒体与娱乐、体育、医疗保健等)
- 状态 : 已发布
- 报告代码 : TIPTE00002539
- 类别 : 电子和半导体
- 页数 : 226
- 可用报告格式 :


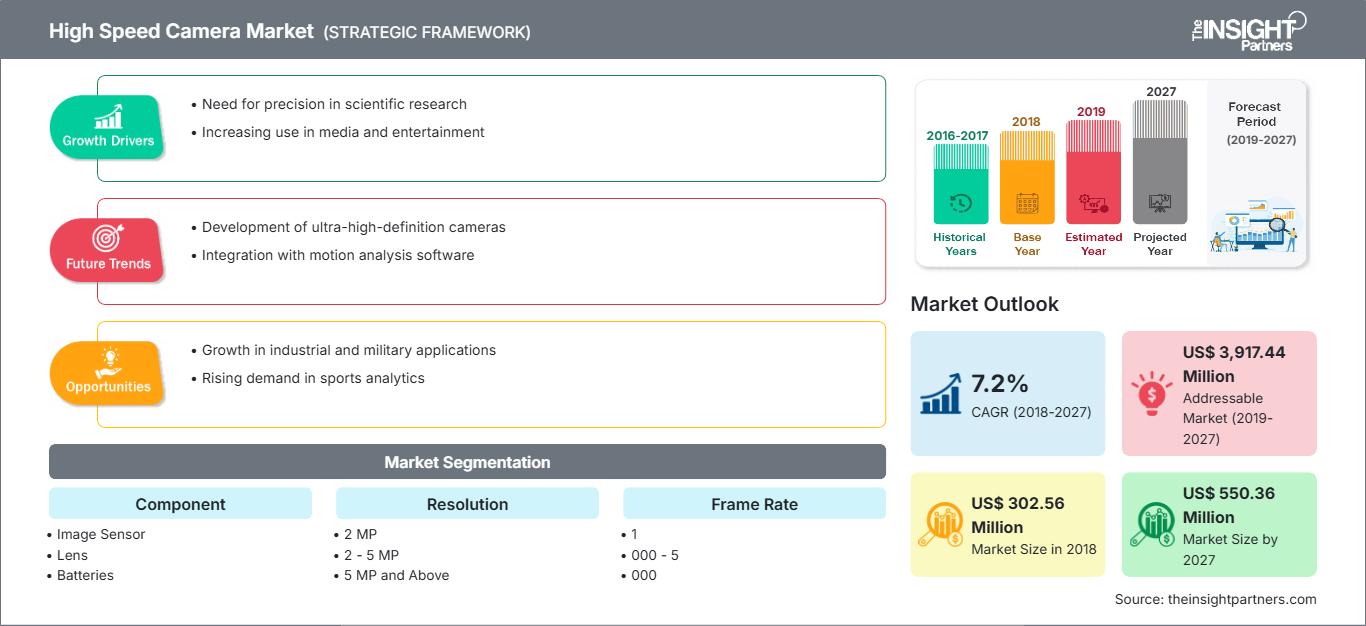
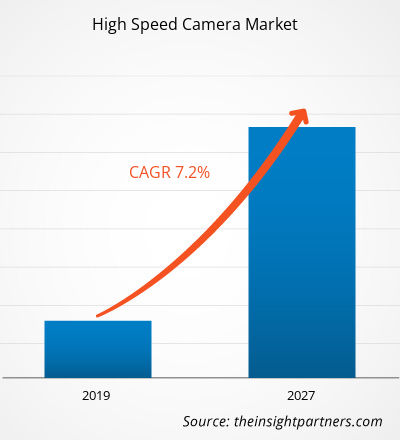
2018 年高速摄像机市场价值为 3.0256 亿美元,预计到 2027 年将达到 5.5036 亿美元;预计 2019 年至 2027 年期间的复合年增长率为 7.2%。
高速摄像机用于拍摄慢动作视频。摄像机拍摄数千张连拍图像并将它们编辑成流畅的视频。它们用于分析慢动作事件并捕捉肉眼看不见的效果。高速传感器技术的进步为高速摄像机的诞生提供了可能性。更高的分辨率意味着可以获得更清晰、噪点更少的图像,这可以提高用户看到事件中先前看不见的方面的能力。高速摄像机可以分析和捕捉人眼无法看到的快速事件。为了满足客户的需求,以及高速摄像机的多种关键应用,自 1989 年以来,高速数字成像技术得到了蓬勃发展。
为了拍摄慢动作视频,显然需要使用能够以高于标准制作帧率一千倍的速度采集图像的摄像机,以便在不降低画质的情况下进一步降低视频速度。高速摄像机通常分为两种类型:
- 超慢动作:摄像机的运行速度为标准帧率的两倍(100 至 120 fps)到十倍(500 至 600 fps)
- 超高速:摄像机的运行速度为 1000 fps 或更高,并以短促的突发事件形式录制到摄像机内部存储器中。
对高速摄像机的需求日益增长。各行各业都选择这些摄像机来更好地分析慢动作事件。随着需求的增长,摄像机的产量也将随之增长,这反过来又会降低高速摄像机组件的成本。制造高速摄像机需要定制组件,这与演播室摄像机的消费者完全不同。这些摄像机的高快门速度需要定制图像传感器、数据存储、连接解决方案、电池、热管理、更快的图像处理器以及下一代存储技术。所有这些定制组件都会产生额外的成本,这阻碍了市场的增长。然而,随着全球各行各业需求的增长,产量也将随之增长。如前所述,其原因在于规模经济效应的实现,这反过来又会降低高速摄像机的价格。因此,随着摄像机产量的增加,规模经济效应将发挥作用,从而降低摄像机的整体价格。随着价格的降低,对高速摄像机的需求将进一步增加。
自定义此报告以满足您的要求
您将免费获得任何报告的定制,包括本报告的部分内容,或国家级分析、Excel 数据包,以及为初创企业和大学提供超值优惠和折扣
高速摄像机市场: 战略洞察
-
获取本报告的主要市场趋势。这个免费样本将包括数据分析,从市场趋势到估计和预测。
近年来,高速摄像机具有多种分辨率。通常,分辨率在 1 到 5 百万像素 (MP) 之间。当高速摄像机的视野广阔时,或者由于需要研究的高速事件中有很多细节而期望最低空间分辨率时,需要更高的分辨率。普遍而言,摄像机的分辨率越高,最大帧速率越低。使用 5 MP 摄像机,摄像机需要处理的像素是 1 MP 摄像机的五倍。因此,使用高分辨率摄像机实现与低分辨率摄像机相同的帧速率是不可行的。随着图像传感器和图像处理器处理能力的进步,未来可以使用 5 MP 摄像机实现与 1 MP 摄像机相同的帧速率。因此,在 2019 年的预测期内——到 2027 年,技术的进步将提供更高的帧速率和更高的分辨率。
组件细分洞察
根据组件,高速摄像机市场细分为图像传感器、镜头、电池、图像处理器、风扇和冷却系统、存储系统等。由于图像传感器在企业中的应用广泛,预计它将在高速摄像机市场中占据主要市场份额。高速摄像机涉及许多关键组件,例如传感器、处理器、镜头、存储系统、风扇和冷却系统、存储系统等。每台高速摄像机都依赖于这些关键组件以获得更好的效果。不同类型的高速摄像机的组件形式也不同。高速摄像机的特点在于这些组件,它们允许根据应用进行不同级别的定制。高速摄像机组件在每个部署这些产品的行业中都发挥着至关重要的作用。
分辨率细分洞察
根据分辨率,高速摄像机市场分为 2 MP、2 - 5 MP、5 MP 及以上。高速摄像机的像素分辨率是购买前需要考虑的另一个重要参数。高速摄像机有多种分辨率可供选择。高分辨率摄像机适用于摄像机视场角较大或需要非常小的空间分辨率来捕捉高速事件中大量精细细节的应用。
帧率细分洞察
根据分辨率,高速摄像机市场分为 1,000 - 5,000、5,000 - 20,000、20,000 - 100,000 和 100,000 及以上。帧率是购买高速摄像机时要考虑的主要因素。大多数高速摄像机都能够在像素分辨率降低的情况下以越来越高的帧速率运行。然而,帧速率的提高并不完全与分辨率的降低成正比,并且通常会限制在降低分辨率的情况下可选择的水平和/或垂直像素的具体数量。高速摄像机的性能水平和成本范围非常广泛。
应用细分洞察
根据应用,高速摄像机市场分为汽车和运输、工业制造、食品和饮料、消费电子、媒体和娱乐、体育、医疗保健等。高速摄像机几乎在各行各业都有广泛的应用。这些系统为自动质量保证和高速操作提供了强大的方法。高速摄像机主要用于汽车行业和制造业。它们在制造业以及运输和物流服务中充当着有用的工具。
市场参与者专注于新产品的创新和开发,将先进的技术和功能融入产品中,从而与竞争对手展开竞争。
2019 年:NEC 公司与合作伙伴(包括石川濑尾实验室、东京大学和信息科学与技术研究生院)合作开发了高速摄像机物体识别系统。该摄像机使用人工智能 (AI) 即时查看以每秒 1,000 帧的速度运行的高速摄像机捕获的大量图像。2019 年:AOS Technologies 发布了 New Imaging Studio v4,其功能包括支持 M-VIT 摄像机、OSD 徽标支持、自动下载功能、用于电影导出的分辨率调整功能、全局擦除缓冲区模式等。
全球高速摄像机市场细分如下:
高速摄像机市场区域洞察
The Insight Partners 的分析师已详尽阐述了预测期内影响高速摄像机市场的区域趋势和因素。本节还讨论了北美、欧洲、亚太地区、中东和非洲以及南美和中美洲的高速摄像机市场细分和地域分布。
高速摄像机市场报告范围
| 报告属性 | 细节 |
|---|---|
| 市场规模 2018 | US$ 302.56 Million |
| 市场规模 2027 | US$ 550.36 Million |
| 全球复合年增长率 (2018 - 2027) | 7.2% |
| 历史数据 | 2016-2017 |
| 预测期 | 2019-2027 |
| 涵盖的领域 |
By 组件
|
| 覆盖地区和国家 |
北美
|
| 市场领导者和主要公司简介 |
|
高速摄像机市场参与者密度:了解其对业务动态的影响
高速摄像机市场正在快速增长,这得益于终端用户需求的不断增长,而这些需求的驱动因素包括消费者偏好的不断变化、技术进步以及对产品优势的认知度不断提高。随着需求的增长,企业正在扩展其产品线,不断创新以满足消费者需求,并抓住新兴趋势,从而进一步推动市场增长。
- 获取 高速摄像机市场 主要参与者概述
- 图像传感器
- 镜头
- 电池
- 图像处理器
- 风扇和冷却系统
- 存储系统
- 其他
全球高速摄像机市场 - 按分辨率划分
- 2 MP
- 2 - 5 MP
- 5 MP 及以上
全球高速摄像机市场 - 按帧速率划分
- 1,000 - 5,000
- 5,000 - 20,000
- 20,000 - 100,000
- 100,000 及以上
全球高速摄像机市场 - 按帧速率划分按应用
- 汽车和运输
- 工业制造
- 消费电子
- 媒体和娱乐
- 体育
- 医疗保健
- 其他
全球高速摄像机市场 –按地理位置
-
北美洲
- 美国
- 加拿大
- 墨西哥
-
欧洲
- 法国
- 德国
- 意大利
- 英国
- 俄罗斯
- 其他地区欧洲
-
亚太地区(APAC)
- 中国
- 韩国
- 印度
- 日本
- 澳大利亚
- 亚太地区其他地区
-
中东和中东地区非洲(MEA)
- 沙特阿拉伯
- 阿联酋
- 南非
- 中东其他地区和地区非洲
-
南美洲
- 巴西
- 阿根廷
- 南美洲其他地区
全球高速摄像机市场 - 公司简介
- AOS Technologies AG
- Edgertronic
- Fastec Imaging
- Integrated Design Tools
- Mega Speed USA
- Mikrotron GmBH
- NAC Image Technology
- NEC Corporation
- Optronis GmBH
- PCO AG
- Photron
- The Slow Motion Camera Company
- Vision Research

Naveen 是一位经验丰富的市场研究和咨询专业人士,在定制项目、联合项目和咨询项目方面拥有超过 9 年的专业经验。他目前担任副总裁,成功管理了项目价值链中的利益相关者,撰写了 100 多份研究报告和 30 多项咨询项目。他的工作涵盖工业和政府项目,为客户的成功和数据驱动的决策做出了重要贡献。
Naveen 拥有卡纳塔克邦 VTU 的电子与通信工程学位,以及马尼帕尔大学的市场营销与运营 MBA 学位。他已担任 IEEE 会员 9 年,积极参与各种会议、技术研讨会,并在分部和地区层面担任志愿者。在此之前,他曾担任 IndustryARC 的助理战略顾问和惠普(惠普全球)的工业服务器顾问。
- 历史分析(2 年)、基准年、预测(7 年)及复合年增长率
- PEST和SWOT分析
- 市场规模、价值/数量 - 全球、区域、国家
- 行业和竞争格局
- Excel 数据集
客户评价
Insight Partners 的 SCADA 系统市场报告内容全面,对当前趋势和未来预测提供了宝贵的见解。该团队始终高度专业、响应迅速且乐于助人。我们非常满意,强烈推荐他们的服务。
兰·凯德姆 伙伴, Reali Technologies LTD我请求一份关于特定软件市场的报告,团队在几天内就完成了。报告信息非常相关,而且呈现得非常出色。之后,我请求对报告进行一些修改和补充。团队再次迅速响应,不到一周我就收到了最终报告。
让-埃尔韦·詹恩 主席, 未来分析公司我们与 Insight Partners 合作进行了一项重要的市场研究和预测。他们清晰地洞察了机遇和风险,帮助我们制定了计划。他们的研究简单易用,数据可靠,帮助我们做出了明智而自信的决策。我们强烈推荐他们。
皮尤什·纳格帕尔 高级副总裁, 远光全球Insight Partners 凭借其深厚的行业专业知识,提供了富有洞察力、结构合理的市场研究。他们的团队始终专业且响应迅速。用户友好的网站让访问行业报告变得顺畅无阻。我们强烈推荐他们可靠、高质量的研究服务。
安达幸彦 首席执行官, 深蓝有限责任公司这是我第一次从The Insight Partners购买市场报告。起初我有些犹豫,但访问了他们的网站后,我更放心地冒险购买市场报告。我对报告的质量和客户服务非常满意。我对最初的报告有一些疑问和意见,但在与他们的分析师通过电子邮件沟通了几次后,我相信这份报告可以作为我们战略规划流程的参考。非常感谢您抽出宝贵的时间,让这次体验如此愉快。我一定会向其他人推荐你们的服务,当我们需要更多市场数据时,你们将是我的首选。
约翰·铃木 总裁兼首席执行官、董事会董事, BK科技感谢您在处理我关于尼日利亚传染病体外诊断市场信息请求的过程中所展现的支持和专业精神。感谢您的耐心、指导,以及您愿意提供的折扣,最终促成了这笔交易。我期待未来与 Insight Partners 继续合作,这一切都要归功于您与我初次接触后留下的良好印象。
奇吉奥克博士 ONYIA 董事总经理, PineCrest 医疗保健有限公司购买理由
- 明智的决策
- 了解市场动态
- 竞争分析
- 客户洞察
- 市场预测
- 风险规避
- 战略规划
- 投资论证
- 识别新兴市场
- 优化营销策略
- 提升运营效率
- 顺应监管趋势


 获取免费样品 - 高速摄像机市场