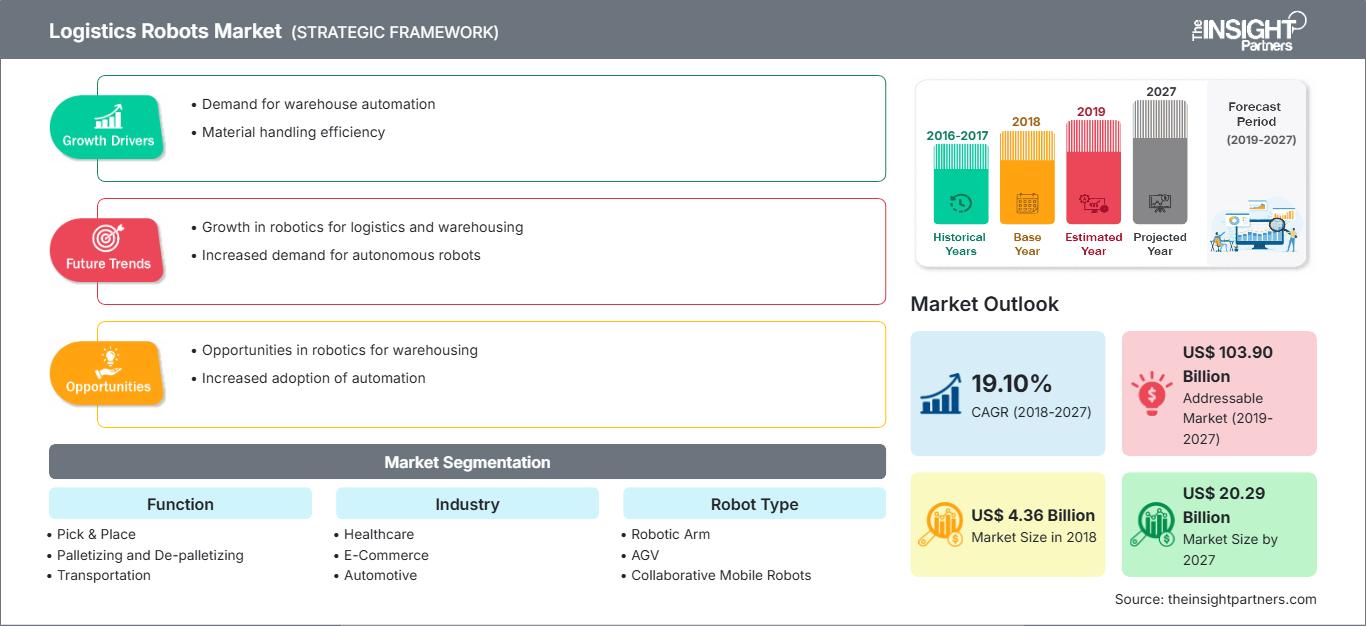
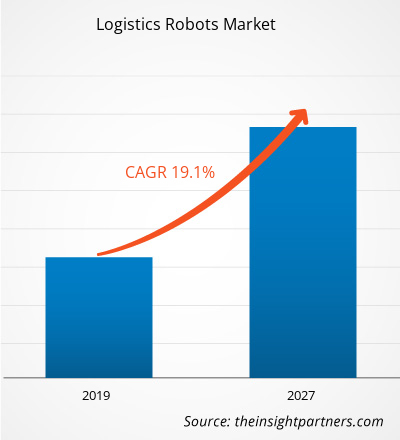
物流机器人市场基于(关键地区、市场参与者、规模和份额)- 到 2031 年的预测

  • Report Code : TIPTE100000924
  • Category : Automotive and Transportation
  • Status : Published
  • No. of Pages : 182
Buy Now

2018年物流机器人市场价值为43.562亿美元,预计2019年至2027年复合年增长率为19.10%,到2027年将达到202.934亿美元。

 < /p>

越来越多的物流和仓储公司大力致力于采用机器人,以提高效率、速度和增加利润,从而保持市场竞争力。机器人仓储和物流技术等先进技术的采用越来越多,以便以可承受的价格提高运营效率。全球物流机器人市场受到全球人口老龄化比例不断上升导致劳动力短缺以及全球供应链网络不断扩大等因素的推动,但物流机器人部署的高资本投资预计将抑制物流机器人的市场增长预测期内的市场。然而,不断提高的仓库自动化水平以及亚太地区和欧洲国家的成熟市场可能会在不久的将来为行业参与者带来巨大的增长机会,从而提高市场份额。

 < /p>利润丰厚的区域物流机器人市场


市场洞察

全球人口老龄化比例不断上升导致劳动力短缺< /p>

全球人口老龄化比例不断上升是各行业劳动力减少的主要因素之一。世界上每个国家的社区老年人数量都在激增。人口老龄化已成为21世纪所有领域社会变革的重要因素之一,其中包括劳动力市场和金融市场。不过,考虑到65岁以上人口占相当大的比例,意大利、日本等许多国家都是老龄化人口比例最高的国家。据世界卫生组织预计,到2050年,全球将有约200万人年龄在60岁以上,这一数字是2000年的三倍。老龄化人口激增导致劳动力短缺。物流机器人在多个行业的实施发挥着重要作用,因为它降低了流程的总体成本,提高了生产率,增强了安全性,并减少了人为错误。全球仓库技术的快速进步,重点关注与供应链流程面临的困难相关的要求,并确保所使用的技术与业务目标相关。在产品生命周期的不同单元、功能和阶段实施机器人一直是当今仓库在其发展道路上面临的关键挑战,这反过来又会在不久的将来推动物流机器人市场的发展。

< p> 


机器人类型洞察

协作移动机器人细分市场在全球物流机器人市场中占据最大份额。它们被部署在各个行业中,执行包装、机器维护和物料搬运等多种任务,因为这些协作机器人足以熟练地处理重型和轻型操作。它们高度准确、灵活且精确。此外,协作机器人易于维护,并且更容易重新配置和重新编程。这些机器人还可以处理敏感的工作;此外,它们还根据制造过程中出现的不一致情况进行自我调整。协作机器人能够收集关键指标,提供机载分析和报告,以简化决策过程,推动整个物流机器人市场的发展。


功能洞察

运输领域在全球物流机器人市场中占据最大份额。货物采用托盘包装,且多种产品形状和尺寸略有差异,这就要求这些货物的装卸实现自动化。 3D 激光视觉与新的机器人软件集成,可帮助用户了解容器中的不同产品,确定理想的装载/卸载顺序,并以高精度执行该过程。物流机器人用于目标货架的移动、篮子的牵引和提升、货架上的叉子的伸展以及目标位置的返回带动了整个物流机器人市场。

全球物流机器人市场,按功能划分2018年& 2027


行业洞察

外包物流领域在全球物流中占据最大份额机器人市场。这些物流服务提供商提供各种服务,包括仓储、库存管理、运输、配送、订单履行和货运整合。对及时交付管理以及降低运输成本的需求不断增长,加强了对库存材料记录以及核心业务和流程的关注。公司资产的减少预计将在预测期内推动物流机器人市场的发展。


战略见解

公司通常采用多种市场主动策略来扩大其全球足迹并满足不断增长的需求。这一策略主要在欧洲和亚太地区实施。物流机器人市场的参与者采取扩张和研发投资的策略来扩大全球客户群,这也使参与者能够在全球范围内保持其品牌知名度。

p>

物流机器人市场——按机器人类型

  • 机械臂
  • AGV
  • 协作移动机器人
  • 其他
< p>物流机器人市场——按功能

  • 挑选和选择地点
  • 码垛和卸垛
  • 运输
  • 包装

物流机器人市场 -按行业

  • 医疗保健
  • 电子商务
  • 汽车
  • 外包物流
  • 零售
  • li>
  • 消费品
  • 食品和饮料
  • 其他

物流机器人市场 -按地理位置

  • 北美洲
    • 美国
    • 加拿大
    • 墨西哥
  • < li>欧洲
    • 法国
    • 德国
    • 意大利
    • 英国
    • 俄罗斯
    • 其他欧洲
  • 亚太地区
    • 中国
    • 印度
    • 韩国
    • 日本
    • 澳大利亚
    • 亚太地区其他地区
  • 中东和非洲非洲
    • 南非
    • 沙特阿拉伯
    • 阿联酋
    • 中东其他地区和非洲
  • 阿联酋
  • 中东其他地区和非洲li>
  • 南美洲
    • 巴西
    • 阿根廷
    • 南美洲其他地区
  • < p> 

    公司简介

    • AGV International
    • Clearpath Robotics
    • 大福有限公司
    • Fanuc Corporation
    • Fetch Robotics Inc.
    • Kion Group AG
    • KNAPP AG
    • Kollmorgen
    • 库卡股份公司
    • 东芝公司
    Report Coverage
    Report Coverage

    Revenue forecast, Company Analysis, Industry landscape, Growth factors, and Trends

    Segment Covered
    Segment Covered

    This text is related
    to segments covered.

    Regional Scope
    Regional Scope

    North America, Europe, Asia Pacific, Middle East & Africa, South & Central America

    Country Scope
    Country Scope

    This text is related
    to country scope.

    Frequently Asked Questions


    Which robot type is most preferred in logistics automation?

    Automated guided vehicles (AGVs) are used for consistent as well as predicted transport of materials. AGVs might be serviced through conveyors, forklift trucks, or manual cart transport systems. The transport of bulk materials using AGVs helps minimize efforts required in repetitive transportation of small chunks of materials, with less human intervention. Apart from distribution and manufacturing, AGVs have also become an integral part of other industries, including retail, military, food & beverages, automotive, and healthcare. The deployment of AGVs benefits businesses by reducing the cost of labor required in manual execution of tasks; enhancing safety, accuracy, and productivity of products; and improving the efficiency of work when integrated with the warehouse management/control systems. Improved work efficiencies further helps streamline other processes, such as materials ordering and inventory management.

    What are market opportunities for logistics robots market?

    The continuous growth in consumer expectations is likely to drive continued investment for the adoption of logistics robots for performing operational functions in warehouses. Leveraging the modern supply chain technology as well as the Internet of Things (IoT), the focus on the “smart warehouse” concept is growing, which can serve as a hub to enhance the efficiency and speed of the entire supply chain process. The warehouse automation includes wearable wore by workers to sensors, logistics robots, internet-enabled devices, and smart equipment, which profoundly modify the logistics management. Warehouse management is constantly facing more pressures related to supply chain transformation, commoditization, and rising customer expectations. Therefore, the warehouse automation concept is an effective way to enhance efficiencies, reduce operational costs, and scale operations. The warehouse automation performs various activities such as data collection and inventory control, with million-dollar of investments.

    Which continent has highest demand for logistics robots?

    With the increasing importance of equipment in logistic markets in APAC, especially China and India, robot manufacturers realize that electronics innovations can complement production innovations in gaining a competitive advantage. Japan is a well-developed economy and is one of the most technologically advanced economies across the world. Also, the region has a few significant manufacturers of robots and factory automation systems such as Fanuc, Mitsubishi Electric, and Omron Corp, among others. The Japanese companies widely use automation solutions to maintain their competitive position in the market.

    The List of Companies - Logistics Robots Market

    1. AGV International
    2. Clearpath Robotics
    3. Daifuku Co. Ltd.
    4. Fanuc Corporation
    5. Fetch Robotics Inc
    6. KION GROUP AG
    7. KNAPP AG
    8. Kollmorgen
    9. Kuka AG
    10. Toshiba Corporation

    The Insight Partners performs research in 4 major stages: Data Collection & Secondary Research, Primary Research, Data Analysis and Data Triangulation & Final Review.

    1. Data Collection and Secondary Research:

    As a market research and consulting firm operating from a decade, we have published and advised several client across the globe. First step for any study will start with an assessment of currently available data and insights from existing reports. Further, historical and current market information is collected from Investor Presentations, Annual Reports, SEC Filings, etc., and other information related to company’s performance and market positioning are gathered from Paid Databases (Factiva, Hoovers, and Reuters) and various other publications available in public domain.

    Several associations trade associates, technical forums, institutes, societies and organization are accessed to gain technical as well as market related insights through their publications such as research papers, blogs and press releases related to the studies are referred to get cues about the market. Further, white papers, journals, magazines, and other news articles published in last 3 years are scrutinized and analyzed to understand the current market trends.

    1. Primary Research:

    The primarily interview analysis comprise of data obtained from industry participants interview and answers to survey questions gathered by in-house primary team.

    For primary research, interviews are conducted with industry experts/CEOs/Marketing Managers/VPs/Subject Matter Experts from both demand and supply side to get a 360-degree view of the market. The primary team conducts several interviews based on the complexity of the markets to understand the various market trends and dynamics which makes research more credible and precise.

    A typical research interview fulfils the following functions:

    • Provides first-hand information on the market size, market trends, growth trends, competitive landscape, and outlook
    • Validates and strengthens in-house secondary research findings
    • Develops the analysis team’s expertise and market understanding

    Primary research involves email interactions and telephone interviews for each market, category, segment, and sub-segment across geographies. The participants who typically take part in such a process include, but are not limited to:

    • Industry participants: VPs, business development managers, market intelligence managers and national sales managers
    • Outside experts: Valuation experts, research analysts and key opinion leaders specializing in the electronics and semiconductor industry.

    Below is the breakup of our primary respondents by company, designation, and region:

    Research Methodology

    Once we receive the confirmation from primary research sources or primary respondents, we finalize the base year market estimation and forecast the data as per the macroeconomic and microeconomic factors assessed during data collection.

    1. Data Analysis:

    Once data is validated through both secondary as well as primary respondents, we finalize the market estimations by hypothesis formulation and factor analysis at regional and country level.

    • Macro-Economic Factor Analysis:

    We analyse macroeconomic indicators such the gross domestic product (GDP), increase in the demand for goods and services across industries, technological advancement, regional economic growth, governmental policies, the influence of COVID-19, PEST analysis, and other aspects. This analysis aids in setting benchmarks for various nations/regions and approximating market splits. Additionally, the general trend of the aforementioned components aid in determining the market's development possibilities.

    • Country Level Data:

    Various factors that are especially aligned to the country are taken into account to determine the market size for a certain area and country, including the presence of vendors, such as headquarters and offices, the country's GDP, demand patterns, and industry growth. To comprehend the market dynamics for the nation, a number of growth variables, inhibitors, application areas, and current market trends are researched. The aforementioned elements aid in determining the country's overall market's growth potential.

    • Company Profile:

    The “Table of Contents” is formulated by listing and analyzing more than 25 - 30 companies operating in the market ecosystem across geographies. However, we profile only 10 companies as a standard practice in our syndicate reports. These 10 companies comprise leading, emerging, and regional players. Nonetheless, our analysis is not restricted to the 10 listed companies, we also analyze other companies present in the market to develop a holistic view and understand the prevailing trends. The “Company Profiles” section in the report covers key facts, business description, products & services, financial information, SWOT analysis, and key developments. The financial information presented is extracted from the annual reports and official documents of the publicly listed companies. Upon collecting the information for the sections of respective companies, we verify them via various primary sources and then compile the data in respective company profiles. The company level information helps us in deriving the base number as well as in forecasting the market size.

    • Developing Base Number:

    Aggregation of sales statistics (2020-2022) and macro-economic factor, and other secondary and primary research insights are utilized to arrive at base number and related market shares for 2022. The data gaps are identified in this step and relevant market data is analyzed, collected from paid primary interviews or databases. On finalizing the base year market size, forecasts are developed on the basis of macro-economic, industry and market growth factors and company level analysis.

    1. Data Triangulation and Final Review:

    The market findings and base year market size calculations are validated from supply as well as demand side. Demand side validations are based on macro-economic factor analysis and benchmarks for respective regions and countries. In case of supply side validations, revenues of major companies are estimated (in case not available) based on industry benchmark, approximate number of employees, product portfolio, and primary interviews revenues are gathered. Further revenue from target product/service segment is assessed to avoid overshooting of market statistics. In case of heavy deviations between supply and demand side values, all thes steps are repeated to achieve synchronization.

    We follow an iterative model, wherein we share our research findings with Subject Matter Experts (SME’s) and Key Opinion Leaders (KOLs) until consensus view of the market is not formulated – this model negates any drastic deviation in the opinions of experts. Only validated and universally acceptable research findings are quoted in our reports.

    We have important check points that we use to validate our research findings – which we call – data triangulation, where we validate the information, we generate from secondary sources with primary interviews and then we re-validate with our internal data bases and Subject matter experts. This comprehensive model enables us to deliver high quality, reliable data in shortest possible time.

    Your data will never be shared with third parties, however, we may send you information from time to time about our products that may be of interest to you. By submitting your details, you agree to be contacted by us. You may contact us at any time to opt-out.

    Related Reports