
赛车运动变速器市场分析及预测(按规模、份额、增长、趋势)2030
赛车运动变速箱市场规模和预测(2020 - 2030 年)、全球和区域份额、趋势和增长机会分析报告范围:按赛车类型 [一级方程式赛车、纳斯卡赛车、GT 赛车、WTCC(世界房车锦标赛)勒芒、拉力赛和越野赛、其他]、变速箱类型(手动、自动和顺序)和地理位置
- 状态 : 已发布
- 报告代码 : TIPAT00002483
- 类别 : 汽车和运输
- 页数 : 176
- 可用报告格式 :


- 最后更新日期 : June 13, 2024

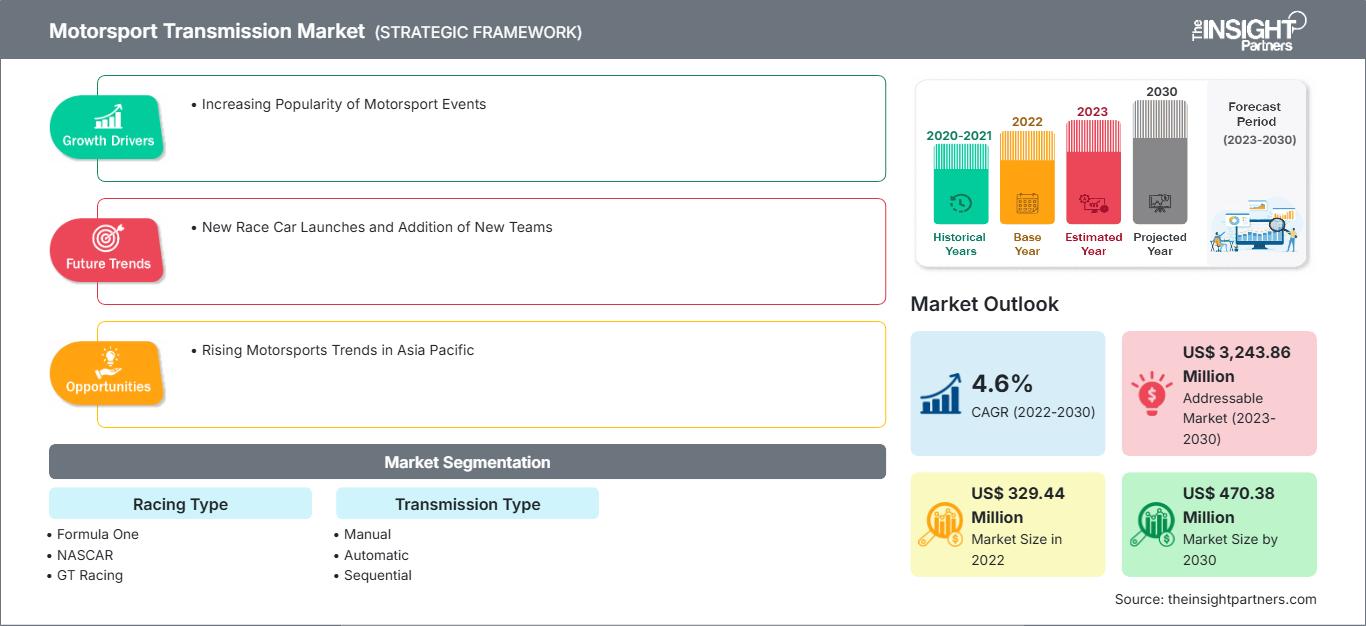
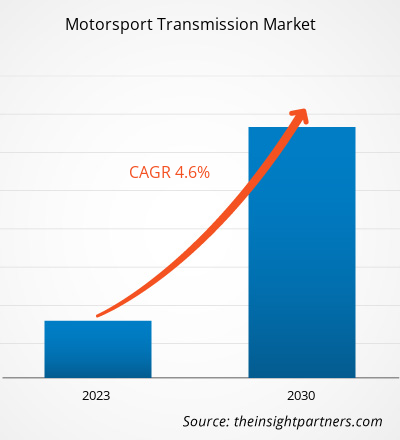
[研究报告] 2022年,赛车变速箱市场价值为3.2944亿美元,预计到2030年将达到4.7038亿美元;预计2022年至2030年期间的复合年增长率为4.6%。
分析师观点:
全球赛车变速箱市场分为五大区域:北美、欧洲、亚太地区、中东和非洲地区以及南美地区。全球赛车变速箱市场的发展受到赛车锦标赛数量的增加和全球跑车赛事日益普及的推动。主要的赛车锦标赛包括国际汽联世界耐力锦标赛、亚洲勒芒系列赛、欧洲勒芒系列赛、纳斯卡杯系列赛、世界房车杯赛、一级方程式世界锦标赛、超级方程式赛、国际汽联电动方程式世界锦标赛和印地赛车系列赛。赛车的日益普及,以及全球原始设备制造商在汽车研发方面的大量投资,是赛车变速箱市场增长的主要驱动因素。
赛车变速箱包括手动、自动和顺序系统。其中,顺序变速箱系统在 2022 年占据了最大份额,这得益于这种变速箱在一级方程式赛车中的日益普及。一级方程式赛车锦标赛是全球最常见的赛车类型,其次是勒芒和世界房车锦标赛。技术进步以及对赛车研发安全性和便利性的日益重视,是全球赛车变速箱市场顺序变速箱的关键驱动因素。例如,2020 年 12 月,HGT Precision 为新西兰 MotorSport 比赛的执照持有者推出了一款顺序变速箱。HGT Precision 使用高精度五轴数控机床生产了 Sequential 7075-T651 变速箱。该公司使用坚固的材料并采用精确的制造工艺来生产坚固而刚性的齿轮。 HGT 精密齿轮公司生产的金刚石磨削齿轮具有高耐用性、低噪音、高效率和抗点蚀等特点。这些因素正在推动赛车运动变速箱市场的增长。
同样,日产汽车于 2021 年 9 月面向日本及全球市场推出了 GT-R 赛车车型。该车型配备了顺序变速箱、基于碳陶瓷材料的制动器、基于碳纤维材料的后扰流板以及专属的发动机罩。主要厂商在变速箱系统方面的进步以及基于顺序变速箱系统的跑车的普及,推动了赛车运动变速箱市场的发展。
自定义此报告以满足您的要求
您将免费获得任何报告的定制,包括本报告的部分内容,或国家级分析、Excel 数据包,以及为初创企业和大学提供超值优惠和折扣
赛车传动系统市场: 战略洞察
-
获取本报告的主要市场趋势。这个免费样本将包括数据分析,从市场趋势到估计和预测。
市场概览:
近年来,赛车运动的收视率大幅提升。纵观全球赛车赛事,一级方程式赛车在吸引力和收视率方面无与伦比,2023 赛季的观众人数约为 19 亿。根据 IndyCar 的数据,该系列赛在 NBC 上平均每场比赛有 140.3 万观众,同比增长 2%。在爱荷华赛道举行的双赛尤其精彩,整个周末平均有 121 万观众,同比增长 31%。印第安纳波利斯 500 是本赛季最吸引人的赛事之一,平均观众人数为 494 万。虽然这一数字高于去年的平均观众人数 484 万,但 2023 年是该赛事仅有的四个观众人数少于 500 万的赛季之一。所有这些因素都在推动赛车运动变速箱市场的增长。
由于赛车运动赛事的受欢迎程度和支出不断增加,过去几年赛事收入有所增加。F1 的母公司 Liberty Media 表示,2022 年赛车推广收入为 25 亿美元,比上一年的 21 亿美元增长 20%。与上一年相比,一级方程式赛车的整体收入在 2023 年第三季度大幅增长。一级方程式赛车的收入在 2023 年第三季度继续增长,从 2022 年的 7.15 亿美元攀升至 2023 年的 8.87 亿美元,增幅为 24%。这些因素直接影响了赛车变速器市场。
市场驱动因素:
赛车运动赛事日益普及推动了赛车变速器市场的增长
近年来,赛车运动的收视率急剧上升。纵观全球赛车运动,一级方程式赛车在吸引力和收视率方面无与伦比,2023 赛季的观众人数约为 19 亿。根据 IndyCar 的数据,该系列赛在 NBC 上平均每场比赛有 140.3 万观众,同比增长 2%。在爱荷华赛道举行的双头赛尤其精彩,整个周末平均有 121 万观众,同比增长 31%。印第安纳波利斯 500 是本赛季最吸引人的赛事之一,平均观众人数为 494 万。虽然这一数字高于去年平均 484 万观众,但 2023 年是仅有的四个观众人数少于 500 万的赛季之一。2022 年美国一级方程式赛季在 ESPN、ESPN2 和 ABC 上平均每场比赛有 121 万观众观看,比 2021 年创下的美国电视平均每场比赛 94.9 万观众的纪录增长了 28%。此外,2022 赛季是美国电视历史上第一个平均每场比赛有 100 万观众观看的赛季。如此庞大的观众群可能会吸引投资,预计这将推动赛车传动装置市场的增长。
在电视收视率方面,美国排名第三。随着人气的上升和日程表上越来越多的国内赛事,美国很可能在未来几年进入前五名。其他收视率快速增长的国家大多已跻身世界前五。然而,中国和俄罗斯的收视率大幅增长。 Motorsport Network 于 2021 年 8 月和 10 月开展了全球 F1 车迷调查。共收集到 167,302 份完整回复,为历年最多。34% 的受访者年龄在 24 岁以下,近 63% 的受访者年龄在 34 岁以下。赛车运动日益普及,对赛事数量产生了积极影响。因此,出现了一些新的小型赛车赛事,这些赛事对赛车变速箱市场的增长产生了直接积极的影响。
分段分析:
根据比赛类型,全球赛车变速箱市场份额分为一级方程式赛车、纳斯卡赛车、GT 赛车、世界房车锦标赛 (WTCC)、勒芒赛车、拉力赛和越野赛以及其他赛事。其中,一级方程式赛车占据赛车变速箱市场的最大份额,因为该赛事在美国、中国、德国、法国和意大利等国家都有举办。一级方程式赛车的成本也高于其他赛车。此外,2021 年一级方程式赛季人气最高,全球观众超过 15.5 亿,吸引了约 4.45 亿独立观众。
区域分析:
北美已稳居全球赛车变速器市场第二位。一级方程式赛车在北美最受欢迎,而纳斯卡 (NASCAR) 现已成为该地区第二受欢迎的赛车运动。由于汽车制造商的强大影响力和对赛车运动的深厚热情,美国市场占据最大份额。Xtrac 和 G-Force Racing Transmissions 等公司在生产用于各种赛车运动的高性能变速器方面表现突出。美国赛车变速器市场受到浓厚的赛车文化以及对纳斯卡、印地赛车、直线加速赛和越野赛的高需求驱动。就总收入而言,加拿大紧随美国之后。该国举办了一轮一级方程式锦标赛,吸引了全球的关注。
关键参与者分析:
Marelli Holdings Co Ltd、Ricardo Plc、Drenth Gearboxes Holland BV、EMCO Gears Inc、Samsonas Motorsport UAB、Hewland Engineering Ltd、ZF Friedrichshafen AG、SADEV SAS、Holinger Engineering Co Pty Ltd 和 Xtrac Ltd 是赛车变速器市场的主要参与者。
赛车传动系统市场区域洞察
The Insight Partners 的分析师已详尽阐述了预测期内影响赛车变速器市场的区域趋势和因素。本节还讨论了北美、欧洲、亚太地区、中东和非洲以及南美和中美洲的赛车变速器市场细分和地域分布。
赛车传动市场报告范围
| 报告属性 | 细节 |
|---|---|
| 市场规模 2022 | US$ 329.44 Million |
| 市场规模 2030 | US$ 470.38 Million |
| 全球复合年增长率 (2022 - 2030) | 4.6% |
| 历史数据 | 2020-2021 |
| 预测期 | 2023-2030 |
| 涵盖的领域 |
By 赛车类型
|
| 覆盖地区和国家 |
北美
|
| 市场领导者和主要公司简介 |
|
赛车传动系统市场参与者密度:了解其对业务动态的影响
赛车运动变速箱市场正在快速增长,这得益于终端用户需求的不断增长,而这些需求的驱动因素包括消费者偏好的不断变化、技术进步以及对产品优势的认知度不断提高。随着需求的增长,企业正在扩展产品线,不断创新以满足消费者需求,并抓住新兴趋势,从而进一步推动市场增长。
- 获取 赛车传动系统市场 主要参与者概述
最新动态:
全球赛车变速箱市场的企业普遍采用并购等非有机和有机战略。以下列出了一些主要赛车变速箱市场参与者的最新动态:
年份 |
新闻 |
地区 |
|
2023年5月 |
里卡多宣布与英国超级跑车制造商迈凯伦汽车建立多年合作伙伴关系,共同生产其下一代V8动力装置。 |
欧洲 |
|
2023 年 7 月 |
Inflexion 宣布已同意将其在 Xtrac Ltd.(“Xtrac”)的投资出售给 MiddleGround Capital— 一家美国和欧洲中型市场私募股权公司。Xtrac 是一家市场领先的赛车运动和高性能领域传动系统制造商。 |
北美 |

Naveen 是一位经验丰富的市场研究和咨询专业人士,在定制项目、联合项目和咨询项目方面拥有超过 9 年的专业经验。他目前担任副总裁,成功管理了项目价值链中的利益相关者,撰写了 100 多份研究报告和 30 多项咨询项目。他的工作涵盖工业和政府项目,为客户的成功和数据驱动的决策做出了重要贡献。
Naveen 拥有卡纳塔克邦 VTU 的电子与通信工程学位,以及马尼帕尔大学的市场营销与运营 MBA 学位。他已担任 IEEE 会员 9 年,积极参与各种会议、技术研讨会,并在分部和地区层面担任志愿者。在此之前,他曾担任 IndustryARC 的助理战略顾问和惠普(惠普全球)的工业服务器顾问。
- 全面的市场规模与预测分析
- 详细的细分市场分析
- 深入的市场动态评估
- 区域及国家级洞察
- 竞争格局与企业对标分析
- 战略性商业情报
客户评价
Insight Partners 的 SCADA 系统市场报告内容全面,对当前趋势和未来预测提供了宝贵的见解。该团队始终高度专业、响应迅速且乐于助人。我们非常满意,强烈推荐他们的服务。
兰·凯德姆 伙伴, Reali Technologies LTD我请求一份关于特定软件市场的报告,团队在几天内就完成了。报告信息非常相关,而且呈现得非常出色。之后,我请求对报告进行一些修改和补充。团队再次迅速响应,不到一周我就收到了最终报告。
让-埃尔韦·詹恩 主席, 未来分析公司我们与 Insight Partners 合作进行了一项重要的市场研究和预测。他们清晰地洞察了机遇和风险,帮助我们制定了计划。他们的研究简单易用,数据可靠,帮助我们做出了明智而自信的决策。我们强烈推荐他们。
皮尤什·纳格帕尔 高级副总裁, 远光全球Insight Partners 凭借其深厚的行业专业知识,提供了富有洞察力、结构合理的市场研究。他们的团队始终专业且响应迅速。用户友好的网站让访问行业报告变得顺畅无阻。我们强烈推荐他们可靠、高质量的研究服务。
安达幸彦 首席执行官, 深蓝有限责任公司这是我第一次从The Insight Partners购买市场报告。起初我有些犹豫,但访问了他们的网站后,我更放心地冒险购买市场报告。我对报告的质量和客户服务非常满意。我对最初的报告有一些疑问和意见,但在与他们的分析师通过电子邮件沟通了几次后,我相信这份报告可以作为我们战略规划流程的参考。非常感谢您抽出宝贵的时间,让这次体验如此愉快。我一定会向其他人推荐你们的服务,当我们需要更多市场数据时,你们将是我的首选。
约翰·铃木 总裁兼首席执行官、董事会董事, BK科技感谢您在处理我关于尼日利亚传染病体外诊断市场信息请求的过程中所展现的支持和专业精神。感谢您的耐心、指导,以及您愿意提供的折扣,最终促成了这笔交易。我期待未来与 Insight Partners 继续合作,这一切都要归功于您与我初次接触后留下的良好印象。
奇吉奥克博士 ONYIA 董事总经理, PineCrest 医疗保健有限公司购买理由
- 明智的决策
- 了解市场动态
- 竞争分析
- 客户洞察
- 市场预测
- 风险规避
- 战略规划
- 投资论证
- 识别新兴市场
- 优化营销策略
- 提升运营效率
- 顺应监管趋势


