رسم تخطيطي لتحليل سوق البرمجيات والتنبؤ به حسب الحجم والمشاركة والنمو والاتجاهات 2031
البيانات التاريخية : 2021-2022 | سنة الأساس : 2023 | فترة التنبؤ : 2024-2031حجم سوق برامج التخطيط البياني وتوقعاته (2021-2031)، والحصة العالمية والإقليمية، والاتجاهات، وفرص النمو. يغطي التقرير: حسب نوع النشر (السحابي والمحلي)، وحجم المؤسسة (الشركات الصغيرة والمتوسطة والكبيرة)، والتطبيق (المؤسسات التعليمية والشركات والأفراد)، والموقع الجغرافي.
- تاريخ التقرير : Mar 2026
- رمز التقرير : TIPRE00011177
- الفئة : التكنولوجيا والإعلام والاتصالات
- الحالة : البيانات الصادرة
- تنسيقات التقارير المتاحة :


- عدد الصفحات : 150
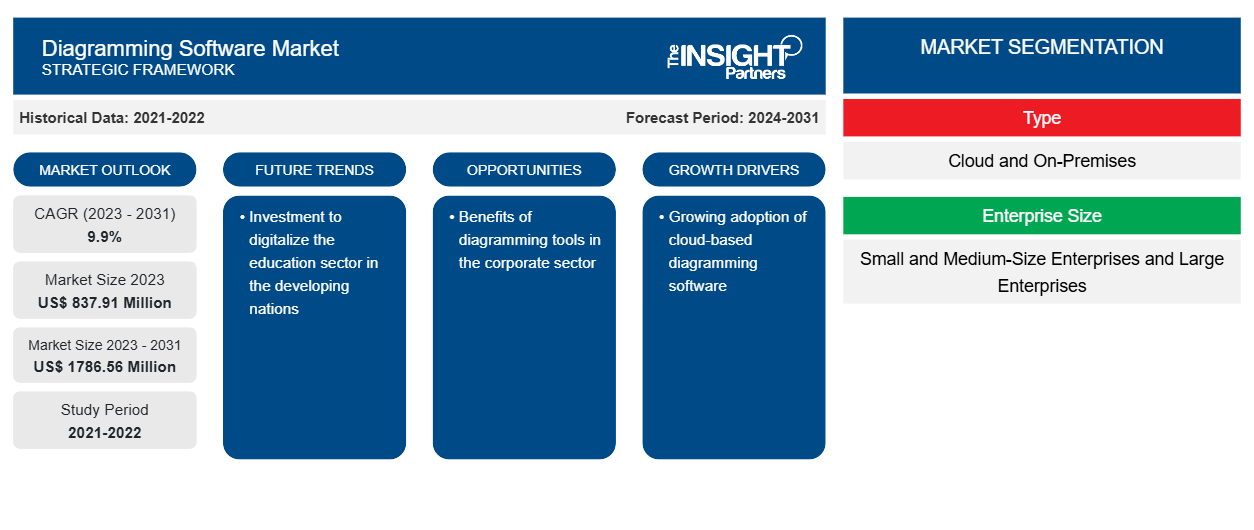
من المتوقع أن يصل حجم سوق برامج الرسم البياني إلى 1786.56 مليون دولار أمريكي بحلول عام 2031 من 837.91 مليون دولار أمريكي في عام 2023. ومن المتوقع أن يسجل السوق معدل نمو سنوي مركب بنسبة 9.9٪ خلال الفترة 2023-2031. ومن المرجح أن يظل الارتفاع في الرقمنة والاعتماد المتزايد على برامج الرسم البياني المستندة إلى السحابة من الاتجاهات الرئيسية في السوق.
تحليل سوق برامج الرسم البياني
تكتسب سوق برامج الرسم البياني زخمًا بسبب التبني المتزايد من قبل الشركات الكبيرة والشركات الصغيرة والمتوسطة الحجم. يساعد تبني هذا البرنامج في تحديد سير العمل والعمليات بشكل أفضل في بيئة الأعمال . يمكن لأقسام مختلفة في المنظمة مثل التسويق والموارد البشرية والهندسة والعمليات استخدامها على نطاق واسع.
نظرة عامة على سوق برامج الرسم البياني
بمساعدة برنامج رسم المخططات البيانية، يمكن للمستخدم إنشاء مخططات تفصيلية، تتضمن مخططات انسيابية ومخططات دائرية ومخططات أرضية ومخططات أخرى، استنادًا إلى مجموعات البيانات والصور. يتضمن برنامج رسم المخططات البيانية قوالب مختلفة تساعد المستخدم على إنشاء المخطط من الصفر. يمكن لهذا البرنامج التكامل بسهولة مع أدوات ومنصات أخرى حيث يمكن لمستخدمين متعددين عرض المخطط والمساهمة في إنشائه.
قم بتخصيص هذا التقرير ليناسب متطلباتك
ستحصل على تخصيص لأي تقرير - مجانًا - بما في ذلك أجزاء من هذا التقرير، أو تحليل على مستوى الدولة، وحزمة بيانات Excel، بالإضافة إلى الاستفادة من العروض والخصومات الرائعة للشركات الناشئة والجامعات
سوق برامج الرسم البياني: رؤى استراتيجية
-
احصل على أهم اتجاهات السوق الرئيسية لهذا التقرير.ستتضمن هذه العينة المجانية تحليلاً للبيانات، بدءًا من اتجاهات السوق وحتى التقديرات والتوقعات.
برامج رسم المخططات البيانية: العوامل المحفزة والفرص في سوق البرمجيات
فوائد أدوات الرسم البياني في القطاع المؤسسي
تساعد المخططات البيانية في تقليل تعقيدات الاتصال. في بيئة الأعمال، توفر المخططات البيانية تمثيلًا مرئيًا واضحًا وموجزًا لعمليات الأعمال. كما تساعد في فهم جميع الموظفين فيما يتعلق بالأهداف والعمليات التي يجب اتباعها في تنفيذ المشروع. مع اعتماد أدوات المخططات البيانية، يمكن لقادة الفريق أو مديري المشاريع تسليم سير عمل المشروع لموظفيهم، وشرح ذلك باستخدام مخطط بياني. تساعدهم برامج المخططات البيانية في إنشاء مخططات دائرية ومخططات انسيابية والعديد من المخططات البيانية الأخرى. يساعد التمثيل المرئي لأهداف المشروع أو العمل الموظفين على فهم اتجاهات ونطاق المشروع بشكل أفضل. وبالتالي، تتبنى الشركات على نطاق واسع برامج المخططات البيانية.
اعتماد البرمجيات المستندة إلى السحابة
نظرًا لارتفاع مبادرات التصنيع والعولمة في كل من البلدان المتقدمة والنامية، فإن الأنشطة التجارية تنمو في جميع الصناعات. بالإضافة إلى ذلك، لوحظ أن الشركات تتبنى التحول الرقمي للحصول على ميزة تنافسية وتعظيم إنتاجيتها. ولهذا، تبحث الشركات عن حل فعال من حيث التكلفة، مما يؤدي إلى اعتماد حل برمجيات الرسم البياني المستند إلى السحابة .
تقرير تحليل تجزئة سوق برامج الرسم البياني
إن القطاعات الرئيسية التي ساهمت في اشتقاق تحليل سوق برامج التخطيط البياني هي نوع النشر وحجم المؤسسة والتطبيق.
- بناءً على نوع النشر، ينقسم سوق برامج الرسم البياني إلى سحابي ومحلي. احتل قطاع المحلي الحصة الأكبر من السوق في عام 2023.
- من حيث حجم المؤسسة، يتم تقسيم السوق إلى شركات صغيرة ومتوسطة الحجم وشركات كبيرة. ومن المتوقع أن ينمو قطاع الشركات الصغيرة والمتوسطة الحجم بأعلى معدل نمو سنوي مركب.
- بحسب حجم المؤسسة، يتم تقسيم السوق إلى مؤسسات تعليمية وشركات وموظفين. احتل قطاع المؤسسات التعليمية حصة كبيرة من السوق في عام 2023.
تحليل حصة سوق برامج الرسم البياني حسب المنطقة الجغرافية
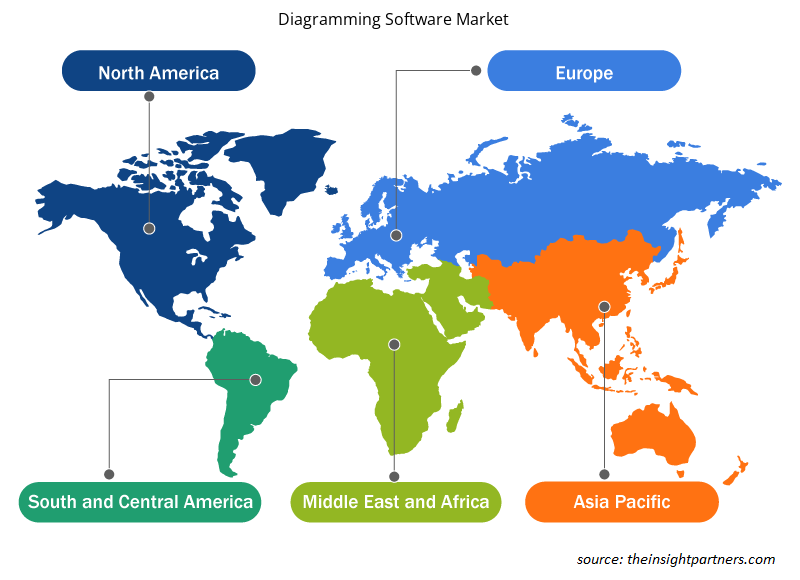
ينقسم النطاق الجغرافي لتقرير سوق برامج الرسم البياني بشكل أساسي إلى خمس مناطق: أمريكا الشمالية، ومنطقة آسيا والمحيط الهادئ، وأوروبا، والشرق الأوسط وأفريقيا، وأمريكا الجنوبية والوسطى.
استحوذت منطقة آسيا والمحيط الهادئ على أكبر حصة في السوق ومن المتوقع أن تنمو بمعدل نمو سنوي مركب هو الأعلى. وتستحوذ دول مثل الهند واليابان والصين على غالبية حصة السوق في منطقة آسيا والمحيط الهادئ. ويُعد التحول الرقمي المتزايد أحد العوامل الرئيسية التي تؤدي إلى تبني الحلول الرقمية. كما تعمل منصات التعلم الإلكتروني المتنامية والشركات الصغيرة والمتوسطة الحجم المتنامية في الدول النامية على دفع تبني حلول برامج الرسم البياني.
رؤى إقليمية حول سوق برامج رسم المخططات البيانية
لقد قام المحللون في Insight Partners بشرح الاتجاهات والعوامل الإقليمية المؤثرة على سوق برامج الرسم البياني طوال فترة التوقعات بشكل شامل. يناقش هذا القسم أيضًا قطاعات سوق برامج الرسم البياني والجغرافيا في جميع أنحاء أمريكا الشمالية وأوروبا ومنطقة آسيا والمحيط الهادئ والشرق الأوسط وأفريقيا وأمريكا الجنوبية والوسطى.
- احصل على البيانات الإقليمية المحددة لسوق برامج الرسم البياني
نطاق تقرير سوق برامج الرسم البياني
| سمة التقرير | تفاصيل |
|---|---|
| حجم السوق في عام 2023 | 837.91 مليون دولار أمريكي |
| حجم السوق بحلول عام 2031 | 1786.56 مليون دولار أمريكي |
| معدل النمو السنوي المركب العالمي (2023 - 2031) | 9.9% |
| البيانات التاريخية | 2021-2022 |
| فترة التنبؤ | 2024-2031 |
| القطاعات المغطاة |
حسب النوع
|
| المناطق والدول المغطاة |
أمريكا الشمالية
|
| قادة السوق وملفات تعريف الشركات الرئيسية |
|
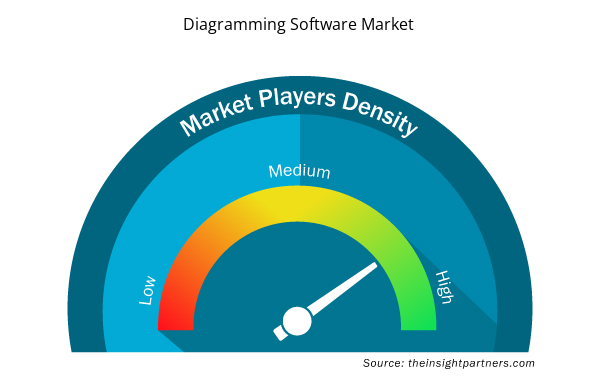
رسم مخطط كثافة اللاعبين في سوق البرمجيات: فهم تأثيره على ديناميكيات الأعمال
يشهد سوق برامج الرسم البياني نموًا سريعًا، مدفوعًا بالطلب المتزايد من المستخدم النهائي بسبب عوامل مثل تفضيلات المستهلك المتطورة والتقدم التكنولوجي والوعي المتزايد بفوائد المنتج. ومع ارتفاع الطلب، تعمل الشركات على توسيع عروضها والابتكار لتلبية احتياجات المستهلكين والاستفادة من الاتجاهات الناشئة، مما يؤدي إلى زيادة نمو السوق.
تشير كثافة اللاعبين في السوق إلى توزيع الشركات أو المؤسسات العاملة في سوق أو صناعة معينة. وهي تشير إلى عدد المنافسين (اللاعبين في السوق) الموجودين في مساحة سوق معينة نسبة إلى حجمها أو قيمتها السوقية الإجمالية.
الشركات الرئيسية العاملة في سوق برامج الرسم البياني هي:
- كرييتلي
- ارسم.io
- جليفي بواسطة بيرفورس
- إيدراوسوفت
- لوسيدشارت
- مايكروسوفت
إخلاء المسؤولية : الشركات المذكورة أعلاه ليست مرتبة بأي ترتيب معين.
- احصل على نظرة عامة على أهم اللاعبين الرئيسيين في سوق برامج الرسم البياني
أخبار سوق برامج الرسم البياني والتطورات الأخيرة
يتم تقييم سوق برامج الرسم البياني من خلال جمع البيانات النوعية والكمية بعد البحث الأولي والثانوي، والذي يتضمن منشورات الشركات المهمة وبيانات الجمعيات وقواعد البيانات. فيما يلي بعض التطورات في سوق برامج الرسم البياني:
- أطلقت Google أداة Google Cloud Architecture Diagramming Tool الجديدة تمامًا. تتيح هذه الأداة للمستخدم مشاركة الرؤية مع الفريق والتعاون معهم وتكرار التصميم وإنشاء الإصدار النهائي الذي يلبي بشكل أفضل متطلبات حالة الاستخدام التجاري. (المصدر: Google، بيان صحفي، فبراير 2022)
- أطلقت شركة EdrawMax، وهي شركة رائدة في مجال برامج رسم المخططات البيانية، نسختها المحمولة، تطبيق EdrawMax، والذي تم تصميمه لتمكين المستخدمين من إنشاء مخططات انسيابية ومخططات كتلية احترافية بسهولة. ويعمل التطبيق الجديد على تحسين الإنتاجية وتوفير الوقت للمستخدمين، حيث يوفر أكثر من 20 ألف قالب مخطط عالي الجودة يمكن للمستخدمين تخصيصه وتعديله لإنشاء مخططات بيانية مصقولة المظهر. (المصدر: PRNewswire، بيان صحفي، أبريل 2023)
تقرير سوق برامج الرسم البياني والتغطية والمنتجات النهائية
يوفر تقرير "حجم سوق برامج الرسم البياني والتوقعات (2021-2031)" تحليلاً مفصلاً للسوق يغطي المجالات التالية:
- حجم سوق برامج الرسم البياني وتوقعاته على المستويات العالمية والإقليمية والوطنية لجميع قطاعات السوق الرئيسية التي يغطيها النطاق
- رسم مخططات لاتجاهات سوق البرمجيات، بالإضافة إلى ديناميكيات السوق مثل المحركات والقيود والفرص الرئيسية
- تحليل مفصل لقوى PEST/Porter الخمس وSWOT
- تحليل سوق برامج الرسم البياني الذي يغطي اتجاهات السوق الرئيسية والإطار العالمي والإقليمي والجهات الفاعلة الرئيسية واللوائح والتطورات الأخيرة في السوق
- تحليل المشهد الصناعي والمنافسة الذي يغطي تركيز السوق، وتحليل الخريطة الحرارية، واللاعبين البارزين، والتطورات الأخيرة في سوق برامج الرسم البياني
- ملفات تعريف الشركة التفصيلية

أنكيتا خبيرة ديناميكية في أبحاث السوق والاستشارات، تتمتع بخبرة تزيد عن 8 سنوات في قطاعات التكنولوجيا والإعلام وتكنولوجيا المعلومات والاتصالات والإلكترونيات وأشباه الموصلات. وقد قادت ونفذت بنجاح أكثر من 100 مهمة استشارية وبحثية لعملاء عالميين مثل مايكروسوفت وأوراكل وشركة NEC وSAP وKPMG وExpeditors International. تشمل كفاءاتها الأساسية تقييم السوق، وتحليل البيانات، والتنبؤ، وصياغة الاستراتيجيات، والاستخبارات التنافسية، وكتابة التقارير.
أنكيتا بارعة في إدارة دورات المشاريع الكاملة، بدءًا من تصميم عروض ما قبل البيع ومناقشات العملاء، وصولًا إلى تقديم رؤى عملية بعد البيع. كما أنها ماهرة في إدارة فرق متعددة الوظائف، وهيكلة وحدات بحثية معقدة، ومواءمة الحلول مع أهداف العمل الخاصة بالعملاء. وقد مكنتها مهاراتها الممتازة في التواصل والقيادة والعرض التقديمي من تحقيق نتائج قيّمة باستمرار في بيئات سوقية سريعة التطور.
- التحليل التاريخي (سنتان)، سنة الأساس، التوقعات (7 سنوات) مع معدل النمو السنوي المركب
- تحليل PEST و SWOT
- حجم السوق والقيمة / الحجم - عالمي، إقليمي، بلد
- الصناعة والمنافسة
- مجموعة بيانات إكسل
التقارير الحديثة
تقارير ذات صلة
شهادات العملاء
تقرير سوق أنظمة SCADA من Insight Partners شامل، ويقدم رؤى قيّمة حول الاتجاهات الحالية والتوقعات المستقبلية. تميّز الفريق باحترافية عالية وسرعة في الاستجابة ودعم مستمر طوال الوقت. نحن راضون جدًا ونوصي بشدة بخدماتهم.
ران كيديم شريك, شركة ريالي تكنولوجيز المحدودةطلبتُ تقريرًا عن سوق برمجيات محدد، وأعدّه الفريق في غضون أيام قليلة. كانت المعلومات ذات صلة وثيقة وعرضها جيد. ثم طلبتُ بعض التعديلات والإضافات على التقرير. وكان الفريق متجاوبًا للغاية، وحصلتُ على التقرير النهائي في أقل من أسبوع.
جان هيرفيه جين رئيس مجلس الإدارة, فيوتشر أناليتيكاعملنا مع شركة "إنسايت بارتنرز" لإجراء دراسة سوقية وتوقعات مهمة. زودونا برؤى واضحة حول الفرص والمخاطر، مما ساعدنا في صياغة خططنا. كانت أبحاثهم سهلة الاستخدام ومبنية على بيانات دقيقة، مما ساعدنا على اتخاذ قرارات ذكية وواثقة. نوصي بهم بشدة.
بيوش ناجبال نائب الرئيس الأول, شعاع عالي عالميقدّمت شركة Insight Partners أبحاثًا سوقية ثاقبة ومنظمة جيدًا بخبرة واسعة في هذا المجال. تميّز فريقهم بالاحترافية وسرعة الاستجابة طوال الوقت. وسهّل موقعهم الإلكتروني سهل الاستخدام الوصول إلى تقارير القطاع. نوصي بهم بشدة لخدمات بحثية موثوقة وعالية الجودة.
يوكيهيكو أداتشي المدير التنفيذي, ديب بلو، ذ.م.م.هذه أول مرة أشتري فيها تقرير سوق من The Insight Partners. رغم أنني كنت مترددًا في البداية، إلا أنني زرت موقعهم الإلكتروني وشعرت براحة أكبر للمخاطرة وشراء تقرير السوق. أنا راضٍ تمامًا عن جودة التقرير وخدمة العملاء. كانت لديّ عدة أسئلة وتعليقات حول التقرير الأولي، ولكن بعد بضع محادثات عبر البريد الإلكتروني مع محللهم، أعتقد أن لديّ تقريرًا يمكنني استخدامه كمدخل لعملية التخطيط الاستراتيجي لدينا. شكرًا جزيلاً لكم على تخصيص وقتكم الإضافي وجعل هذه التجربة إيجابية. سأوصي بخدماتكم للآخرين بالتأكيد، وستكونون أول من ألجأ إليه عندما نحتاج إلى المزيد من بيانات السوق.
جون سوزوكي الرئيس والرئيس التنفيذي وعضو مجلس الإدارة, بي كيه تكنولوجيزأود أن أقدّر دعمكم واحترافيتكم في الاستجابة لطلبي للحصول على معلومات بشأن سوق التشخيص المخبري للأمراض المعدية في نيجيريا. كما أُقدّر صبركم وتوجيهكم، واستعدادكم لتقديم خصم، مما مكّننا في النهاية من إتمام الصفقة. أتطلع إلى التعامل مع "ذا إنسايت بارتنرز" مستقبلًا، كل ذلك بفضل الانطباع الذي تركتموه لديّ نتيجةً لهذا اللقاء الأول.
الدكتور تشيجيوك أونيا المدير الإداري, شركة باينكريست للرعاية الصحية المحدودةسبب الشراء
- اتخاذ قرارات مدروسة
- فهم ديناميكيات السوق
- تحليل المنافسة
- رؤى العملاء
- توقعات السوق
- تخفيف المخاطر
- التخطيط الاستراتيجي
- مبررات الاستثمار
- تحديد الأسواق الناشئة
- تحسين استراتيجيات التسويق
- تعزيز الكفاءة التشغيلية
- مواكبة التوجهات التنظيمية


 احصل على عينة مجانية ل - سوق برامج الرسم البياني