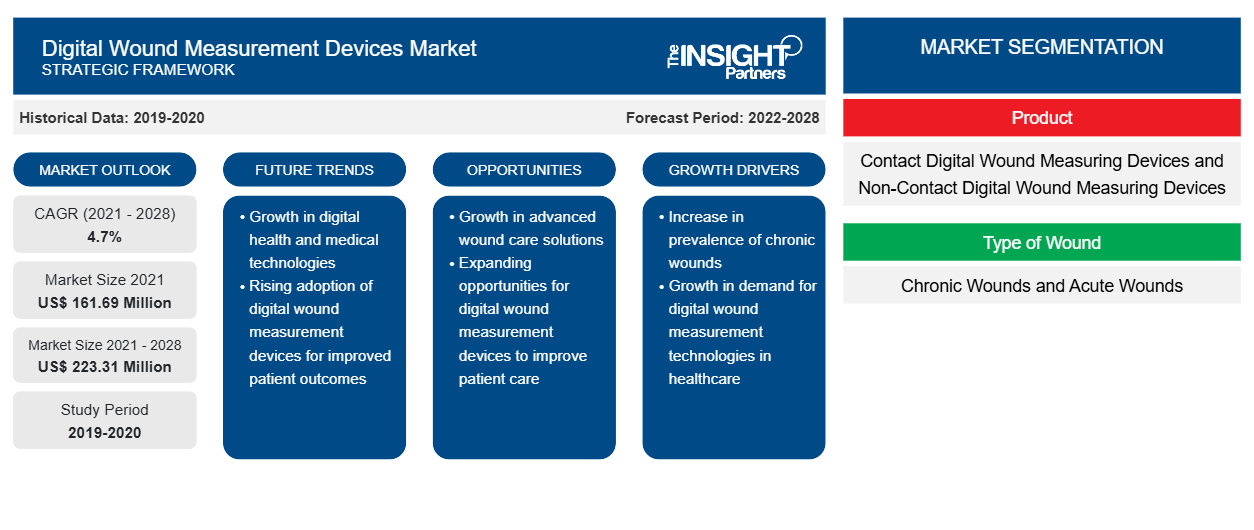
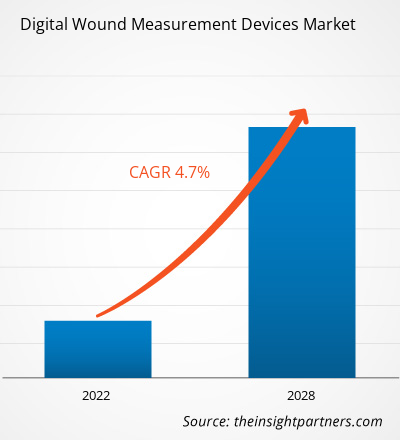
[تقرير بحثي] من المتوقع أن ينمو سوق أجهزة قياس الجروح الرقمية من 161.69 مليون دولار أمريكي في عام 2021 إلى 223.31 مليون دولار أمريكي بحلول عام 2028؛ ومن المتوقع أن ينمو بمعدل نمو سنوي مركب قدره 4.7٪ من عام 2021 إلى عام 2028.
جهاز قياس الجروح الرقمي هو جهاز متقدم يقيس أبعاد الجروح، مثل العرض والطول والمساحة والعمق. تُستخدم هذه الأجهزة لحساب التغير في الجروح أثناء التئامها وتحويل تتبع الخطوط في المقام الأول إلى قياس مساحة الجرح. توفر هذه الأجهزة التصوير والتوثيق وقياس الجرح من خلال تقديم تقييم ثلاثي الأبعاد مع دمج برنامج السجل الطبي الإلكتروني ( EMR ). لقد أثرت نتائج رعاية الجروح غير المتسقة على اللاعبين في الصناعة لتقديم الأدلة السريرية وتحسين تنسيق الرعاية من خلال الاستفادة من الأدوات الرقمية لاتخاذ القرارات والوظائف التشغيلية.
يتم تقسيم سوق أجهزة قياس الجروح الرقمية على أساس المنتج ونوع الجرح والتطبيق ونوع الجهاز والمستخدم النهائي والموقع الجغرافي. من خلال الموقع الجغرافي، يتم تقسيم سوق أجهزة قياس الجروح الرقمية على نطاق واسع إلى أمريكا الشمالية وأوروبا وآسيا والمحيط الهادئ والشرق الأوسط وأفريقيا وأمريكا الجنوبية والوسطى. يقدم التقرير رؤى متعمقة للسوق، مع التركيز على المعايير، مثل اتجاهات السوق والتقدم التكنولوجي وديناميكيات السوق، إلى جانب تحليل المشهد التنافسي للاعبين الرئيسيين في السوق.
قم بتخصيص هذا التقرير ليناسب متطلباتك
ستحصل على تخصيص لأي تقرير - مجانًا - بما في ذلك أجزاء من هذا التقرير، أو تحليل على مستوى الدولة، وحزمة بيانات Excel، بالإضافة إلى الاستفادة من العروض والخصومات الرائعة للشركات الناشئة والجامعات
سوق أجهزة قياس الجروح الرقمية:
- احصل على أهم اتجاهات السوق الرئيسية لهذا التقرير.ستتضمن هذه العينة المجانية تحليلاً للبيانات، بدءًا من اتجاهات السوق وحتى التقديرات والتوقعات.
رؤى السوق
زيادة حالات الإصابة بالقرحة تساهم بشكل كبير في نمو السوق
يساهم التبني المتزايد لأنماط الحياة غير الصحية واستهلاك الكحول والتدخين في ارتفاع معدل انتشار الأمراض غير المعدية. على سبيل المثال، في عام 2018، ذكرت منظمة الصحة العالمية أن 13٪ من البالغين الذين تتراوح أعمارهم بين 18 عامًا وما فوق يعانون من السمنة على مستوى العالم. الولايات المتحدة لديها أعلى معدل انتشار للسمنة (~ 42.4٪)، تليها المملكة العربية السعودية وتركيا ومصر وليبيا وإيران والعراق وجنوب إفريقيا وكندا والمكسيك وأستراليا والعديد من دول أمريكا الجنوبية وأوروبا. علاوة على ذلك، أثر مرض السكري على 34.2 مليون مواطن أمريكي (10.5٪ من السكان) اعتبارًا من عام 2018. يؤثر ما قبل السكري على 88 مليون شخص، وإذا تُرك دون علاج، يمكن أن يتطور إلى مرض السكري من النوع 2 (T2D) في غضون خمس سنوات. يؤثر مرض السكري على ~ 4.2٪ من الأشخاص الذين تتراوح أعمارهم بين 18 و 44 عامًا، و ~ 17.5٪ من البالغين الذين تتراوح أعمارهم بين 45 و 64 عامًا، و ~ 26.8٪ ممن تتراوح أعمارهم بين 65 عامًا وما فوق. وبالتالي، فإن المخاطر المتزايدة المرتبطة بمرض السكري، مثل قرح القدم السكرية وقرح الضغط، تزيد من حجم سوق أجهزة قياس الجروح الرقمية. وعلاوة على ذلك، فإن المضاعفات المرتبطة بمرض السكري، مثل قرح القدم السكرية ( DFUs )، تسهل أيضًا الحاجة إلى منتجات إدارة العناية بالجروح المتقدمة. على سبيل المثال، وفقًا للاتحاد الدولي للسكري، فإن الأشخاص المصابين بالسكري هم أكثر عرضة بنسبة 15 إلى 40 مرة للاحتياج إلى بتر الجزء السفلي من الساق. يتبع حوالي 85٪ من حالات البتر تطور قرحة القدم العصبية . لذلك، فإن هذه العوامل تدفع الطلب على أجهزة قياس الجروح الرقمية خلال فترة التنبؤ.
رؤى قائمة على المنتج
بناءً على نوع المنتج، ينقسم سوق أجهزة قياس الجروح الرقمية إلى أجهزة قياس الجروح الرقمية غير التلامسية وأجهزة قياس الجروح الرقمية التلامسية. في عام 2021، استحوذ قطاع أجهزة قياس الجروح الرقمية غير التلامسية على حصة سوقية أكبر بسبب التقدم التكنولوجي وطريقة الجهاز الفعالة وغير التلامسية لقياس مساحة السطح وحجم الجروح.
نوع من الرؤى المستندة إلى الجرح
بناءً على نوع الجرح، ينقسم سوق أجهزة قياس الجروح الرقمية إلى جروح مزمنة وجروح حادة. تنقسم الجروح المزمنة إلى قرح الضغط (PU) وقرحة القدم السكرية (DFU) وقرحة الساق الوريدية (VLU) وقرحة الشرايين. تنقسم الجروح الحادة إلى حروق وصدمات وجروح جراحية. احتل قطاع الجروح المزمنة حصة أكبر من السوق في عام 2021. ويعزى ذلك إلى ارتفاع معدل الإصابة بالجروح المزمنة مثل قرح الضغط وقرحة القدم السكرية وقرحة الساق الوريدية وقرحة الشرايين.
رؤى تعتمد على نوع الجهاز
بناءً على نوع الجهاز، ينقسم سوق أجهزة قياس الجروح الرقمية إلى أجهزة قياس الجروح ثلاثية الأبعاد وأجهزة القياس بمساعدة الليزر. استحوذ قطاع أجهزة قياس الجروح بمساعدة الليزر على حصة أكبر من السوق في عام 2021؛ ومن المتوقع أن يسجل معدل نمو سنوي مركب أعلى في السوق خلال فترة التوقعات.
رؤى قائمة على التطبيق
بناءً على التطبيق، يتم تقسيم سوق أجهزة قياس الجروح الرقمية إلى العناية بالجروح، والحفاظ على الأطراف، والجراحة الترميمية. يتم تقسيم قطاع العناية بالجروح أيضًا إلى تروية الدم، وعلاج الأكسجين عالي الضغط، وقابلية الأنسجة للحياة، وغيرها. احتل قطاع الجروح المزمنة الحصة الأكبر في سوق أجهزة قياس الجروح الرقمية في عام 2021. ومع ذلك، من المتوقع أن يسجل قطاع العناية بالجروح أعلى معدل نمو سنوي مركب في سوق أجهزة قياس الجروح الرقمية خلال فترة التنبؤ.
رؤى تعتمد على المستخدم النهائي
بناءً على المستخدم النهائي، ينقسم سوق أجهزة قياس الجروح الرقمية إلى المستشفيات والعيادات والمراكز المجتمعية. استحوذ قطاع المستشفيات والعيادات على حصة أكبر من سوق أجهزة قياس الجروح الرقمية في عام 2021؛ ومن المتوقع أن يسجل معدل نمو سنوي مركب أعلى في سوق أجهزة قياس الجروح الرقمية خلال الفترة المتوقعة.
تعد عمليات إطلاق المنتجات والاندماج والاستحواذ من الاستراتيجيات التي يتبناها اللاعبون في سوق أجهزة قياس الجروح الرقمية العالمية على نطاق واسع. فيما يلي بعض التطورات الرئيسية الأخيرة في السوق:
في سبتمبر 2021، أعلنت شركة Kent Imaging عن موافقة وزارة الصحة الكندية على برنامج SnapshotNIR V3.0 (KD204) - المتاح الآن للشحن باللغتين الرسميتين. يوفر هذا التحديث تحسينات كبيرة في ميزات تقنية التصوير التي تعمل على تعزيز تقييم الأنسجة في الجروح الحادة والمزمنة.
أجهزة قياس الجروح الرقمية – تقسيم السوق
بناءً على المنتج، ينقسم سوق أجهزة قياس الجروح الرقمية إلى أجهزة قياس الجروح الرقمية التلامسية وأجهزة قياس الجروح الرقمية غير التلامسية. بناءً على نوع الجرح، ينقسم السوق إلى جروح مزمنة وجروح حادة. ينقسم قطاع الجروح المزمنة إلى قرح الضغط (PU) وقرحة القدم السكرية (DFU) وقرحة الساق الوريدية (VLU) وقرحة الشرايين. ينقسم قطاع الجروح الحادة إلى حروق وصدمات وجروح جراحية. بناءً على نوع الجهاز، ينقسم سوق أجهزة قياس الجروح الرقمية إلى أجهزة قياس الجروح ثلاثية الأبعاد وأجهزة قياس بمساعدة الليزر. بناءً على التطبيق، ينقسم سوق أجهزة قياس الجروح الرقمية إلى رعاية الجروح والحفاظ على الأطراف والجراحة الترميمية. ينقسم قطاع رعاية الجروح إلى تروية الدم وعلاج الأكسجين عالي الضغط وقابلية الأنسجة للحياة وغيرها. بناءً على المستخدم النهائي، ينقسم سوق أجهزة قياس الجروح الرقمية إلى المستشفيات والعيادات والمراكز المجتمعية. على أساس الجغرافيا، يتم تقسيم السوق بشكل أساسي إلى أمريكا الشمالية وأوروبا ومنطقة آسيا والمحيط الهادئ والشرق الأوسط وأفريقيا وأمريكا الجنوبية والوسطى.
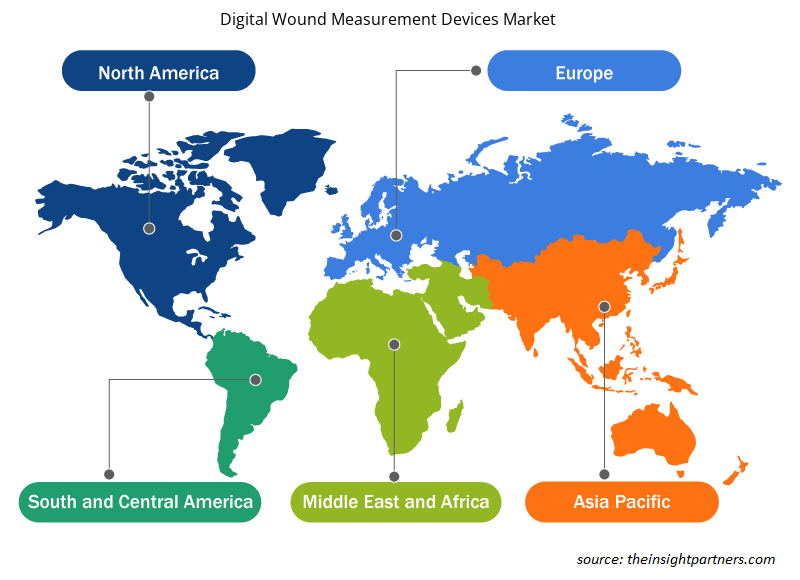
رؤى إقليمية حول سوق أجهزة قياس الجروح الرقمية
لقد قام المحللون في Insight Partners بشرح الاتجاهات والعوامل الإقليمية المؤثرة على سوق أجهزة قياس الجروح الرقمية طوال فترة التوقعات بشكل شامل. يناقش هذا القسم أيضًا قطاعات سوق أجهزة قياس الجروح الرقمية والجغرافيا في جميع أنحاء أمريكا الشمالية وأوروبا ومنطقة آسيا والمحيط الهادئ والشرق الأوسط وأفريقيا وأمريكا الجنوبية والوسطى.
- احصل على البيانات الإقليمية المحددة لسوق أجهزة قياس الجروح الرقمية
نطاق تقرير سوق أجهزة قياس الجروح الرقمية
| سمة التقرير | تفاصيل |
|---|---|
| حجم السوق في عام 2021 | 161.69 مليون دولار أمريكي |
| حجم السوق بحلول عام 2028 | 223.31 مليون دولار أمريكي |
| معدل النمو السنوي المركب العالمي (2021 - 2028) | 4.7% |
| البيانات التاريخية | 2019-2020 |
| فترة التنبؤ | 2022-2028 |
| القطاعات المغطاة | حسب المنتج
|
| المناطق والدول المغطاة | أمريكا الشمالية
|
| قادة السوق وملفات تعريف الشركات الرئيسية |
|
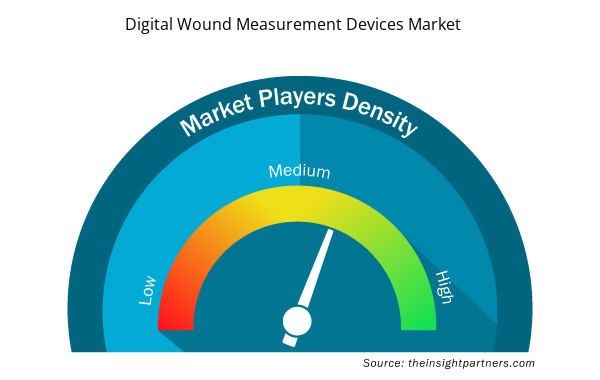
كثافة اللاعبين في سوق أجهزة قياس الجروح الرقمية: فهم تأثيرها على ديناميكيات الأعمال
يشهد سوق أجهزة قياس الجروح الرقمية نموًا سريعًا، مدفوعًا بالطلب المتزايد من المستخدم النهائي بسبب عوامل مثل تفضيلات المستهلك المتطورة والتقدم التكنولوجي والوعي المتزايد بفوائد المنتج. ومع ارتفاع الطلب، تعمل الشركات على توسيع عروضها والابتكار لتلبية احتياجات المستهلكين والاستفادة من الاتجاهات الناشئة، مما يؤدي إلى زيادة نمو السوق.
تشير كثافة اللاعبين في السوق إلى توزيع الشركات أو المؤسسات العاملة في سوق أو صناعة معينة. وهي تشير إلى عدد المنافسين (اللاعبين في السوق) الموجودين في مساحة سوق معينة نسبة إلى حجمها أو قيمتها السوقية الإجمالية.
الشركات الرئيسية العاملة في سوق أجهزة قياس الجروح الرقمية هي:
- شركة إي كير
- شركة كينت للتصوير
- شركة ووند ماتريكس
- الحلول الإدراكية
- رؤية الجرح
إخلاء المسؤولية : الشركات المذكورة أعلاه ليست مرتبة بأي ترتيب معين.
- احصل على نظرة عامة على أهم اللاعبين الرئيسيين في سوق أجهزة قياس الجروح الرقمية
نبذة عن الشركة
- شركة إي كير
- شركة كينت للتصوير
- شركة ووند ماتريكس
- الحلول الإدراكية
- رؤية الجرح
- شركة ارانز الطبية المحدودة
- تحليلات الأنسجة
- شركة فيول 3D تكنولوجيز المحدودة
- شركة هيتاشي الوكا الطبية الأمريكية
- شركة موليكولايت
- التحليل التاريخي (سنتان)، السنة الأساسية، التوقعات (7 سنوات) مع معدل النمو السنوي المركب
- تحليل PEST و SWOT
- حجم السوق والقيمة / الحجم - عالميًا وإقليميًا وقطريًا
- الصناعة والمنافسة
- مجموعة بيانات Excel


Report Coverage
Revenue forecast, Company Analysis, Industry landscape, Growth factors, and Trends

Segment Covered
This text is related
to segments covered.

Regional Scope
North America, Europe, Asia Pacific, Middle East & Africa, South & Central America

Country Scope
This text is related
to country scope.
الأسئلة الشائعة
The Digital Wound Measurement Devices market majorly consists of the players such as eKare, Inc.; Kent Imaging Inc.; WoundMatrix, Inc.; Perceptive Solution; WoundVision; Aranz Medical Limited; Tissue Analytics; Fuel 3D Technologies Limited; Hitachi Aloka Medical America, Inc.; and MolecuLight Inc., among others.
The global Digital Wound Measurement Devices market is segmented by region into North America, Europe, Asia Pacific, Middle East & Africa, and South & Central America. The largest market for digital wound measurement devices is held by the North American region. The United States held the largest market for digital wound measurement devices, and the market is expected to grow due to technological advancements and the presence of key market players of the digital wound measurement devices in the country. The Asia-Pacific region is expected to be the fastest-growing region with an expected CAGR of 5.2% during the forecast period.
The hospitals and clinics segment are expected to be the leading end user in the digital wound measurement devices market with an expected revenue share of 79.07% in 2021.
The factors that are driving the growth of the market are the increasing incidences of wounds & ulcer and growing number of surgical procedures worldwide. Moreover, the elevated healthcare expenditure is expected to provide growth opportunities to the market. The rise in research activities and product innovations expected to be a future trend that will drive the market’s growth in the coming years.
The non-contact digital wound measuring device segment is expected to be the leading product in the digital wound measurement devices market with an expected revenue share of 75.84% in 2021.
Digital wound measurement devices are aids that assist the physicians in monitoring the wounds by measuring, imaging, tracking and documenting the wounds in terms of size and oxygen level and hence help in selecting the ideal treatment for speeding up the process of healing. These devices are able to provide a two- or three-dimensional assessment of the wounds for calculating the change in area of wound over the time for tracing the healing process.
The List of Companies - Digital Wound Measurement Devices Market
- eKare Inc.
- Kent Imaging Inc.
- WoundMatrix Inc.
- Perceptive Solutions
- WoundVision
- Aranz Medical Ltd.
- Tissue Analytics
- Fuel 3D Technologies Ltd.
- Hitachi Aloka Medical America Inc.
- MolecuLight Inc.
The Insight Partners performs research in 4 major stages: Data Collection & Secondary Research, Primary Research, Data Analysis and Data Triangulation & Final Review.
- Data Collection and Secondary Research:
As a market research and consulting firm operating from a decade, we have published and advised several client across the globe. First step for any study will start with an assessment of currently available data and insights from existing reports. Further, historical and current market information is collected from Investor Presentations, Annual Reports, SEC Filings, etc., and other information related to company’s performance and market positioning are gathered from Paid Databases (Factiva, Hoovers, and Reuters) and various other publications available in public domain.
Several associations trade associates, technical forums, institutes, societies and organization are accessed to gain technical as well as market related insights through their publications such as research papers, blogs and press releases related to the studies are referred to get cues about the market. Further, white papers, journals, magazines, and other news articles published in last 3 years are scrutinized and analyzed to understand the current market trends.
- Primary Research:
The primarily interview analysis comprise of data obtained from industry participants interview and answers to survey questions gathered by in-house primary team.
For primary research, interviews are conducted with industry experts/CEOs/Marketing Managers/VPs/Subject Matter Experts from both demand and supply side to get a 360-degree view of the market. The primary team conducts several interviews based on the complexity of the markets to understand the various market trends and dynamics which makes research more credible and precise.
A typical research interview fulfils the following functions:
- Provides first-hand information on the market size, market trends, growth trends, competitive landscape, and outlook
- Validates and strengthens in-house secondary research findings
- Develops the analysis team’s expertise and market understanding
Primary research involves email interactions and telephone interviews for each market, category, segment, and sub-segment across geographies. The participants who typically take part in such a process include, but are not limited to:
- Industry participants: VPs, business development managers, market intelligence managers and national sales managers
- Outside experts: Valuation experts, research analysts and key opinion leaders specializing in the electronics and semiconductor industry.
Below is the breakup of our primary respondents by company, designation, and region:

Once we receive the confirmation from primary research sources or primary respondents, we finalize the base year market estimation and forecast the data as per the macroeconomic and microeconomic factors assessed during data collection.
- Data Analysis:
Once data is validated through both secondary as well as primary respondents, we finalize the market estimations by hypothesis formulation and factor analysis at regional and country level.
- Macro-Economic Factor Analysis:
We analyse macroeconomic indicators such the gross domestic product (GDP), increase in the demand for goods and services across industries, technological advancement, regional economic growth, governmental policies, the influence of COVID-19, PEST analysis, and other aspects. This analysis aids in setting benchmarks for various nations/regions and approximating market splits. Additionally, the general trend of the aforementioned components aid in determining the market's development possibilities.
- Country Level Data:
Various factors that are especially aligned to the country are taken into account to determine the market size for a certain area and country, including the presence of vendors, such as headquarters and offices, the country's GDP, demand patterns, and industry growth. To comprehend the market dynamics for the nation, a number of growth variables, inhibitors, application areas, and current market trends are researched. The aforementioned elements aid in determining the country's overall market's growth potential.
- Company Profile:
The “Table of Contents” is formulated by listing and analyzing more than 25 - 30 companies operating in the market ecosystem across geographies. However, we profile only 10 companies as a standard practice in our syndicate reports. These 10 companies comprise leading, emerging, and regional players. Nonetheless, our analysis is not restricted to the 10 listed companies, we also analyze other companies present in the market to develop a holistic view and understand the prevailing trends. The “Company Profiles” section in the report covers key facts, business description, products & services, financial information, SWOT analysis, and key developments. The financial information presented is extracted from the annual reports and official documents of the publicly listed companies. Upon collecting the information for the sections of respective companies, we verify them via various primary sources and then compile the data in respective company profiles. The company level information helps us in deriving the base number as well as in forecasting the market size.
- Developing Base Number:
Aggregation of sales statistics (2020-2022) and macro-economic factor, and other secondary and primary research insights are utilized to arrive at base number and related market shares for 2022. The data gaps are identified in this step and relevant market data is analyzed, collected from paid primary interviews or databases. On finalizing the base year market size, forecasts are developed on the basis of macro-economic, industry and market growth factors and company level analysis.
- Data Triangulation and Final Review:
The market findings and base year market size calculations are validated from supply as well as demand side. Demand side validations are based on macro-economic factor analysis and benchmarks for respective regions and countries. In case of supply side validations, revenues of major companies are estimated (in case not available) based on industry benchmark, approximate number of employees, product portfolio, and primary interviews revenues are gathered. Further revenue from target product/service segment is assessed to avoid overshooting of market statistics. In case of heavy deviations between supply and demand side values, all thes steps are repeated to achieve synchronization.
We follow an iterative model, wherein we share our research findings with Subject Matter Experts (SME’s) and Key Opinion Leaders (KOLs) until consensus view of the market is not formulated – this model negates any drastic deviation in the opinions of experts. Only validated and universally acceptable research findings are quoted in our reports.
We have important check points that we use to validate our research findings – which we call – data triangulation, where we validate the information, we generate from secondary sources with primary interviews and then we re-validate with our internal data bases and Subject matter experts. This comprehensive model enables us to deliver high quality, reliable data in shortest possible time.
 احصل على عينة مجانية لهذا التقرير