تقرير سوق برمجيات قياس الطيف الكتلي 2027 حسب القطاعات والجغرافيا والديناميكيات والتطورات الأخيرة والرؤى الإستراتيجية
البيانات التاريخية : | سنة الأساس : | فترة التنبؤ :توقعات سوق برمجيات مطيافية الكتلة حتى عام 2027 - تأثير جائحة كوفيد-19 والتحليل العالمي حسب نوع النشر (السحابي والمحلي) والتطبيق (شركات الأدوية، ومنظمات ومؤسسات البحث، وغيرها)
- تاريخ التقرير : Feb 2026
- رمز التقرير : TIPRE00016153
- الفئة : التكنولوجيا والإعلام والاتصالات
- الحالة : قادم
- تنسيقات التقارير المتاحة :


- عدد الصفحات : 150
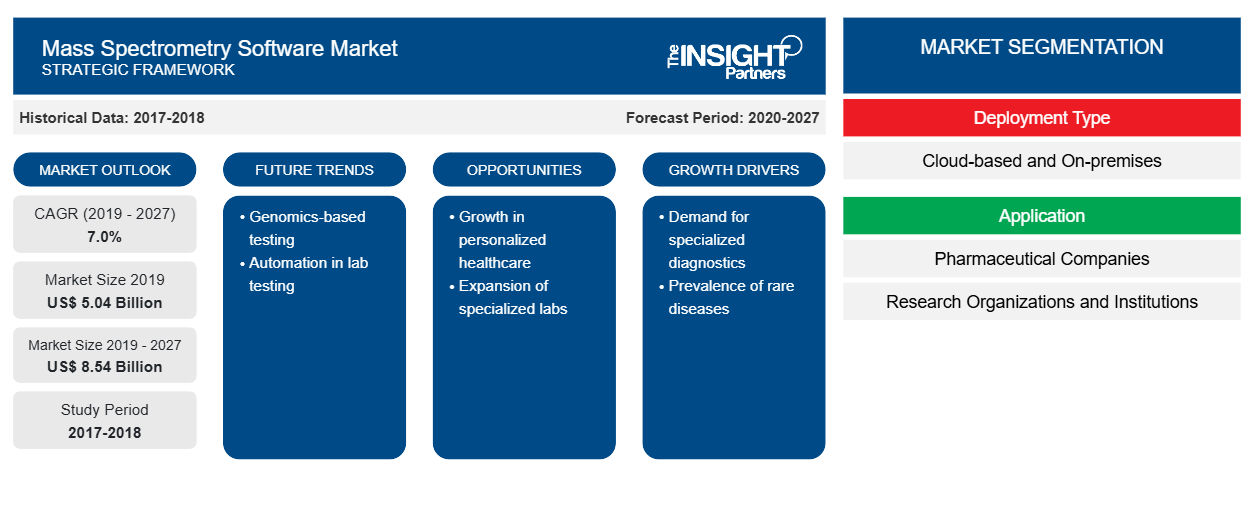
بلغت قيمة سوق برمجيات مطياف الكتلة 5,037.56 مليون دولار أمريكي في عام 2019 ومن المتوقع أن تصل إلى 8,541.36 مليون دولار أمريكي بحلول عام 2027؛ ومن المتوقع أن ينمو بمعدل نمو سنوي مركب قدره 7.0٪ من عام 2020 إلى عام 2027.
تساعد برامج مطياف الكتلة في جمع أدوات وأدوات رقمية مختلفة توفر العديد من الميزات والفوائد لعمليات مطياف الكتلة. تساعد برامج مطياف الكتلة في تحليل البيانات من خلال أدواتها المتخصصة وتساعد في تحديد المؤشرات الحيوية للبروتين وانحرافات البروتين بشكل أفضل. يشمل
نطاق سوق برامج مطياف الكتلة نوع النشر والتطبيق والمنطقة. يتم تحليل سوق برامج مطياف الكتلة بناءً على مناطق مثل أمريكا الشمالية وأوروبا وآسيا والمحيط الهادئ والشرق الأوسط وأفريقيا وأمريكا الجنوبية والوسطى. يقدم التقرير رؤى وتحليلًا متعمقًا لسوق برامج مطياف الكتلة مع التركيز على معايير مختلفة، مثل اتجاهات السوق والتقدم التكنولوجي وديناميكيات السوق وتحليل المشهد التنافسي للاعبين الرئيسيين في السوق في جميع أنحاء العالم.
قم بتخصيص هذا التقرير ليناسب متطلباتك
ستحصل على تخصيص لأي تقرير - مجانًا - بما في ذلك أجزاء من هذا التقرير، أو تحليل على مستوى الدولة، وحزمة بيانات Excel، بالإضافة إلى الاستفادة من العروض والخصومات الرائعة للشركات الناشئة والجامعات
سوق برمجيات مطياف الكتلة: رؤى استراتيجية
-
احصل على أهم اتجاهات السوق الرئيسية لهذا التقرير.ستتضمن هذه العينة المجانية تحليلاً للبيانات، بدءًا من اتجاهات السوق وحتى التقديرات والتوقعات.
رؤى السوق
تزايد تطبيقات علم الجينوم والتحليل البروتيني
لقد أدى التقدم المتزايد في التكنولوجيا إلى تعزيز التطبيقات الجينومية والبروتينية في صناعة التكنولوجيا الحيوية. تعتمد هذه التطبيقات بشكل أساسي على نتائج تحديد الهوية والقياس الكمي القائمة على مطياف الكتلة. وقد سمح دمج تكنولوجيا المعلومات مع التكنولوجيا الحيوية بتلقي قواعد بيانات تسلسل الجينوم تلقائيًا من خلال تحديد ملف تعريف البروتين السريع. كما يوفر فوائد مثل التحليل في الوقت الفعلي لعينات البروتين المتدفقة باستمرار والتي يمكن استخدامها للتطبيقات الطبية.
وقد أدى تزايد استخدام علم الجينوم والبروتينات في الصناعة الطبية لتشخيص وعلاج الأمراض المزمنة إلى زيادة استخدام مطيافية الكتلة. وقد مكّن مطياف الكتلة من اختراع تقنيات علاجية لتصميم علاجات مخصصة لأمراض مثل السرطان والسكري والاضطرابات الوراثية. وقد تلقت العديد من الابتكارات الدعم من المنظمات الحكومية في جميع أنحاء العالم لتعزيز البحث والتطوير في صناعة التكنولوجيا الحيوية. على سبيل المثال، في عام 2006، تعاون المعهد الوطني للسرطان والمعهد الوطني لأبحاث الجينوم البشري لقيادة مبادرات مهمة - مثل أطلس جينوم السرطان - لتطوير أدوية مخصصة لعلم الأورام. وبموجب البرنامج، تمت الموافقة على حوالي 47 دواء من قبل إدارة الغذاء والدواء في عام 2018، ونحو 20 دواء بحلول منتصف عام 2019.
وبالمثل، في عام 2016، تم إطلاق اتحاد البروتيوجينوم السرطاني الدولي (ICPC) لتوفير منصة لمراكز أبحاث السرطان والبروتينات الجينية الرائدة في العالم لتعزيز أبحاثها في مجال الطب الدقيق وتحدياته فيما يتعلق بالسرطان. يتواجد ICPC في 13 دولة تضم 33 معهدًا و11 عضوًا في اتحاد تحليل الأورام البروتينية السريرية. يؤدي زيادة البحث أو تطبيق البروتيوجينوم في الصناعة الطبية إلى زيادة الطلب على مطيافية الكتلة الآلية. بالإضافة إلى ذلك، يزداد الطلب على برامج مطيافية الكتلة من قبل العديد من المعاهد الأكاديمية وكذلك شركات الأدوية والمستحضرات الصيدلانية الحيوية لتعزيز أنشطتها البحثية وتطوير الأدوية. وبالتالي، من المتوقع أن تؤدي زيادة تطبيقات الجينوميات والبروتينات إلى دفع السوق خلال فترة التنبؤ.
رؤى تعتمد على نوع النشر
بناءً على نوع النشر، يتم تقسيم سوق برامج قياس الطيف الكتلي إلى برامج قائمة على السحابة وبرامج محلية. استحوذت البرامج القائمة على السحابة على أكبر حصة في السوق في عام 2019. كما يُقدر أن تسجل البرامج القائمة على السحابة أعلى معدل نمو سنوي مركب في السوق خلال فترة التوقعات بسبب سهولة الوصول إلى البيانات من أي مكان وفي أي وقت. بالإضافة إلى ذلك، توفر مستويات عالية من الأمان وقابلية التوسع وإمكانية الوصول والقدرة على تحمل التكاليف وتكاليف الطاقة المنخفضة والنشر السريع. ومن المتوقع أن يؤدي هذا إلى تسريع نمو السوق.
رؤى قائمة على التطبيق
بناءً على التطبيق، يتم تقسيم سوق برامج مطياف الكتلة إلى شركات الأدوية ومنظمات ومؤسسات البحث وغيرها. احتل قطاع شركات الأدوية الحصة الأكبر من السوق في عام 2019. ومن المتوقع أن يسجل نفس القطاع أعلى معدل نمو سنوي مركب في السوق خلال فترة التنبؤ.
تتبنى الشركات عادة استراتيجيات غير عضوية، مثل الشراكات والاندماج والاستحواذ، لتلبية الطلب المتغير للعملاء في جميع أنحاء العالم، وهو ما يسمح أيضًا للاعبين بالحفاظ على اسم علامتهم التجارية عالميًا. كما تبنى اللاعبون في السوق العاملون في سوق برمجيات مطياف الكتلة استراتيجيات عضوية، مثل إطلاق المنتجات والتوسع، لتوسيع نطاق بصمتهم ومحفظة منتجاتهم في جميع أنحاء العالم وكذلك لتلبية الطلب المتزايد.
رؤى إقليمية حول سوق برامج قياس الطيف الكتلي
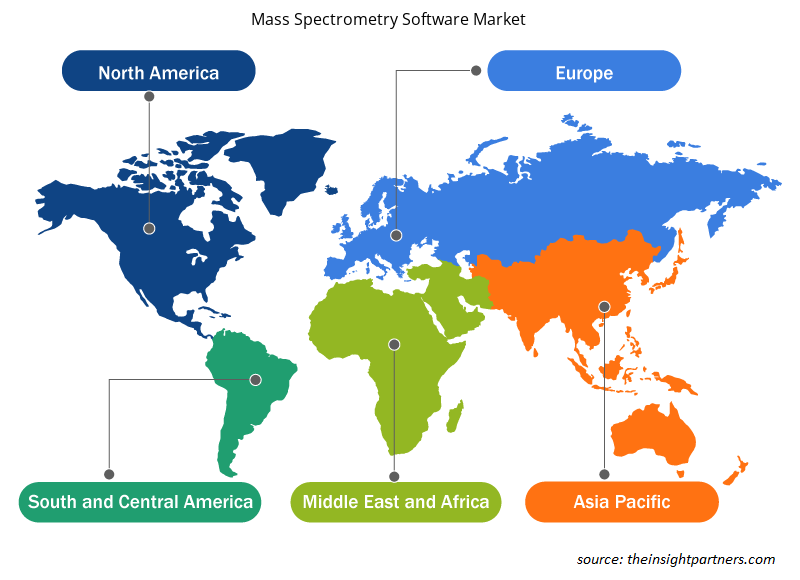
لقد قام المحللون في Insight Partners بشرح الاتجاهات والعوامل الإقليمية المؤثرة على سوق برامج قياس الطيف الكتلي طوال فترة التوقعات بشكل شامل. يناقش هذا القسم أيضًا قطاعات سوق برامج قياس الطيف الكتلي والجغرافيا في جميع أنحاء أمريكا الشمالية وأوروبا ومنطقة آسيا والمحيط الهادئ والشرق الأوسط وأفريقيا وأمريكا الجنوبية والوسطى.
- احصل على البيانات الإقليمية المحددة لسوق برامج قياس الطيف الكتلي
نطاق تقرير سوق برامج مطياف الكتلة
| سمة التقرير | تفاصيل |
|---|---|
| حجم السوق في عام 2019 | 5.04 مليار دولار أمريكي |
| حجم السوق بحلول عام 2027 | 8.54 مليار دولار أمريكي |
| معدل النمو السنوي المركب العالمي (2019 - 2027) | 7.0% |
| البيانات التاريخية | 2017-2018 |
| فترة التنبؤ | 2020-2027 |
| القطاعات المغطاة |
حسب نوع النشر
|
| المناطق والدول المغطاة |
أمريكا الشمالية
|
| قادة السوق وملفات تعريف الشركات الرئيسية |
|
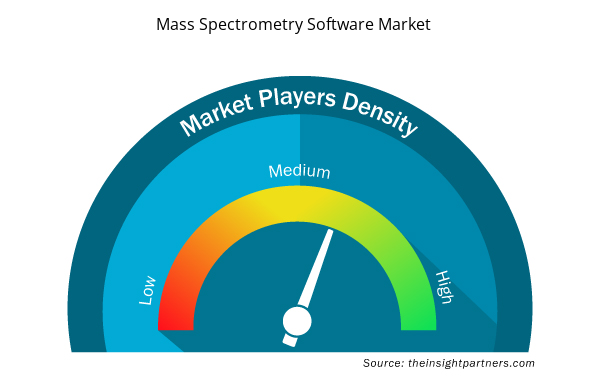
كثافة اللاعبين في سوق برمجيات مطياف الكتلة: فهم تأثيرها على ديناميكيات الأعمال
يشهد سوق برامج قياس الطيف الكتلي نموًا سريعًا، مدفوعًا بالطلب المتزايد من المستخدم النهائي بسبب عوامل مثل تفضيلات المستهلك المتطورة والتقدم التكنولوجي والوعي المتزايد بفوائد المنتج. ومع ارتفاع الطلب، تعمل الشركات على توسيع عروضها والابتكار لتلبية احتياجات المستهلكين والاستفادة من الاتجاهات الناشئة، مما يؤدي إلى زيادة نمو السوق.
تشير كثافة اللاعبين في السوق إلى توزيع الشركات أو المؤسسات العاملة في سوق أو صناعة معينة. وهي تشير إلى عدد المنافسين (اللاعبين في السوق) الموجودين في مساحة سوق معينة نسبة إلى حجمها أو قيمتها السوقية الإجمالية.
الشركات الرئيسية العاملة في سوق برمجيات مطياف الكتلة هي:
- شركة ووترز
- شركة ثيرمو فيشر العلمية
- شركة اجيلنت للتكنولوجيا
- شركة سايكس (داناهير كوربوريشن)
- تطوير الكيمياء المتقدمة
إخلاء المسؤولية : الشركات المذكورة أعلاه ليست مرتبة بأي ترتيب معين.
- احصل على نظرة عامة على أهم اللاعبين الرئيسيين في سوق برامج قياس الطيف الكتلي
حسب نوع النشر
- مبني على السحابة
- في الموقع
حسب الطلب
- شركات الأدوية
- المنظمات والمؤسسات البحثية
- آحرون
بواسطة
الجغرافيا
-
أمريكا الشمالية
- نحن
- كندا
- المكسيك
-
أوروبا
- فرنسا
- ألمانيا
- إيطاليا
- المملكة المتحدة
- روسيا
- بقية أوروبا
-
آسيا والمحيط الهادئ (APAC)
- الصين
- الهند
- كوريا الجنوبية
- اليابان
- أستراليا
- بقية منطقة آسيا والمحيط الهادئ
-
الشرق الأوسط وأفريقيا
- جنوب أفريقيا
- المملكة العربية السعودية
- الامارات العربية المتحدة
- باقي منطقة الشرق الأوسط وأفريقيا
-
أمريكا الجنوبية والوسطى (SCAM)
- البرازيل
- الأرجنتين
- بقية الاحتيال
نبذة عن الشركة
- شركة المياه
- شركة ثيرمو فيشر العلمية
- شركة اجيلنت للتكنولوجيا
- شركة سايكس (داناهير كوربوريشن)
- تطوير الكيمياء المتقدمة
- بروكر
- حلول أدابتاس
- شركة سبكترال ووركس المحدودة
- شركة شيمادزو للأجهزة العلمية
- شركة بيركين إلمر

أنكيتا خبيرة ديناميكية في أبحاث السوق والاستشارات، تتمتع بخبرة تزيد عن 8 سنوات في قطاعات التكنولوجيا والإعلام وتكنولوجيا المعلومات والاتصالات والإلكترونيات وأشباه الموصلات. وقد قادت ونفذت بنجاح أكثر من 100 مهمة استشارية وبحثية لعملاء عالميين مثل مايكروسوفت وأوراكل وشركة NEC وSAP وKPMG وExpeditors International. تشمل كفاءاتها الأساسية تقييم السوق، وتحليل البيانات، والتنبؤ، وصياغة الاستراتيجيات، والاستخبارات التنافسية، وكتابة التقارير.
أنكيتا بارعة في إدارة دورات المشاريع الكاملة، بدءًا من تصميم عروض ما قبل البيع ومناقشات العملاء، وصولًا إلى تقديم رؤى عملية بعد البيع. كما أنها ماهرة في إدارة فرق متعددة الوظائف، وهيكلة وحدات بحثية معقدة، ومواءمة الحلول مع أهداف العمل الخاصة بالعملاء. وقد مكنتها مهاراتها الممتازة في التواصل والقيادة والعرض التقديمي من تحقيق نتائج قيّمة باستمرار في بيئات سوقية سريعة التطور.
- التحليل التاريخي (سنتان)، سنة الأساس، التوقعات (7 سنوات) مع معدل النمو السنوي المركب
- تحليل PEST و SWOT
- حجم السوق والقيمة / الحجم - عالمي، إقليمي، بلد
- الصناعة والمنافسة
- مجموعة بيانات إكسل
شهادات العملاء
تقرير سوق أنظمة SCADA من Insight Partners شامل، ويقدم رؤى قيّمة حول الاتجاهات الحالية والتوقعات المستقبلية. تميّز الفريق باحترافية عالية وسرعة في الاستجابة ودعم مستمر طوال الوقت. نحن راضون جدًا ونوصي بشدة بخدماتهم.
ران كيديم شريك, شركة ريالي تكنولوجيز المحدودةطلبتُ تقريرًا عن سوق برمجيات محدد، وأعدّه الفريق في غضون أيام قليلة. كانت المعلومات ذات صلة وثيقة وعرضها جيد. ثم طلبتُ بعض التعديلات والإضافات على التقرير. وكان الفريق متجاوبًا للغاية، وحصلتُ على التقرير النهائي في أقل من أسبوع.
جان هيرفيه جين رئيس مجلس الإدارة, فيوتشر أناليتيكاعملنا مع شركة "إنسايت بارتنرز" لإجراء دراسة سوقية وتوقعات مهمة. زودونا برؤى واضحة حول الفرص والمخاطر، مما ساعدنا في صياغة خططنا. كانت أبحاثهم سهلة الاستخدام ومبنية على بيانات دقيقة، مما ساعدنا على اتخاذ قرارات ذكية وواثقة. نوصي بهم بشدة.
بيوش ناجبال نائب الرئيس الأول, شعاع عالي عالميقدّمت شركة Insight Partners أبحاثًا سوقية ثاقبة ومنظمة جيدًا بخبرة واسعة في هذا المجال. تميّز فريقهم بالاحترافية وسرعة الاستجابة طوال الوقت. وسهّل موقعهم الإلكتروني سهل الاستخدام الوصول إلى تقارير القطاع. نوصي بهم بشدة لخدمات بحثية موثوقة وعالية الجودة.
يوكيهيكو أداتشي المدير التنفيذي, ديب بلو، ذ.م.م.هذه أول مرة أشتري فيها تقرير سوق من The Insight Partners. رغم أنني كنت مترددًا في البداية، إلا أنني زرت موقعهم الإلكتروني وشعرت براحة أكبر للمخاطرة وشراء تقرير السوق. أنا راضٍ تمامًا عن جودة التقرير وخدمة العملاء. كانت لديّ عدة أسئلة وتعليقات حول التقرير الأولي، ولكن بعد بضع محادثات عبر البريد الإلكتروني مع محللهم، أعتقد أن لديّ تقريرًا يمكنني استخدامه كمدخل لعملية التخطيط الاستراتيجي لدينا. شكرًا جزيلاً لكم على تخصيص وقتكم الإضافي وجعل هذه التجربة إيجابية. سأوصي بخدماتكم للآخرين بالتأكيد، وستكونون أول من ألجأ إليه عندما نحتاج إلى المزيد من بيانات السوق.
جون سوزوكي الرئيس والرئيس التنفيذي وعضو مجلس الإدارة, بي كيه تكنولوجيزأود أن أقدّر دعمكم واحترافيتكم في الاستجابة لطلبي للحصول على معلومات بشأن سوق التشخيص المخبري للأمراض المعدية في نيجيريا. كما أُقدّر صبركم وتوجيهكم، واستعدادكم لتقديم خصم، مما مكّننا في النهاية من إتمام الصفقة. أتطلع إلى التعامل مع "ذا إنسايت بارتنرز" مستقبلًا، كل ذلك بفضل الانطباع الذي تركتموه لديّ نتيجةً لهذا اللقاء الأول.
الدكتور تشيجيوك أونيا المدير الإداري, شركة باينكريست للرعاية الصحية المحدودةسبب الشراء
- اتخاذ قرارات مدروسة
- فهم ديناميكيات السوق
- تحليل المنافسة
- رؤى العملاء
- توقعات السوق
- تخفيف المخاطر
- التخطيط الاستراتيجي
- مبررات الاستثمار
- تحديد الأسواق الناشئة
- تحسين استراتيجيات التسويق
- تعزيز الكفاءة التشغيلية
- مواكبة التوجهات التنظيمية


 احصل على عينة مجانية ل - سوق برمجيات مطياف الكتلة