نظرة عامة على سوق أنظمة إدارة بيانات العدادات، النمو، الاتجاهات، التحليل، تقرير البحث (2025-2031)
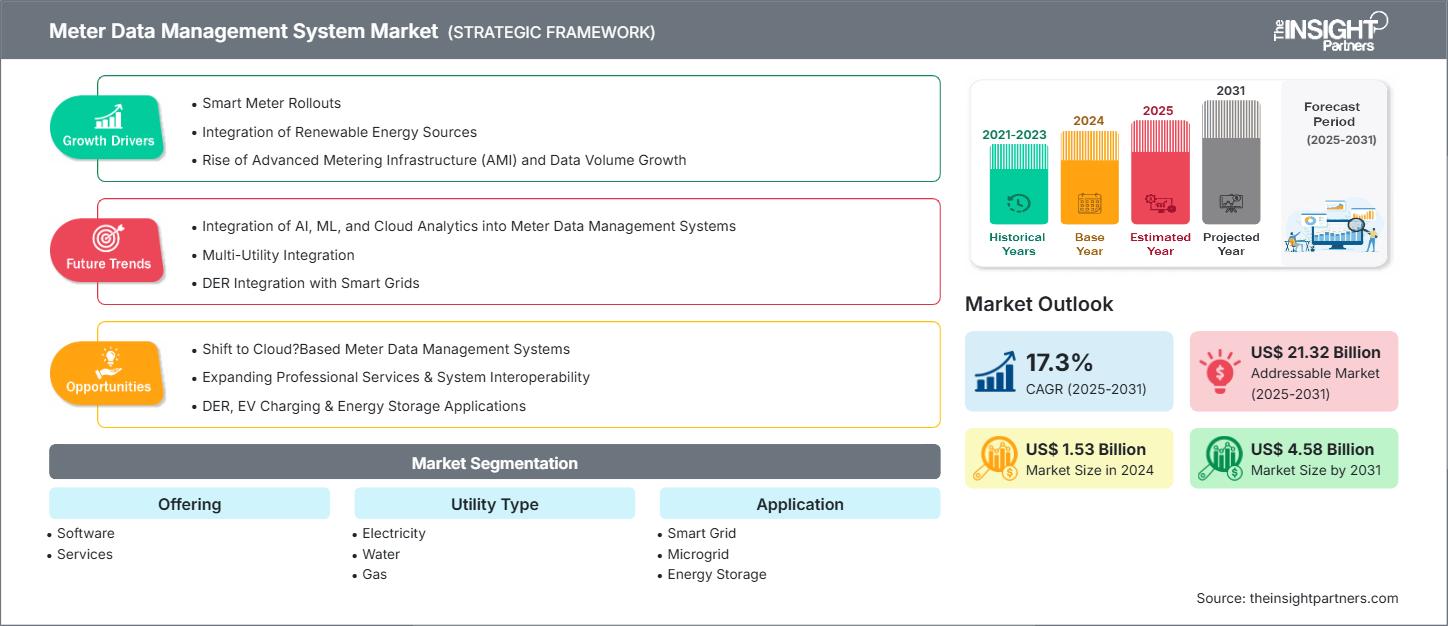
البيانات التاريخية : 2021-2023 | سنة الأساس : 2024 | فترة التنبؤ : 2025-2031حجم سوق أنظمة إدارة بيانات العدادات وتوقعاتها (2021-2031)، والحصة العالمية والإقليمية، والاتجاهات، وفرص النمو. يغطي التقرير: حسب العرض (البرمجيات والخدمات)، ونوع المرافق (الكهرباء، والمياه، والغاز)، والتطبيق (الشبكة الذكية، والشبكات الصغيرة، وتخزين الطاقة، وشحن المركبات الكهربائية، وغيرها)، والمستخدمين النهائيين (السكني، والتجاري، والصناعي)، والجغرافيا (أمريكا الشمالية، وأوروبا، وآسيا والمحيط الهادئ، والشرق الأوسط وأفريقيا، وأمريكا الجنوبية والوسطى).
- تاريخ التقرير : Sep 2025
- رمز التقرير : TIPRE00006169
- الفئة : التكنولوجيا والإعلام والاتصالات
- الحالة : نُشرت
- تنسيقات التقارير المتاحة :


- عدد الصفحات : 264
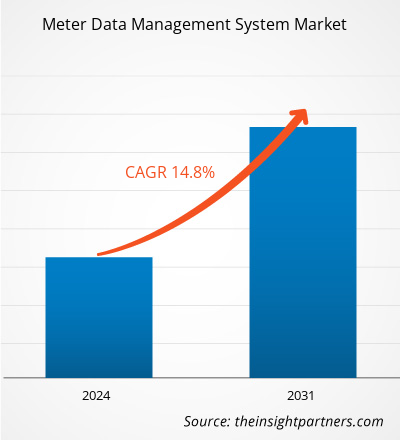
من المتوقع أن يصل حجم سوق نظام إدارة بيانات العدادات إلى 4.58 مليار دولار أمريكي بحلول عام 2031 من 1.53 مليار دولار أمريكي في عام 2024. ومن المتوقع أن يسجل السوق معدل نمو سنوي مركب بنسبة 17.3٪ خلال الفترة 2025-2031.
تحليل سوق نظام إدارة بيانات العدادات
هناك عدة عوامل رئيسية وراء نمو سوق أنظمة إدارة بيانات العدادات العالمية، مثل الانتشار الواسع للعدادات الذكية، وتكامل مصادر الطاقة النظيفة، وظهور البنية التحتية المتقدمة للقياس ( AMI )، وزيادة أحجام البيانات، والمبادرات الحكومية. ومن المرجح أن يستمر نمو السوق خلال فترة التوقعات، مدعومًا بالتحول إلى حلول إدارة بيانات العدادات السحابية، والجهود المتواصلة لتحقيق استدامة الطاقة. ومن أهم الاتجاهات المؤثرة على السوق صعود حلول إدارة بيانات العدادات القائمة على الذكاء الاصطناعي. ومع ذلك، قد تُبطئ مشكلات مثل تقلب بيانات القياس نمو السوق.
نظرة عامة على سوق نظام إدارة بيانات العدادات
تظل أنظمة إدارة بيانات العدادات ( MDMS ) ضرورية لمؤسسات المرافق التي تعمل في قطاعات الكهرباء والغاز والمياه والطاقة الحرارية. تتيح هذه الأنظمة جمع بيانات العدادات والتحقق منها وإدارتها من مباني العملاء. تشكل البيانات المجمعة أساسًا لمجموعة واسعة من الأنشطة، بما في ذلك الفوترة وخدمة العملاء وتوقع الاستهلاك والمراقبة التشغيلية ( مثل اكتشاف الانقطاعات وتحليل الخسائر) والتقارير المالية. علاوة على ذلك، خارج قطاع المرافق، تُستخدم حلول نظام إدارة بيانات العدادات من قبل شركات خدمات الطاقة لعمليات التدقيق وبرامج توفير الطاقة؛ وشركات إدارة الطاقة لإعداد تقارير الاستهلاك وتحليلها؛ ومنتجي الطاقة المستقلين وموردي الطاقة المحليين لتخطيط الإنتاج والهندسة؛ والمؤسسات التجارية والصناعية للمحاسبة الداخلية والإدارة المالية. كما تستخدم البلديات والهيئات الحكومية هذه الأنظمة في برامج البنية التحتية العامة وجهود الامتثال التنظيمي.
ستحصل على تخصيص لأي تقرير - مجانًا - بما في ذلك أجزاء من هذا التقرير، أو تحليل على مستوى الدولة، وحزمة بيانات Excel، بالإضافة إلى الاستفادة من العروض والخصومات الرائعة للشركات الناشئة والجامعات
سوق نظام إدارة بيانات العدادات: رؤى استراتيجية
-
احصل على أهم اتجاهات السوق الرئيسية من هذا التقرير.ستتضمن هذه العينة المجانية تحليل البيانات، بدءًا من اتجاهات السوق وحتى التقديرات والتوقعات.
محركات وفرص سوق نظام إدارة بيانات العدادات
محركات السوق:
-
العداد الذكيطرح :
أحد الأسباب الرئيسية وراء سوق نظام إدارة بيانات العدادات هو طرح العدادات الذكية على نطاق واسع الهائل للعدادات الذكية في جميع أنحاء العالم، والتي يتم تنفيذها من قبل الحكومات استجابة للمطالب التنظيمية وتحديث البنية التحتية. -
دمج مصادر الطاقة المتجددة:
أصبحت منصات إدارة بيانات العدادات أكثر أهمية في قطاع الطاقة الحالي. وتعمل هذه المنصات أساسًا كبرنامج لرسم خرائط نظام المعلومات الجغرافية ( GIS )، حيث تلتقط البيانات رباعية الأبعاد (س، ص، ع، والوقت) لقراءات البنية التحتية للعدادات الذكية ( AMI ) ، وتتحقق منها، وتجميعها، وتحليلها . -
صعود البنية التحتية المتقدمة للقياس ( AMI) ) ونمو حجم البيانات:
إن أحد العوامل الرئيسية التي تشكل السوق العالمية لأنظمة إدارة بيانات العدادات هو النشر السريع للبنية التحتية المتقدمة للقياس ( AMI ).
فرص السوق:
-
توسيع نطاق النشر المستند إلى السحابة:
يوفر الاستخدام المتزايد للبنية التحتية السحابية حلول MDMS قابلة للتطوير وبأسعار معقولة أكثر للمرافق العامة، والتي تعتمد إلى حد كبير على الحاجة إلى النشر المستند إلى السحابة. -
توسيع الخدمات المهنية وقابلية التشغيل البيني للنظام:
إن التعقيد المتزايد للبنى التحتية لأنظمة إدارة الأجهزة المحمولة هو السبب الرئيسي وراء الطلب المتزايد على خدمات الاستشارة والتكامل والصيانة مع التركيز بشكل خاص على تكامل أنظمة معلومات العملاء وإدارة مصادر الطاقة الموزعة. -
تطبيقات DER وشحن السيارات الكهربائية وتخزين الطاقة:
لقد أدى ظهور الشبكات الصغيرة وشحن المركبات الكهربائية وتخزين الطاقة إلى فتح آفاق جديدة لتطوير وحدات MDMS المتخصصة والحلول المخصصة.
تقرير تحليل تجزئة سوق نظام إدارة بيانات العدادات
يُقسّم سوق أنظمة إدارة بيانات العدادات إلى قطاعات مختلفة لإعطاء صورة أوضح عن آلية عمله، وإمكانات نموه، وأحدث التوجهات. فيما يلي منهجية التقسيم القياسية المستخدمة في معظم تقارير القطاع:
من خلال العرض:
-
برمجة:
يعد المكون البرمجي لأنظمة إدارة بيانات العدادات هو الأساس الذي يمكّن المرافق الذكية من جمع وتخزين ومعالجة وتحليل كميات هائلة من البيانات التي تولدها العدادات الذكية. -
خدمات:
تشمل الخدمات المرتبطة بأنظمة إدارة بيانات العدادات عروضًا متنوعة ضرورية لضمان نجاح نشرها وإدارة دورة حياتها. وتشمل هذه الخدمات أنشطة ما قبل النشر، مثل تحليل المتطلبات، والاستشارات، وتصميم البنية، تليها تكامل النظام، واختباره، ونشره.
حسب نوع الأداة المساعدة:
-
كهرباء:
تهيمن شركات المرافق الكهربائية على سوق نظام إدارة بيانات العدادات في المقام الأول بسبب الطرح الواسع النطاق للعدادات الكهربائية الذكية. -
ماء:
يتم توسيع جزء مرافق المياه من نظام إدارة بيانات العداد (MDMS) للسماح للمرافق بتحديث البنية التحتية القديمة التي تواجه مشاكل مختلفة مثل نقص المياه والتسرب والمياه غير المدرة للدخل (NRW). -
الغاز:
يُسهم نظام إدارة الغاز (MDMS) في قطاع الغاز في تعزيز السلامة ودقة الفوترة وتلبية متطلبات الجهات التنظيمية. تُوفر عدادات الغاز الذكية بيانات الاستهلاك ومعدلات التدفق ومستويات الضغط اللازمة لتشغيل النظام بأمان وكفاءة.
حسب التطبيق:
-
الشبكة الذكية:
يعد قطاع تطبيق الشبكة الذكية هو الاستخدام الأساسي والأكثر نضجًا لأنظمة إدارة بيانات العدادات. -
الشبكة الصغيرة:
الشبكات الصغيرة هي شبكات محلية تعمل بشكل مستقل أو بالاشتراك مع شبكة المرافق الأساسية. -
تخزين الطاقة:
تسهل أنظمة إدارة بيانات العدادات التتبع الدقيق لدورات شحن/تفريغ البطارية، ومعدل نقل الطاقة، وحالة الصحة (SoH)، وتكامل إشارات الشبكة. -
شحن السيارات الكهربائية:
يفرض شحن المركبات الكهربائية تحديات وفرصًا جديدة لمشغلي الشبكة. -
آحرون:
وتظهر تطبيقات أخرى لأنظمة إدارة بيانات العدادات في مجالات مثل إدارة الطاقة في المباني، والتدفئة المركزية، وتجارة الطاقة بين الأقران، وبرامج كفاءة الطاقة.
حسب صناعة المستخدم النهائي:
- سكني
- تجاري
- صناعي
لكل قطاع متطلبات خاصة لنظام إدارة بيانات العدادات، مما يؤثر على إدارة البيانات وتحليلها.
حسب الجغرافيا:
- أمريكا الشمالية
- أوروبا
- آسيا والمحيط الهادئ
- أمريكا الجنوبية والوسطى
- الشرق الأوسط وأفريقيا
من المتوقع أن يشهد سوق أنظمة إدارة بيانات العدادات في منطقة آسيا والمحيط الهادئ أسرع نمو. ومن المرجح أن يُسهم دمج مصادر الطاقة المتجددة وتطور أنظمة القياس المتقدمة في دفع عجلة السوق.
رؤى إقليمية حول سوق نظام إدارة بيانات العدادات
قام محللو شركة The Insight Partners بشرح شامل للاتجاهات والعوامل الإقليمية المؤثرة في سوق أنظمة إدارة بيانات العدادات خلال فترة التوقعات. كما يناقش هذا القسم قطاعات سوق أنظمة إدارة بيانات العدادات ونطاقها الجغرافي في أمريكا الشمالية، وأوروبا، وآسيا والمحيط الهادئ، والشرق الأوسط وأفريقيا، وأمريكا الجنوبية والوسطى.
نطاق تقرير سوق نظام إدارة بيانات العدادات
| سمة التقرير | تفاصيل |
|---|---|
| حجم السوق في عام 2024 | 1.53 مليار دولار أمريكي |
| حجم السوق بحلول عام 2031 | 4.58 مليار دولار أمريكي |
| معدل النمو السنوي المركب العالمي (2025 - 2031) | 17.3% |
| البيانات التاريخية | 2021-2023 |
| فترة التنبؤ | 2025-2031 |
| القطاعات المغطاة |
عن طريق العرض
|
| المناطق والبلدان المغطاة |
أمريكا الشمالية
|
| قادة السوق وملفات تعريف الشركات الرئيسية |
|
كثافة اللاعبين في سوق نظام إدارة بيانات العدادات: فهم تأثيرها على ديناميكيات الأعمال
يشهد سوق أنظمة إدارة بيانات العدادات نموًا سريعًا، مدفوعًا بتزايد طلب المستخدمين النهائيين نتيجةً لعوامل مثل تطور تفضيلات المستهلكين، والتقدم التكنولوجي، وزيادة الوعي بمزايا المنتج. ومع تزايد الطلب، تعمل الشركات على توسيع عروضها، والابتكار لتلبية احتياجات المستهلكين، والاستفادة من الاتجاهات الناشئة، مما يعزز نمو السوق.
- احصل على نظرة عامة على أهم اللاعبين الرئيسيين في سوق نظام إدارة بيانات العدادات
تحليل حصة سوق نظام إدارة بيانات العدادات حسب المنطقة الجغرافية
من المتوقع أن يشهد سوق آسيا والمحيط الهادئ أسرع نمو خلال السنوات القليلة المقبلة. كما تزخر الأسواق الناشئة في أمريكا الجنوبية والوسطى والشرق الأوسط وأفريقيا بالعديد من الفرص غير المستغلة لتوسعة مزودي أنظمة إدارة بيانات العدادات.
يختلف سوق أنظمة إدارة بيانات العدادات باختلاف المنطقة. وتتأثر أنماط النمو الإقليمية المختلفة بعوامل مثل تطبيق العدادات الذكية، واستخدام مصادر الطاقة المتجددة، وزيادة البنية التحتية المتقدمة للقياس (AMI) وحجم البيانات. فيما يلي ملخص لحصة السوق واتجاهاتها في مختلف المناطق:
1. أمريكا الشمالية
-
الحصة السوقية:
تتمتع بحصة مهيمنة بسبب التطبيق المبكر وتحديث المرافق -
العوامل الرئيسية:
- استثمارات الشبكة الذكية
- تفويضات كفاءة الطاقة على المستوى الفيدرالي ومستوى الولاية
- انتشار واسع للعدادات الذكية
-
الاتجاهات:
دمج نظام إدارة موارد الطاقة الموزعة (DERMS) مع أنظمة إدارة موارد الطاقة الموزعة (DERMS) لتحقيق التوازن في الشبكة في الوقت الفعلي
2. أوروبا
-
الحصة السوقية:
حصة كبيرة مدعومة بلوائح الطاقة الصارمة وأهداف الاستدامة -
العوامل الرئيسية:
- توجيهات الاتحاد الأوروبي بشأن كفاءة الطاقة
- تكامل الطاقة المتجددة
- دعم منصات بيانات الطاقة عبر الحدود
-
الاتجاهات:
النمو في أنظمة إدارة الأجهزة المحمولة المستندة إلى السحابة يتماشى مع أطر التحول الرقمي في الاتحاد الأوروبي
3. آسيا والمحيط الهادئ
-
الحصة السوقية:
المنطقة الأسرع نموًا مع مبادرات كبيرة لنشر الشبكات الذكية -
العوامل الرئيسية:
- برامج المرافق الرقمية التي تقودها الحكومة
- التوسع الحضري وتطورات المدن الذكية
- مخاوف بشأن موثوقية الشبكة
-
الاتجاهات:
زيادة في أنظمة إدارة الأجهزة المحمولة المدعومة بالذكاء الاصطناعي لإدارة حجم البيانات المرتفع والتنبؤ بالطلب
4. أمريكا الجنوبية والوسطى
-
الحصة السوقية:
سوق ناشئة مع استثمارات متزايدة في تحديث المرافق -
العوامل الرئيسية:
- ترقيات البنية التحتية القديمة
- الكهربة في المناطق النائية
- مشاريع الطاقة المتجددة الإقليمية
-
الاتجاهات:
تفضيل منصات MDMS المعيارية لاستيعاب التبني التدريجي للعدادات الذكية
5. الشرق الأوسط وأفريقيا
-
الحصة السوقية:
سوق متنامية بدعم حكومي قوي -
العوامل الرئيسية:
- خطط تنويع الطاقة الوطنية
- مشاريع ربط المياه بالطاقة
- إصلاحات المدن الذكية والمرافق
-
الاتجاهات:
نشر أنظمة إدارة الطاقة الرقمية في الشبكات الهجينة التي تجمع بين مصادر الطاقة التقليدية والمتجددة
كثافة اللاعبين في سوق نظام إدارة بيانات العدادات: فهم تأثيرها على ديناميكيات الأعمال
كثافة السوق العالية والمنافسة
تشتد المنافسة مع وجود موردين رئيسيين مثل أوراكل، وسيمنز، وإيترون، ولانديس+جير، وشنايدر إلكتريك. كما تساهم شركات إقليمية ومتخصصة مثل كامستروب (أوروبا)، وأكلارا (أمريكا الشمالية)، ومجموعة واسيون (آسيا) في ازدحام السوق.
تدفع هذه البيئة التنافسية البائعين إلى التمايز من خلال:
- التكامل مع الشبكة الذكية وأنظمة الطاقة المتجددة
- منصات MDMS قابلة للتطوير ومبنية على السحابة
- تحليلات البيانات المدعومة بالذكاء الاصطناعي للتنبؤ بالحمل واكتشاف الأخطاء
- التوافق التشغيلي مع أنظمة القياس متعددة البائعين
الفرص والتحركات الاستراتيجية
- التعاون مع شركات المرافق والحكومات لنشر العدادات الذكية على مستوى البلاد
- دمج الذكاء الاصطناعي والتعلم الآلي لتعزيز تحليلات الصيانة التنبؤية والاستهلاك
الشركات الرئيسية العاملة في سوق نظام إدارة بيانات العدادات هي:
- شركة ايترون – الولايات المتحدة
- شركة أوراكل – الولايات المتحدة
- مجموعة جينتراك – نيوزيلندا
- شركة فلوينتغريد المحدودة – الهند
- شركة سيمنز أيه جي – ألمانيا
- مجموعة لانديس+جير إيه جي – سويسرا
- شركة هانيويل الدولية – الولايات المتحدة
- شركة هابيل – الولايات المتحدة
- شركة ABB المحدودة – سويسرا
- مجموعة أفيفا بي إل سي – المملكة المتحدة
إخلاء المسؤولية: الشركات المذكورة أعلاه ليست مرتبة بأي ترتيب معين.
الشركات الأخرى التي تم تحليلها أثناء البحث:
- كوكولوس زونوس
- سمارت فليكس
- كونيكسو إنسايت
- نظام مراقبة الطاقة ATLAS
- نظام PI (AVEVA)
- Net@Suite (هندسة الهندسة المعلوماتية)
- تيرانوفا تام إم دي إم
- فيرانتي ميكومس
- إنيرجي ووركس
- ساب
- حلول ميديداتا
- إنترنت الأشياء الراديكس
- إنرجيكاب
- خادم هانيويل EI
- إيتون
أخبار سوق نظام إدارة بيانات العدادات والتطورات الأخيرة
-
أعلنت شركة إيسياسوفت عن تأسيس مشروع مشترك مع شركة أداني للطاقة
لتنفيذ مشاريع العدادات الذكية في الهند ودول أخرى. تتضمن هذه الشراكة استحواذ أداني على حصة 49% في قسم حلول العدادات الذكية التابع لشركة إيسياسوفت. -
أعلنت شركة لانديس+جير عن حصولها على شهادة MDUS
لمنصة Landis+Gyr MDMS. يتيح تجديد هذه الشهادة لعملاء المرافق الذين يستخدمون خدمات تكامل MDUS الوصول إلى ميزات جديدة للفوترة على فترات زمنية محددة. يُعد نظام MDUS (توحيد ومزامنة بيانات العدادات) من لانديس+جير حلاً فريدًا يُمكّن عمليات الأعمال الشاملة من خلال ربط ومزامنة أنظمة القياس الذكية مع أنظمة المكاتب الخلفية للمرافق.
تقرير سوق نظام إدارة بيانات العدادات - التغطية والنتائج
يقدم تقرير "حجم سوق نظام إدارة بيانات العدادات وتوقعاته (2021-2031)" تحليلاً مفصلاً للسوق يغطي المجالات التالية:
- حجم سوق نظام إدارة بيانات العدادات وتوقعاته على المستويات العالمية والإقليمية والوطنية لجميع قطاعات السوق الرئيسية التي يغطيها النطاق
- اتجاهات سوق نظام إدارة بيانات العدادات، بالإضافة إلى ديناميكيات السوق مثل العوامل المحركة والقيود والفرص الرئيسية
- تحليل مفصل لـ PEST و SWOT
- تحليل سوق نظام إدارة بيانات العدادات يغطي اتجاهات السوق الرئيسية والإطار العالمي والإقليمي والجهات الفاعلة الرئيسية واللوائح والتطورات الأخيرة في السوق
- تحليل المشهد الصناعي والمنافسة الذي يغطي تركيز السوق، وتحليل خريطة الحرارة، واللاعبين البارزين، والتطورات الأخيرة لسوق نظام إدارة بيانات العدادات
- ملفات تعريف الشركة التفصيلية

أنكيتا خبيرة ديناميكية في أبحاث السوق والاستشارات، تتمتع بخبرة تزيد عن 8 سنوات في قطاعات التكنولوجيا والإعلام وتكنولوجيا المعلومات والاتصالات والإلكترونيات وأشباه الموصلات. وقد قادت ونفذت بنجاح أكثر من 100 مهمة استشارية وبحثية لعملاء عالميين مثل مايكروسوفت وأوراكل وشركة NEC وSAP وKPMG وExpeditors International. تشمل كفاءاتها الأساسية تقييم السوق، وتحليل البيانات، والتنبؤ، وصياغة الاستراتيجيات، والاستخبارات التنافسية، وكتابة التقارير.
أنكيتا بارعة في إدارة دورات المشاريع الكاملة، بدءًا من تصميم عروض ما قبل البيع ومناقشات العملاء، وصولًا إلى تقديم رؤى عملية بعد البيع. كما أنها ماهرة في إدارة فرق متعددة الوظائف، وهيكلة وحدات بحثية معقدة، ومواءمة الحلول مع أهداف العمل الخاصة بالعملاء. وقد مكنتها مهاراتها الممتازة في التواصل والقيادة والعرض التقديمي من تحقيق نتائج قيّمة باستمرار في بيئات سوقية سريعة التطور.
- التحليل التاريخي (سنتان)، سنة الأساس، التوقعات (7 سنوات) مع معدل النمو السنوي المركب
- تحليل PEST و SWOT
- حجم السوق والقيمة / الحجم - عالمي، إقليمي، بلد
- الصناعة والمنافسة
- مجموعة بيانات إكسل
التقارير الحديثة
تقارير ذات صلة
شهادات العملاء
تقرير سوق أنظمة SCADA من Insight Partners شامل، ويقدم رؤى قيّمة حول الاتجاهات الحالية والتوقعات المستقبلية. تميّز الفريق باحترافية عالية وسرعة في الاستجابة ودعم مستمر طوال الوقت. نحن راضون جدًا ونوصي بشدة بخدماتهم.
ران كيديم شريك, شركة ريالي تكنولوجيز المحدودةطلبتُ تقريرًا عن سوق برمجيات محدد، وأعدّه الفريق في غضون أيام قليلة. كانت المعلومات ذات صلة وثيقة وعرضها جيد. ثم طلبتُ بعض التعديلات والإضافات على التقرير. وكان الفريق متجاوبًا للغاية، وحصلتُ على التقرير النهائي في أقل من أسبوع.
جان هيرفيه جين رئيس مجلس الإدارة, فيوتشر أناليتيكاعملنا مع شركة "إنسايت بارتنرز" لإجراء دراسة سوقية وتوقعات مهمة. زودونا برؤى واضحة حول الفرص والمخاطر، مما ساعدنا في صياغة خططنا. كانت أبحاثهم سهلة الاستخدام ومبنية على بيانات دقيقة، مما ساعدنا على اتخاذ قرارات ذكية وواثقة. نوصي بهم بشدة.
بيوش ناجبال نائب الرئيس الأول, شعاع عالي عالميقدّمت شركة Insight Partners أبحاثًا سوقية ثاقبة ومنظمة جيدًا بخبرة واسعة في هذا المجال. تميّز فريقهم بالاحترافية وسرعة الاستجابة طوال الوقت. وسهّل موقعهم الإلكتروني سهل الاستخدام الوصول إلى تقارير القطاع. نوصي بهم بشدة لخدمات بحثية موثوقة وعالية الجودة.
يوكيهيكو أداتشي المدير التنفيذي, ديب بلو، ذ.م.م.هذه أول مرة أشتري فيها تقرير سوق من The Insight Partners. رغم أنني كنت مترددًا في البداية، إلا أنني زرت موقعهم الإلكتروني وشعرت براحة أكبر للمخاطرة وشراء تقرير السوق. أنا راضٍ تمامًا عن جودة التقرير وخدمة العملاء. كانت لديّ عدة أسئلة وتعليقات حول التقرير الأولي، ولكن بعد بضع محادثات عبر البريد الإلكتروني مع محللهم، أعتقد أن لديّ تقريرًا يمكنني استخدامه كمدخل لعملية التخطيط الاستراتيجي لدينا. شكرًا جزيلاً لكم على تخصيص وقتكم الإضافي وجعل هذه التجربة إيجابية. سأوصي بخدماتكم للآخرين بالتأكيد، وستكونون أول من ألجأ إليه عندما نحتاج إلى المزيد من بيانات السوق.
جون سوزوكي الرئيس والرئيس التنفيذي وعضو مجلس الإدارة, بي كيه تكنولوجيزأود أن أقدّر دعمكم واحترافيتكم في الاستجابة لطلبي للحصول على معلومات بشأن سوق التشخيص المخبري للأمراض المعدية في نيجيريا. كما أُقدّر صبركم وتوجيهكم، واستعدادكم لتقديم خصم، مما مكّننا في النهاية من إتمام الصفقة. أتطلع إلى التعامل مع "ذا إنسايت بارتنرز" مستقبلًا، كل ذلك بفضل الانطباع الذي تركتموه لديّ نتيجةً لهذا اللقاء الأول.
الدكتور تشيجيوك أونيا المدير الإداري, شركة باينكريست للرعاية الصحية المحدودةسبب الشراء
- اتخاذ قرارات مدروسة
- فهم ديناميكيات السوق
- تحليل المنافسة
- رؤى العملاء
- توقعات السوق
- تخفيف المخاطر
- التخطيط الاستراتيجي
- مبررات الاستثمار
- تحديد الأسواق الناشئة
- تحسين استراتيجيات التسويق
- تعزيز الكفاءة التشغيلية
- مواكبة التوجهات التنظيمية


 احصل على عينة مجانية ل - سوق نظام إدارة بيانات العدادات