استراتيجيات سوق مواد معالجة التلوث النفطي، وأفضل اللاعبين، وفرص النمو، والتحليل والتنبؤ بحلول عام 2030
البيانات التاريخية : 2020-2021 | سنة الأساس : 2022 | فترة التنبؤ : 2023-2030حجم سوق مواد معالجة التلوث النفطي وتوقعاته (2020-2030)، والحصة العالمية والإقليمية، والاتجاهات، وفرص النمو. يغطي التقرير: حسب النوع [المعالجة الفيزيائية (الرافعات، والمكاشط، والمواد الماصة)، والمعالجة الكيميائية (المشتتات والمصلبات)، والمعالجة الحرارية، والمعالجة الحيوية].
- تاريخ التقرير : Feb 2024
- رمز التقرير : TIPRE00038943
- الفئة : المواد الكيميائية والمواد
- الحالة : نُشرت
- تنسيقات التقارير المتاحة :


- عدد الصفحات : 195
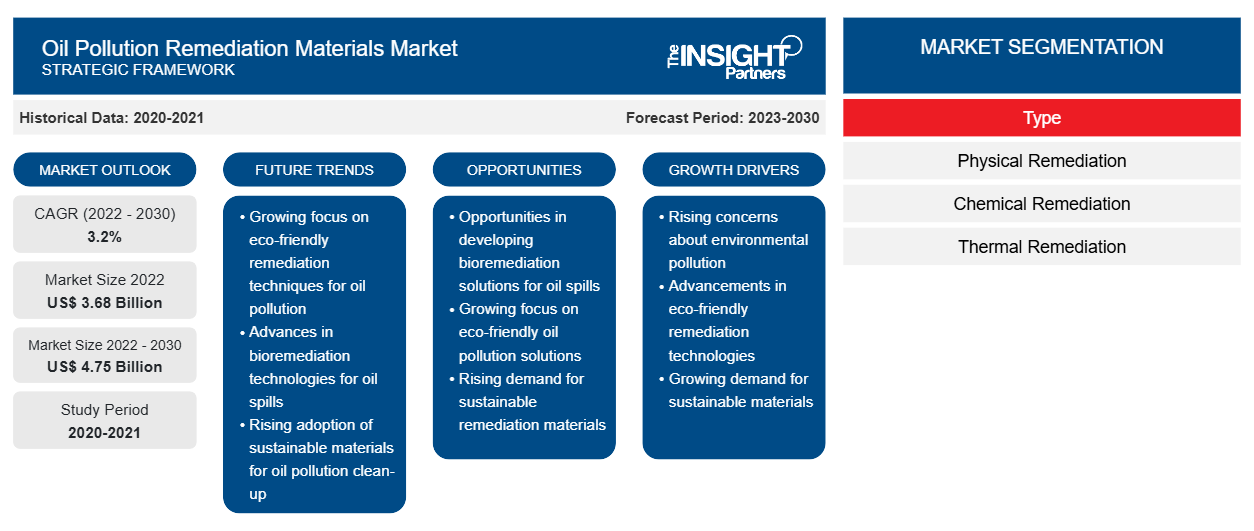
[تقرير بحثي] تم تقييم سوق مواد معالجة التلوث النفطي بـ 3،684.36 مليون دولار أمريكي في عام 2022 ومن المتوقع أن يصل إلى 4،749.56 مليون دولار أمريكي بحلول عام 2030؛ ومن المتوقع أن يسجل معدل نمو سنوي مركب بنسبة 3.2٪ من عام 2022 إلى عام 2030.
تحليل السوق
تُستخدم مواد معالجة التلوث النفطي للحد من المخاطر العالية لتلوث المسطحات المائية بسبب أنشطة التنقيب عن النفط والنقل والأنشطة الصناعية المختلفة التي تجري في جميع أنحاء العالم. يتم تصنيف تقنيات المعالجة بشكل رئيسي إلى المعالجة الفيزيائية والمعالجة الكيميائية والمعالجة الحرارية والمعالجة البيولوجية . تعتبر مهمة للغاية لمعالجة مشاكل الانسكابات النفطية البحرية. تتكون المعالجة الفيزيائية من مواد مثل الرافعات والمزلقات والمواد الماصة. تشمل مواد المعالجة الكيميائية المشتتات والمواد الصلبة .
العوامل الرئيسية التي تدفع نمو سوق مواد معالجة التلوث النفطي هي أنشطة التنقيب عن النفط ونقله في الخارج المتزايدة واللوائح الحكومية المتعلقة بالاستعداد والاستجابة للانسكابات النفطية. في السنوات القليلة الماضية، صممت حكومات مختلف البلدان لوائح تنظيف الانسكابات النفطية لضمان استجابة سريعة وفعالة لحالات الطوارئ البيئية. تحدد هذه اللوائح عادةً الإجراءات والتقنيات والمعايير التي يجب على الشركات اتباعها لاحتواء الانسكابات النفطية والسيطرة عليها وتنظيفها. غالبًا ما تنص اللوائح على نوع مواد المعالجة التي يجب استخدامها لتقليل التأثير البيئي وضمان التنظيف الفعال. إن الحاجة المتزايدة إلى تنظيف فعال للانسكابات النفطية تدفع الطلب على مواد المعالجة.
مع تكثيف المخاوف واللوائح البيئية، هناك تركيز متزايد على استخدام مواد متقدمة وصديقة للبيئة للإصلاح. قد يتم إلزام بعض المواد الماصة والمشتتات والحواجز بالوفاء بمعايير السلامة والفعالية، مما يعزز استخدام المواد الصديقة للبيئة والفعالة في جهود الاستجابة للانسكاب النفطي. لدى الحكومات وصناعة النفط خطط استعداد لإجراء استجابة منتظمة للانسكاب النفطي. أدت تفويضات الحكومة بمعالجة الانسكابات النفطية على الفور وتقليل التأثير البيئي إلى زيادة الطلب على المواد الماصة والمشتتات ومواد الإصلاح الأخرى. في عام 2023، عززت وكالة حماية البيئة الأمريكية المعايير لتحسين استجابات الانسكابات النفطية في المياه الأمريكية والشواطئ المجاورة بموجب خطة الطوارئ الوطنية للحكومة الفيدرالية ( NCP ). تتضمن المعايير تطوير منتجات فعالة لإصلاح الانسكابات النفطية، مثل العوامل الكيميائية والبيولوجية، وتوفير الشفافية والمعلومات المتعلقة باستخدام هذه المنتجات.
إن زيادة أنشطة الاستكشاف والحفر البحرية، ونقل النفط عبر خطوط الأنابيب أو الناقلات، والأخطاء البشرية أثناء استخراج النفط وتخزينه، كلها عوامل تزيد من احتمالات وقوع حوادث تسرب النفط. ووفقًا لوكالة الطاقة الدولية، انتعش الطلب العالمي على النفط في عام 2021، ومن المتوقع أن تمثل آسيا 77٪ من الطلب على النفط بحلول عام 2025. ومن المتوقع أن تتجاوز متطلبات استيراد النفط في آسيا 31 مليون برميل يوميًا بحلول عام 2025. وقد بدأت حكومات دول مختلفة في منطقة آسيا والمحيط الهادئ مشاريع نفطية لتلبية الطلب المتزايد على النفط في المنطقة. في عام 2023، أعلنت شركة بتروناس ومقاولو الترتيبات البترولية التابعة لها عن 19 اكتشافًا للتنقيب عن النفط والغاز ونجاحين في تقييم الاستكشاف، مما ساهم في أكثر من مليار برميل من المكافئ النفطي من الموارد الجديدة لماليزيا. وهذا نتيجة لبرنامج استكشاف مكثف تم تنفيذه في السنوات القليلة الماضية، والذي شهد حفر 25 بئرًا. ومنذ عام 2015، يعد هذا أعلى عدد من آبار الاستكشاف التي تم حفرها في عام واحد.
محركات النمو والتحديات
وفقًا لتقرير صادر عن إدارة معلومات الطاقة الأمريكية في يناير 2024، زاد إنتاج النفط الخام منذ جائحة كوفيد-19 اعتبارًا من 9 يناير 2024، مما عكس انخفاضًا دام عامين. ارتفع إنتاج النفط الخام الأمريكي من 11.27 مليون برميل يوميًا في عام 2021 إلى 13.21 مليون برميل يوميًا في عام 2023 ومن المتوقع أن يصل إلى 13.44 مليون برميل يوميًا بحلول عام 2024. وفقًا لهيئة تنظيم الطاقة الكندية، يتم شحن معظم النفط الخام المنتج في كندا باستخدام خطوط الأنابيب من المقاطعات الغربية إلى المصافي في الولايات المتحدة وأونتاريو وكيبيك. وفقًا للتقرير الذي نشرته Bruegel AISBL في عام 2023، كانت روسيا من بين أكبر خمسة منتجين ومستهلكين للطاقة في جميع أنحاء العالم في عام 2021. خلال نفس العام، أنتجت 595.2 مليون طن متري من النفط الخام، تم تصدير 286.6 مليون طن متري منها. وهكذا، فإن أنشطة التنقيب عن النفط البحري ونقله المتزايدة هي المحرك لسوق مواد معالجة التلوث النفطي.
قم بتخصيص هذا التقرير ليناسب متطلباتك
ستحصل على تخصيص لأي تقرير - مجانًا - بما في ذلك أجزاء من هذا التقرير، أو تحليل على مستوى الدولة، وحزمة بيانات Excel، بالإضافة إلى الاستفادة من العروض والخصومات الرائعة للشركات الناشئة والجامعات
سوق مواد معالجة التلوث النفطي: رؤى استراتيجية
-
احصل على أهم اتجاهات السوق الرئيسية لهذا التقرير.ستتضمن هذه العينة المجانية تحليلاً للبيانات، بدءًا من اتجاهات السوق وحتى التقديرات والتوقعات.
رؤى إقليمية حول سوق مواد معالجة التلوث النفطي
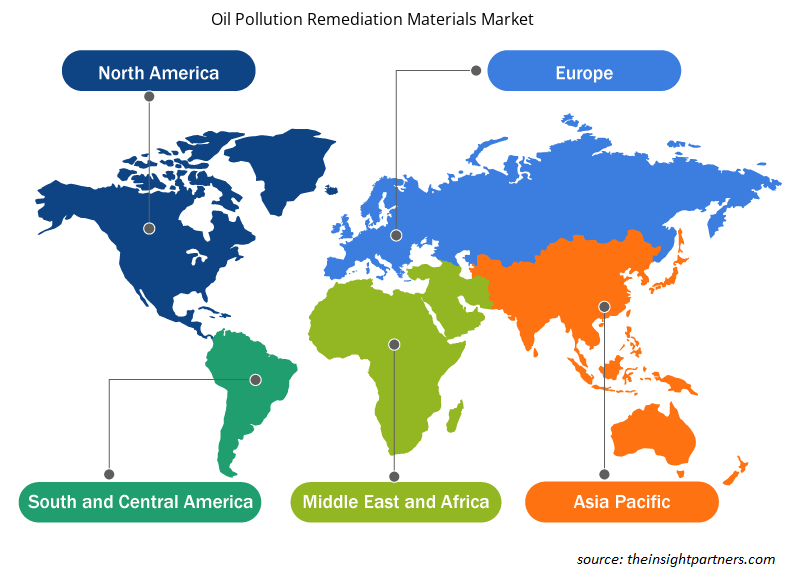
لقد قام المحللون في Insight Partners بشرح الاتجاهات والعوامل الإقليمية المؤثرة على سوق مواد معالجة التلوث النفطي طوال فترة التوقعات بشكل شامل. يناقش هذا القسم أيضًا قطاعات سوق مواد معالجة التلوث النفطي والجغرافيا في جميع أنحاء أمريكا الشمالية وأوروبا ومنطقة آسيا والمحيط الهادئ والشرق الأوسط وأفريقيا وأمريكا الجنوبية والوسطى.
- احصل على البيانات الإقليمية المحددة لسوق مواد معالجة التلوث النفطي
نطاق تقرير سوق مواد معالجة التلوث النفطي
| سمة التقرير | تفاصيل |
|---|---|
| حجم السوق في عام 2022 | 3.68 مليار دولار أمريكي |
| حجم السوق بحلول عام 2030 | 4.75 مليار دولار أمريكي |
| معدل النمو السنوي المركب العالمي (2022 - 2030) | 3.2% |
| البيانات التاريخية | 2020-2021 |
| فترة التنبؤ | 2023-2030 |
| القطاعات المغطاة |
حسب النوع
|
| المناطق والدول المغطاة |
أمريكا الشمالية
|
| قادة السوق وملفات تعريف الشركات الرئيسية |
|
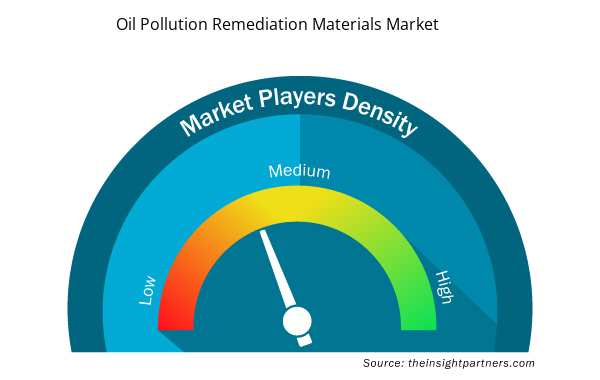
كثافة اللاعبين في سوق مواد معالجة التلوث النفطي: فهم تأثيرها على ديناميكيات الأعمال
يشهد سوق مواد معالجة التلوث النفطي نموًا سريعًا، مدفوعًا بالطلب المتزايد من المستخدم النهائي بسبب عوامل مثل تفضيلات المستهلكين المتطورة والتقدم التكنولوجي والوعي المتزايد بفوائد المنتج. ومع ارتفاع الطلب، تعمل الشركات على توسيع عروضها والابتكار لتلبية احتياجات المستهلكين والاستفادة من الاتجاهات الناشئة، مما يؤدي إلى زيادة نمو السوق.
تشير كثافة اللاعبين في السوق إلى توزيع الشركات أو المؤسسات العاملة في سوق أو صناعة معينة. وهي تشير إلى عدد المنافسين (اللاعبين في السوق) الموجودين في مساحة سوق معينة نسبة إلى حجمها أو قيمتها السوقية الإجمالية.
الشركات الرئيسية العاملة في سوق مواد معالجة التلوث النفطي هي:
- سارفا بيو ريميد ذ.م.م
- شركة تقنيات النفط المحدودة
إخلاء المسؤولية : الشركات المذكورة أعلاه ليست مرتبة بأي ترتيب معين.
- احصل على نظرة عامة على أهم اللاعبين الرئيسيين في سوق مواد معالجة التلوث النفطي
المنافسة والشركات الرئيسية
تعد Sarva Bio Remed LLC وOil Technics Ltd وAnsell Ltd وOil-Dri Corp of America وVerde Environmental Group Ltd وEcolab Inc وCosco Shipping Heavy Industry Co Ltd وRegenesis وTOLSA SA وCL Solutions LLC من بين اللاعبين البارزين الذين تم عرضهم في تقرير سوق مواد معالجة التلوث النفطي. بالإضافة إلى ذلك، تمت دراسة العديد من اللاعبين الآخرين وتحليلهم أثناء الدراسة للحصول على رؤية شاملة للسوق ونظامه البيئي. يتضمن تقرير سوق مواد معالجة التلوث النفطي أيضًا وضع الشركة وتركيزها لتقييم أداء المنافسين/اللاعبين في السوق.
تطورات الصناعة والفرص المستقبلية
وترد أدناه المبادرات التي اتخذها اللاعبون الرئيسيون العاملون في سوق مواد معالجة التلوث النفطي:
في نوفمبر 2022، استثمرت شركة Ansell Ltd حوالي 80 مليون دولار أمريكي في مصنع التصنيع الجديد في الهند.

حابي محلل أبحاث سوق متمرس، يتمتع بخبرة 8 سنوات في قطاع الكيماويات والمواد، بالإضافة إلى خبرته في قطاعي الأغذية والمشروبات والسلع الاستهلاكية. وهو مهندس كيميائي من معهد فيشواكارما للتكنولوجيا (VIT)، وقد اكتسب معرفةً عميقةً في مجالات الكيماويات الصناعية والتخصصية، والدهانات والطلاءات، والورق والتغليف، ومواد التشحيم، والمنتجات الاستهلاكية.
تشمل كفاءات حابي الأساسية تقدير حجم السوق والتنبؤ به، ووضع معايير تنافسية، وتحليل الاتجاهات، والتفاعل مع العملاء، وكتابة التقارير، وتنسيق الفريق، مما يجعله بارعًا في تقديم رؤى عملية ودعم اتخاذ القرارات الاستراتيجية.
- التحليل التاريخي (سنتان)، سنة الأساس، التوقعات (7 سنوات) مع معدل النمو السنوي المركب
- تحليل PEST و SWOT
- حجم السوق والقيمة / الحجم - عالمي، إقليمي، بلد
- الصناعة والمنافسة
- مجموعة بيانات إكسل
التقارير الحديثة
تقارير ذات صلة
شهادات العملاء
تقرير سوق أنظمة SCADA من Insight Partners شامل، ويقدم رؤى قيّمة حول الاتجاهات الحالية والتوقعات المستقبلية. تميّز الفريق باحترافية عالية وسرعة في الاستجابة ودعم مستمر طوال الوقت. نحن راضون جدًا ونوصي بشدة بخدماتهم.
ران كيديم شريك, شركة ريالي تكنولوجيز المحدودةطلبتُ تقريرًا عن سوق برمجيات محدد، وأعدّه الفريق في غضون أيام قليلة. كانت المعلومات ذات صلة وثيقة وعرضها جيد. ثم طلبتُ بعض التعديلات والإضافات على التقرير. وكان الفريق متجاوبًا للغاية، وحصلتُ على التقرير النهائي في أقل من أسبوع.
جان هيرفيه جين رئيس مجلس الإدارة, فيوتشر أناليتيكاعملنا مع شركة "إنسايت بارتنرز" لإجراء دراسة سوقية وتوقعات مهمة. زودونا برؤى واضحة حول الفرص والمخاطر، مما ساعدنا في صياغة خططنا. كانت أبحاثهم سهلة الاستخدام ومبنية على بيانات دقيقة، مما ساعدنا على اتخاذ قرارات ذكية وواثقة. نوصي بهم بشدة.
بيوش ناجبال نائب الرئيس الأول, شعاع عالي عالميقدّمت شركة Insight Partners أبحاثًا سوقية ثاقبة ومنظمة جيدًا بخبرة واسعة في هذا المجال. تميّز فريقهم بالاحترافية وسرعة الاستجابة طوال الوقت. وسهّل موقعهم الإلكتروني سهل الاستخدام الوصول إلى تقارير القطاع. نوصي بهم بشدة لخدمات بحثية موثوقة وعالية الجودة.
يوكيهيكو أداتشي المدير التنفيذي, ديب بلو، ذ.م.م.هذه أول مرة أشتري فيها تقرير سوق من The Insight Partners. رغم أنني كنت مترددًا في البداية، إلا أنني زرت موقعهم الإلكتروني وشعرت براحة أكبر للمخاطرة وشراء تقرير السوق. أنا راضٍ تمامًا عن جودة التقرير وخدمة العملاء. كانت لديّ عدة أسئلة وتعليقات حول التقرير الأولي، ولكن بعد بضع محادثات عبر البريد الإلكتروني مع محللهم، أعتقد أن لديّ تقريرًا يمكنني استخدامه كمدخل لعملية التخطيط الاستراتيجي لدينا. شكرًا جزيلاً لكم على تخصيص وقتكم الإضافي وجعل هذه التجربة إيجابية. سأوصي بخدماتكم للآخرين بالتأكيد، وستكونون أول من ألجأ إليه عندما نحتاج إلى المزيد من بيانات السوق.
جون سوزوكي الرئيس والرئيس التنفيذي وعضو مجلس الإدارة, بي كيه تكنولوجيزأود أن أقدّر دعمكم واحترافيتكم في الاستجابة لطلبي للحصول على معلومات بشأن سوق التشخيص المخبري للأمراض المعدية في نيجيريا. كما أُقدّر صبركم وتوجيهكم، واستعدادكم لتقديم خصم، مما مكّننا في النهاية من إتمام الصفقة. أتطلع إلى التعامل مع "ذا إنسايت بارتنرز" مستقبلًا، كل ذلك بفضل الانطباع الذي تركتموه لديّ نتيجةً لهذا اللقاء الأول.
الدكتور تشيجيوك أونيا المدير الإداري, شركة باينكريست للرعاية الصحية المحدودةسبب الشراء
- اتخاذ قرارات مدروسة
- فهم ديناميكيات السوق
- تحليل المنافسة
- رؤى العملاء
- توقعات السوق
- تخفيف المخاطر
- التخطيط الاستراتيجي
- مبررات الاستثمار
- تحديد الأسواق الناشئة
- تحسين استراتيجيات التسويق
- تعزيز الكفاءة التشغيلية
- مواكبة التوجهات التنظيمية


 احصل على عينة مجانية ل - سوق مواد معالجة التلوث النفطي