سوق البلاستيك للوقود - المحركات والاتجاهات والفرص وإحصاءات النمو | 2031
البيانات التاريخية : 2021-2022 | سنة الأساس : 2023 | فترة التنبؤ : 2024-2031حجم سوق تحويل البلاستيك إلى وقود وتوقعاته (2021-2031)، والحصة العالمية والإقليمية، والاتجاهات، وفرص النمو. يغطي التقرير: حسب التكنولوجيا [التحلل الحراري، والتغويز، وإزالة البلمرة] والمنتج النهائي [النفط الخام، والهيدروجين، وغيرها]، والجغرافيا.
- تاريخ التقرير : Mar 2026
- رمز التقرير : TIPRE00008127
- الفئة : الطاقة والقوة
- الحالة : البيانات الصادرة
- تنسيقات التقارير المتاحة :


- عدد الصفحات : 150
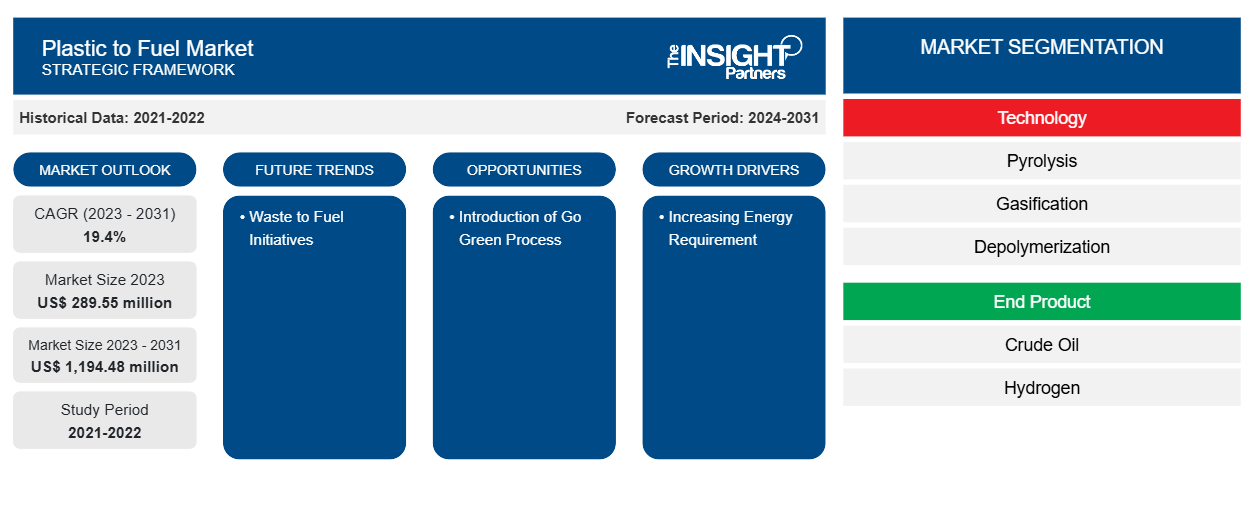
من المتوقع أن يصل حجم سوق تحويل البلاستيك إلى وقود إلى 1,194.48 مليون دولار أمريكي بحلول عام 2031 من 289.55 مليون دولار أمريكي في عام 2023. ومن المتوقع أن يسجل السوق معدل نمو سنوي مركب بنسبة 19.4٪ في الفترة 2023-2031. ومن المرجح أن يظل التطور التقني المستمر في إعادة التدوير والتخلص من النفايات أحد الاتجاهات الرئيسية لسوق تحويل البلاستيك إلى وقود.
تحليل سوق تحويل البلاستيك إلى وقود
من المتوقع أن يؤدي الوعي المتزايد بشأن انبعاثات الغازات المسببة للاحتباس الحراري إلى دفع نمو البلاستيك في سوق الوقود. تشكل البوليمرات غير القابلة لإعادة التدوير مثل البولي إيثيلين تيريفثالات (PET) والبوليسترين وكلوريد البولي فينيل (PVC) مصدر قلق كبير في الوقت الحالي. لا يتم إعادة تدوير أكثر من 90٪ من البلاستيك ويتم التخلص منه أو دفنه أو سكبه في المحيط بدلاً من ذلك. تم جمع وإعادة تدوير 9-10٪ فقط من نفايات البلاستيك، مما يعني أنه تم جمع وإعادة تدوير 9-10٪ فقط من نفايات البلاستيك. يفتح هذا إمكانات سوقية ضخمة لصناعة تحويل البلاستيك إلى وقود حيث أن إعادة تدوير هذه النفايات البلاستيكية ستنتج نفايات بلاستيكية غير قابلة لإعادة التدوير يمكن استخدامها في PFT في المستقبل غير البعيد.
نظرة عامة على سوق تحويل البلاستيك إلى وقود
مع النمو السكاني، والتطور الاقتصادي السريع، والتحضر المستمر، والتغيرات في نمط الحياة، يتزايد إنتاج واستهلاك النفايات البلاستيكية بمعدل مرتفع. كانت النفايات البلاستيكية مصدر قلق متزايد في جميع أنحاء العالم في السنوات الأخيرة. ومع الاعتماد المتزايد على البلاستيك، أصبحت ممارسة التخلص من البلاستيك بتهور تقليدية. تم إنشاء العديد من إجراءات تحويل النفايات إلى ثروة على مر السنين لإعادة تدوير وإعادة استخدام البلاستيك بطرق مبتكرة. يعد تحويل النفايات البلاستيكية إلى وقود وجعلها قابلة للاستخدام للاحتياجات الصناعية والسكنية أحد الابتكارات الحالية. تم تحويل البلاستيك إلى وقود بشكل فعال في وقت سابق في دول مثل ألمانيا والولايات المتحدة واليابان. كانت هذه الدول الثلاث أيضًا فعالة في تحويل إجراءات التحويل إلى نماذج شركات قابلة للتطبيق. وبالمثل، تتبنى دول مثل كندا والهند تدريجيًا عملية تحويل البلاستيك إلى وقود.
قم بتخصيص هذا التقرير ليناسب متطلباتك
ستحصل على تخصيص لأي تقرير - مجانًا - بما في ذلك أجزاء من هذا التقرير، أو تحليل على مستوى الدولة، وحزمة بيانات Excel، بالإضافة إلى الاستفادة من العروض والخصومات الرائعة للشركات الناشئة والجامعات
سوق البلاستيك والوقود: رؤى استراتيجية
-
احصل على أهم اتجاهات السوق الرئيسية لهذا التقرير.ستتضمن هذه العينة المجانية تحليلاً للبيانات، بدءًا من اتجاهات السوق وحتى التقديرات والتوقعات.
محركات وفرص سوق الوقود البلاستيكي
زيادة متطلبات الطاقة تدفع الطلب على تقنيات الوقود البلاستيكي
تلعب الكهرباء دورًا حاسمًا، وهي تشكل نسبة متزايدة من خدمات الطاقة. ومع تزايد الدخل المتاح، ووعي المستهلك، وكهربة وسائل النقل والتدفئة، وزيادة الطلب على الأدوات الرقمية وتكييف الهواء، من المتوقع أن يرتفع الطلب على الطاقة بشكل أكبر. تعمل سياسات الحكومة والتكنولوجيا المتاحة بما يتماشى مع سيناريو السياسات لتحويل إمدادات الطاقة نحو مصادر منخفضة الكربون، مما يعزز الطلب على تكنولوجيا البلاستيك للوقود على مستوى العالم. إن إمكانية الوصول التجاري لمجموعة من تقنيات توليد الانبعاثات المنخفضة تضع الكهرباء في طليعة الجهود المبذولة لمكافحة تغير المناخ والتلوث، مما يزيد من الطلب على الحلول البديلة، مما يؤدي بالتالي إلى توسع سوق البلاستيك للوقود.
مقدمة لعملية التحول إلى الأخضر - فرصة في سوق البلاستيك للوقود
بدأت مبادرات تحويل البلاستيك إلى وقود تكتسب زخماً في صناعة الطاقة مع تزايد وعي الناس بالأضرار البيئية الناجمة عن البلاستيك الذي يستخدم لمرة واحدة وممارسات إعادة التدوير غير الكافية التي يتبعها الناس. وهذا يدفع الباحثين إلى البحث عن طرق مبتكرة للتخلص من الإنتاج المتزايد من البلاستيك. ومن المتوقع أن توفر زيادة الإعانات الحكومية لتطوير التكنولوجيا الخضراء ومحاولات تشجيع مثل هذه التقنيات من خلال التمويل الموسع فرص نمو كبيرة في السوق. وعلاوة على ذلك، فإن اللوائح الحكومية القوية المتعلقة بأمن الطاقة تضغط على الشركات للاستثمار في البحوث الصديقة للبيئة. ويشكل تحويل البلاستيك إلى وقود خياراً واعداً ليس فقط للحد من التلوث ولكن أيضاً لتحقيق فوائد اقتصادية كبيرة للمناطق.
تقرير تحليل تجزئة سوق تحويل البلاستيك إلى وقود
إن القطاعات الرئيسية التي ساهمت في اشتقاق تحليل سوق البلاستيك إلى وقود هي التكنولوجيا والمنتج النهائي.
- استنادًا إلى التكنولوجيا، تم تقسيم سوق تحويل البلاستيك إلى وقود إلى التحلل الحراري والتغويز وإزالة البلمرة. احتل قطاع التحلل الحراري حصة سوقية أكبر في عام 2023.
- من حيث المنتج النهائي، تم تقسيم السوق إلى النفط الخام والهيدروجين وغيرهما. يهيمن قطاع النفط الخام على السوق في عام 2023.
تحليل حصة سوق تحويل البلاستيك إلى وقود حسب المنطقة الجغرافية
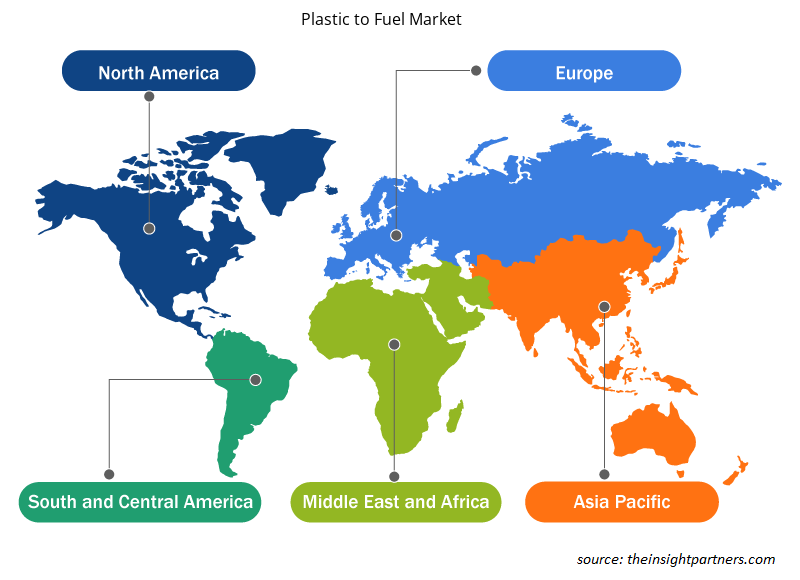
ينقسم النطاق الجغرافي لتقرير سوق البلاستيك إلى وقود بشكل أساسي إلى خمس مناطق: أمريكا الشمالية، وآسيا والمحيط الهادئ، وأوروبا، والشرق الأوسط وأفريقيا، وأمريكا الجنوبية/أمريكا الجنوبية والوسطى.
تضم منطقة آسيا والمحيط الهادئ العديد من البلدان النامية، بما في ذلك الصين والهند. وهما أيضًا أكبر دولتين من حيث عدد السكان في جميع أنحاء العالم. يتم إلقاء هذه النفايات البلاستيكية إما في مكبات النفايات أو المحيط، مما يؤدي إلى ملء البيئة وترك آثار سلبية طويلة الأجل في جميع أنحاء العالم. علاوة على ذلك، تمتلك منطقة آسيا والمحيط الهادئ الحصة الكبرى من تلوث البلاستيك البحري مع مساهمين رئيسيين مثل الصين وإندونيسيا وسريلانكا وفيتنام والفلبين. البنية التحتية غير الفعّالة لإدارة النفايات والافتقار إلى الوعي بشأن التأثير الضار للبلاستيك للاستخدام مرة واحدة هي الأسباب الرئيسية التي تساهم في ارتفاع النفايات البلاستيكية في جميع أنحاء المنطقة. إن الاستثمارات المتزايدة من قبل الحكومات والمنظمات الخاصة لتعزيز إعادة تدوير البلاستيك إلى مواد قابلة لإعادة الاستخدام تدفع نمو سوق البلاستيك للوقود في جميع أنحاء المنطقة. ونظرًا للزيادة في الاستثمارات في إعادة تدوير النفايات البلاستيكية في جميع أنحاء المنطقة، يستثمر اللاعبون في سوق البلاستيك للوقود أيضًا في توسيع أعمالهم في جميع أنحاء المنطقة، مما يدفع نمو سوق البلاستيك للوقود في منطقة آسيا والمحيط الهادئ.
رؤى إقليمية حول سوق تحويل البلاستيك إلى وقود
لقد قام المحللون في Insight Partners بشرح الاتجاهات والعوامل الإقليمية المؤثرة على سوق تحويل البلاستيك إلى وقود طوال فترة التوقعات بشكل شامل. يناقش هذا القسم أيضًا قطاعات سوق تحويل البلاستيك إلى وقود والجغرافيا في جميع أنحاء أمريكا الشمالية وأوروبا ومنطقة آسيا والمحيط الهادئ والشرق الأوسط وأفريقيا وأمريكا الجنوبية والوسطى.
- احصل على البيانات الإقليمية المحددة لسوق تحويل البلاستيك إلى وقود
نطاق تقرير سوق تحويل البلاستيك إلى وقود
| سمة التقرير | تفاصيل |
|---|---|
| حجم السوق في عام 2023 | 289.55 مليون دولار أمريكي |
| حجم السوق بحلول عام 2031 | 1,194.48 مليون دولار أمريكي |
| معدل النمو السنوي المركب العالمي (2023 - 2031) | 19.4% |
| البيانات التاريخية | 2021-2022 |
| فترة التنبؤ | 2024-2031 |
| القطاعات المغطاة |
حسب التكنولوجيا
|
| المناطق والدول المغطاة |
أمريكا الشمالية
|
| قادة السوق وملفات تعريف الشركات الرئيسية |
|
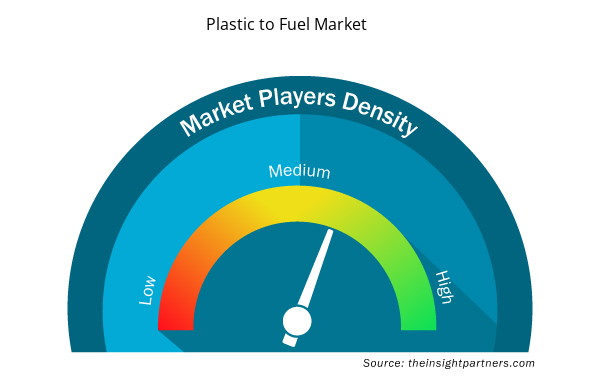
كثافة اللاعبين في السوق: فهم تأثيرها على ديناميكيات الأعمال
يشهد سوق تحويل البلاستيك إلى وقود نموًا سريعًا، مدفوعًا بالطلب المتزايد من المستخدم النهائي بسبب عوامل مثل تفضيلات المستهلكين المتطورة والتقدم التكنولوجي والوعي المتزايد بفوائد المنتج. ومع ارتفاع الطلب، تعمل الشركات على توسيع عروضها والابتكار لتلبية احتياجات المستهلكين والاستفادة من الاتجاهات الناشئة، مما يؤدي إلى زيادة نمو السوق.
تشير كثافة اللاعبين في السوق إلى توزيع الشركات أو المؤسسات العاملة في سوق أو صناعة معينة. وهي تشير إلى عدد المنافسين (اللاعبين في السوق) الموجودين في مساحة سوق معينة نسبة إلى حجمها أو قيمتها السوقية الإجمالية.
الشركات الرئيسية العاملة في سوق تحويل البلاستيك إلى وقود هي:
- أجيليكس، المحدودة
- زيت كاساندرا ايه بي
- شركة كلين للصناعات
- شركة نكسس فيولز المحدودة
- تكنولوجيات إعادة التدوير المحدودة
- شركة أجايل بروسيس للمواد الكيميائية المحدودة
إخلاء المسؤولية : الشركات المذكورة أعلاه ليست مرتبة بأي ترتيب معين.
- احصل على نظرة عامة على أهم اللاعبين الرئيسيين في سوق تحويل البلاستيك إلى وقود
أخبار وتطورات سوق تحويل البلاستيك إلى وقود
يتم تقييم سوق تحويل البلاستيك إلى وقود من خلال جمع البيانات النوعية والكمية بعد البحث الأولي والثانوي، والتي تتضمن منشورات الشركات المهمة وبيانات الجمعيات وقواعد البيانات. فيما يلي قائمة بالتطورات في السوق فيما يتعلق بالابتكارات وتوسيع الأعمال والاستراتيجيات:
- في فبراير 2022، تعاونت Agilyx وVirgin Group في شراكة استراتيجية للبحث والتطوير في مرافق الوقود منخفضة الكربون لدعم معالجة التلوث البلاستيكي ودعم أجندة التحول العالمي إلى صافي صفر. (المصدر: Agilyx, Inc، بيان صحفي/موقع الشركة على الويب/النشرة الإخبارية)
- في نوفمبر 2022، تعاونت شركة Klean Industries مع شركة RGH Systems لتطوير منشأة لتحويل النفايات البلاستيكية إلى طاقة في الفلبين. (المصدر: Klean Industries Inc.، بيان صحفي/موقع الشركة على الويب/النشرة الإخبارية)
تقرير سوق تحويل البلاستيك إلى وقود: التغطية والنتائج المتوقعة
يقدم تقرير "حجم سوق البلاستيك كوقود وتوقعاته (2021-2031)" تحليلاً مفصلاً للسوق يغطي المجالات التالية:
- حجم أسواق البلاستيك والوقود والتوقعات على المستويات العالمية والإقليمية والوطنية لجميع قطاعات السوق الرئيسية التي يغطيها النطاق
- ديناميكيات السوق مثل المحركات والقيود والفرص الرئيسية
- اتجاهات سوق تحويل البلاستيك إلى وقود
- تحليل مفصل لـ PEST و SWOT
- تحليل سوق تحويل البلاستيك إلى وقود يغطي اتجاهات السوق الرئيسية والإطار العالمي والإقليمي والجهات الفاعلة الرئيسية واللوائح والتطورات الأخيرة في السوق
- صناعة البلاستيك والوقود، تحليل المشهد والمنافسة، وتغطية تركيز السوق، وتحليل خريطة الحرارة، واللاعبين البارزين، والتطورات الأخيرة
- ملفات تعريف الشركة التفصيلية

نيفيديتا خبيرة أبحاث مُتميزة، تتمتع بخبرة تزيد عن 9 سنوات في أبحاث السوق واستشارات الأعمال. تشغل حاليًا منصب مديرة مشاريع في مجال تكنولوجيا المعلومات والاتصالات لدى شركة "ذا إنسايت بارتنرز"، وتتمتع بخبرة واسعة في إدارة وتنفيذ مهام الأبحاث المُجمعة والمُخصصة والقائمة على الاشتراكات والاستشارات في مختلف قطاعات التكنولوجيا.
بفضل سجلها الحافل في تقديم تحليلات قائمة على البيانات ورؤى عملية، ساهمت نيفيديتا بشكل رئيسي في العديد من المشاريع الحيوية. يشمل عملها تنفيذ المشاريع من البداية إلى النهاية، بدءًا من فهم أهداف العملاء، وتحليل اتجاهات السوق، وصولًا إلى استخلاص التوصيات الاستراتيجية. وقد تعاونت على نطاق واسع مع شركات رائدة في مجال تكنولوجيا المعلومات والاتصالات، مما ساعدها على تحديد فرص السوق ومواكبة تحولات القطاع.
تحمل نيفيديتا ماجستير إدارة أعمال في الإدارة من شركة "آي إم إس" في دهرادون. قبل انضمامها إلى "ذا إنسايت بارتنرز"، اكتسبت خبرة قيّمة في شركتي "ماركتس آند ماركتس" و"فيوتشر ماركت إنسايتس" في بونا، حيث شغلت مناصب بحثية مُختلفة وبنت أساسًا قويًا في تحليل القطاع والتفاعل مع العملاء.
- التحليل التاريخي (سنتان)، سنة الأساس، التوقعات (7 سنوات) مع معدل النمو السنوي المركب
- تحليل PEST و SWOT
- حجم السوق والقيمة / الحجم - عالمي، إقليمي، بلد
- الصناعة والمنافسة
- مجموعة بيانات إكسل
التقارير الحديثة
تقارير ذات صلة
شهادات العملاء
تقرير سوق أنظمة SCADA من Insight Partners شامل، ويقدم رؤى قيّمة حول الاتجاهات الحالية والتوقعات المستقبلية. تميّز الفريق باحترافية عالية وسرعة في الاستجابة ودعم مستمر طوال الوقت. نحن راضون جدًا ونوصي بشدة بخدماتهم.
ران كيديم شريك, شركة ريالي تكنولوجيز المحدودةطلبتُ تقريرًا عن سوق برمجيات محدد، وأعدّه الفريق في غضون أيام قليلة. كانت المعلومات ذات صلة وثيقة وعرضها جيد. ثم طلبتُ بعض التعديلات والإضافات على التقرير. وكان الفريق متجاوبًا للغاية، وحصلتُ على التقرير النهائي في أقل من أسبوع.
جان هيرفيه جين رئيس مجلس الإدارة, فيوتشر أناليتيكاعملنا مع شركة "إنسايت بارتنرز" لإجراء دراسة سوقية وتوقعات مهمة. زودونا برؤى واضحة حول الفرص والمخاطر، مما ساعدنا في صياغة خططنا. كانت أبحاثهم سهلة الاستخدام ومبنية على بيانات دقيقة، مما ساعدنا على اتخاذ قرارات ذكية وواثقة. نوصي بهم بشدة.
بيوش ناجبال نائب الرئيس الأول, شعاع عالي عالميقدّمت شركة Insight Partners أبحاثًا سوقية ثاقبة ومنظمة جيدًا بخبرة واسعة في هذا المجال. تميّز فريقهم بالاحترافية وسرعة الاستجابة طوال الوقت. وسهّل موقعهم الإلكتروني سهل الاستخدام الوصول إلى تقارير القطاع. نوصي بهم بشدة لخدمات بحثية موثوقة وعالية الجودة.
يوكيهيكو أداتشي المدير التنفيذي, ديب بلو، ذ.م.م.هذه أول مرة أشتري فيها تقرير سوق من The Insight Partners. رغم أنني كنت مترددًا في البداية، إلا أنني زرت موقعهم الإلكتروني وشعرت براحة أكبر للمخاطرة وشراء تقرير السوق. أنا راضٍ تمامًا عن جودة التقرير وخدمة العملاء. كانت لديّ عدة أسئلة وتعليقات حول التقرير الأولي، ولكن بعد بضع محادثات عبر البريد الإلكتروني مع محللهم، أعتقد أن لديّ تقريرًا يمكنني استخدامه كمدخل لعملية التخطيط الاستراتيجي لدينا. شكرًا جزيلاً لكم على تخصيص وقتكم الإضافي وجعل هذه التجربة إيجابية. سأوصي بخدماتكم للآخرين بالتأكيد، وستكونون أول من ألجأ إليه عندما نحتاج إلى المزيد من بيانات السوق.
جون سوزوكي الرئيس والرئيس التنفيذي وعضو مجلس الإدارة, بي كيه تكنولوجيزأود أن أقدّر دعمكم واحترافيتكم في الاستجابة لطلبي للحصول على معلومات بشأن سوق التشخيص المخبري للأمراض المعدية في نيجيريا. كما أُقدّر صبركم وتوجيهكم، واستعدادكم لتقديم خصم، مما مكّننا في النهاية من إتمام الصفقة. أتطلع إلى التعامل مع "ذا إنسايت بارتنرز" مستقبلًا، كل ذلك بفضل الانطباع الذي تركتموه لديّ نتيجةً لهذا اللقاء الأول.
الدكتور تشيجيوك أونيا المدير الإداري, شركة باينكريست للرعاية الصحية المحدودةسبب الشراء
- اتخاذ قرارات مدروسة
- فهم ديناميكيات السوق
- تحليل المنافسة
- رؤى العملاء
- توقعات السوق
- تخفيف المخاطر
- التخطيط الاستراتيجي
- مبررات الاستثمار
- تحديد الأسواق الناشئة
- تحسين استراتيجيات التسويق
- تعزيز الكفاءة التشغيلية
- مواكبة التوجهات التنظيمية


 احصل على عينة مجانية ل - سوق البلاستيك للوقود