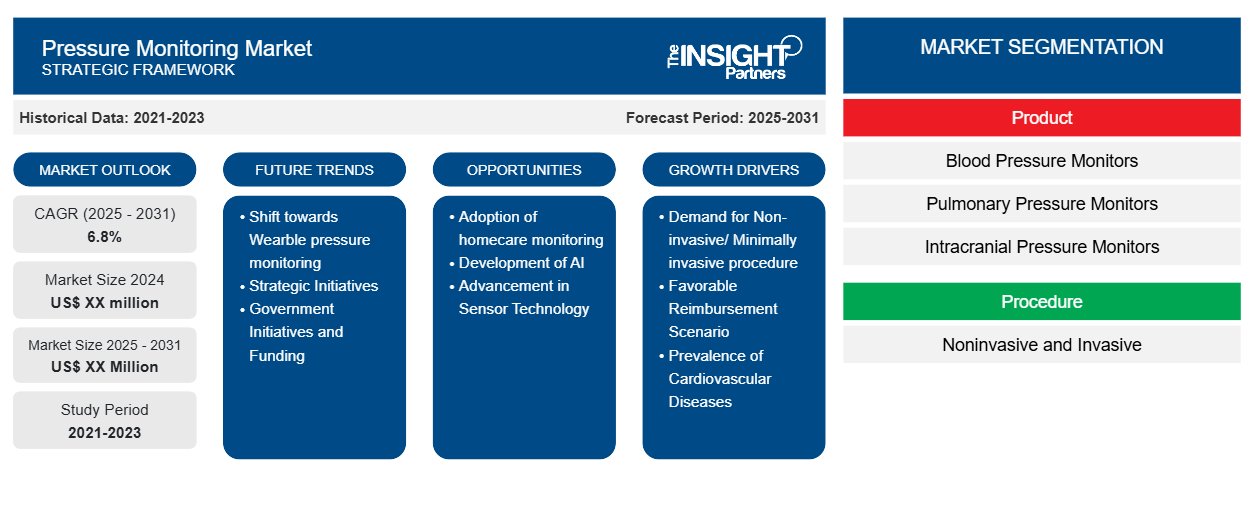
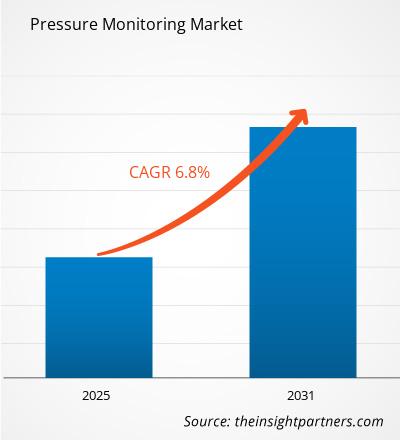
من المتوقع أن يسجل سوق مراقبة الضغط معدل نمو سنوي مركب بنسبة 6.8٪ من عام 2024 إلى عام 2031، مع توسع حجم السوق من XX مليون دولار أمريكي في عام 2024 إلى XX مليون دولار أمريكي بحلول عام 2031.
تم تقسيم التقرير حسب المنتج (أجهزة مراقبة ضغط الدم، وأجهزة مراقبة ضغط الرئة، وأجهزة مراقبة الضغط داخل الجمجمة، وأجهزة مراقبة ضغط العين، والملحقات، وأجهزة مراقبة الضغط الأخرى). كما يقدم التقرير تحليلًا يعتمد على الإجراء (غير جراحي وجراحي). كما تم تقسيم التقرير حسب التطبيق (اضطرابات الجهاز التنفسي، واضطرابات القلب، والجلوكوما، والاضطرابات العصبية، وغيرها). علاوة على ذلك، تم تقسيم السوق على أساس المستخدم النهائي (المستشفيات، والرعاية المنزلية، ومراكز وعيادات الجراحة الخارجية، ومختبرات التشخيص). تم تقسيم التحليل العالمي بشكل أكبر على المستوى الإقليمي والدول الرئيسية. يقدم التقرير القيمة بالدولار الأمريكي للتحليل والشرائح المذكورة أعلاه.
غرض التقرير
يهدف تقرير سوق مراقبة الضغط الصادر عن The Insight Partners إلى وصف المشهد الحالي والنمو المستقبلي وأهم العوامل الدافعة والتحديات والفرص. سيوفر هذا رؤى لمختلف أصحاب المصلحة في الأعمال التجارية، مثل:
- مزودي/مصنعي التكنولوجيا: لفهم ديناميكيات السوق المتطورة ومعرفة فرص النمو المحتملة، وتمكينهم من اتخاذ قرارات استراتيجية مستنيرة.
- المستثمرون: إجراء تحليل شامل للاتجاهات فيما يتعلق بمعدل نمو السوق، وتوقعات السوق المالية، والفرص المتاحة عبر سلسلة القيمة.
- الهيئات التنظيمية: لتنظيم السياسات ومراقبة الأنشطة في السوق بهدف تقليل الانتهاكات والحفاظ على ثقة المستثمرين ودعم سلامة السوق واستقرارها.
تجزئة سوق مراقبة الضغط
منتج
- أجهزة قياس ضغط الدم
- أجهزة مراقبة ضغط الرئة
- أجهزة مراقبة الضغط داخل الجمجمة
- أجهزة مراقبة ضغط العين
- مُكَمِّلات
- أجهزة مراقبة الضغط الأخرى
إجراء
- غير جراحي وجراحي
طلب
- اضطرابات الجهاز التنفسي
- اضطرابات القلب
- الجلوكوما
- الاضطرابات العصبية
- آحرون
المستخدم النهائي
- المستشفيات
- الرعاية المنزلية
- مراكز وعيادات الجراحة الخارجية
- المختبرات التشخيصية
قم بتخصيص هذا التقرير ليناسب متطلباتك
ستحصل على تخصيص لأي تقرير - مجانًا - بما في ذلك أجزاء من هذا التقرير، أو تحليل على مستوى الدولة، وحزمة بيانات Excel، بالإضافة إلى الاستفادة من العروض والخصومات الرائعة للشركات الناشئة والجامعات
سوق مراقبة الضغط: رؤى استراتيجية
- احصل على أهم اتجاهات السوق الرئيسية لهذا التقرير.ستتضمن هذه العينة المجانية تحليلاً للبيانات، بدءًا من اتجاهات السوق وحتى التقديرات والتوقعات.
عوامل نمو سوق مراقبة الضغط
- الطلب على الإجراءات غير الجراحية/الأقل تدخلاً: هناك زيادة في استخدام الإجراءات غير الجراحية أو الأقل تدخلاً من قبل المرضى لأنها تستهلك وقتًا أقل ولا تتطلب أي دخول أو إقامة طويلة في المستشفيات أو غيرها من مرافق الرعاية الصحية. إن زيادة الوعي بالإجراءات غير الجراحية يغذي نمو سوق مراقبة الضغط.
- سيناريو السداد الملائم: نظرًا لأن حالات الأمراض المزمنة تتزايد بسرعة بين السكان، فإن شركات التأمين في البلدان المتقدمة والنامية تركز على إدخال هذه الإجراءات ضمن سياساتها. وبالتالي، فإن سيناريو السداد الملائم لمراقبة الضغط في بيئة الرعاية الصحية يعمل أيضًا على دفع نمو السوق.
- انتشار أمراض القلب والأوعية الدموية: إن الانتشار المتزايد لأمراض القلب والأوعية الدموية بين كبار السن وكذلك السكان البالغين يغذي نمو السوق. هناك زيادة في حالات أمراض القلب والأوعية الدموية بين البالغين بسبب زيادة معدلات التدخين وارتفاع ضغط الدم والسمنة والسكري بينهم. ونتيجة لهذا فإن مراقبة ضغط الدم لهؤلاء المرضى تصبح إلزامية مما يغذي نمو السوق.
الاتجاهات المستقبلية لسوق مراقبة الضغط
- التحول نحو مراقبة ضغط الدم من خلال الأجهزة القابلة للارتداء: يعتبر قياس ضغط الدم خارج العيادة مكونًا لا يتجزأ من خوارزمية التشخيص وإدارة ارتفاع ضغط الدم. في عصر الرقمنة، تم تطوير قدر كبير من أجهزة قياس ضغط الدم القابلة للارتداء. وبالتالي، فإن التركيز على استخدام الأجهزة القابلة للارتداء يغذي نمو السوق في فترة التنبؤ.
- المبادرات الاستراتيجية: تركز شركات الرعاية الصحية على تطوير منتجات متقدمة تكنولوجيًا وأكثر دقة مقارنة بالشركات الأخرى. بالإضافة إلى ذلك، هناك زيادة في عدد الشركات الجديدة التي تركز على تقديم حلول وخدمات تركز على العملاء.
- المبادرات الحكومية والتمويل: تركز حكومات البلدان النامية على الاستثمار في تطوير المنتجات القابلة للارتداء والمتقدمة تكنولوجيًا حتى تتمكن من توفير تقنيات فعالة من حيث التكلفة في بلدانها. يعكس دمج أنظمة مراقبة الضغط مع المبادرات الحكومية والاتجاهات الناشئة التزامًا متزايدًا بالابتكار والسلامة والاستدامة.
فرص سوق مراقبة الضغط
- اعتماد مراقبة الرعاية المنزلية: بمساعدة مراقبة المريض عن بعد أو مراقبة الرعاية المنزلية، يمكن للمرضى البقاء على اتصال بفريق الرعاية الخاص بهم والتقاط معلومات صحية مهمة من راحة منازلهم. إن زيادة الوعي بمراقبة المريض عن بعد بين المرضى يغذي نمو السوق
- تطوير الذكاء الاصطناعي: مراقبة الضغط المدعومة: يتيح الذكاء الاصطناعي مراقبة المريض عن بعد مما يقلل التكاليف من خلال فرز المرضى لتحسين دخولهم إلى المستشفى وتجنب المضاعفات. تسهل أدوات المراقبة المدعومة بالذكاء الاصطناعي الإشراف المستمر على المرضى الذين يعانون من حالات مزمنة مثل مرض السكري أو أمراض القلب، مما يسمح بالتدخلات في الوقت المناسب. ومن المتوقع أن يؤدي التركيز المتزايد على تبني استخدام الذكاء الاصطناعي لمراقبة الضغط بسبب فوائده إلى تغذية نمو السوق.
- التقدم في تكنولوجيا الاستشعار: تُستخدم تقنيات استشعار جديدة مختلفة مثل أجهزة الكهروميكانيكية الدقيقة وتكنولوجيا النانو لتقليل الأخطاء أثناء مراقبة المريض. تعمل المواد النانوية على تحسين أجهزة الاستشعار الطبية الحيوية بشكل كبير من خلال توفير حساسية وانتقائية عالية، وهو أمر بالغ الأهمية للكشف عن العلامات البيولوجية والحيوية. وبالتالي، فإن استخدام مثل هذه التقنيات لزيادة الدقة يخلق فرصة لنمو السوق.
رؤى إقليمية حول سوق مراقبة الضغط
لقد قام المحللون في Insight Partners بشرح الاتجاهات والعوامل الإقليمية المؤثرة على سوق مراقبة الضغط طوال فترة التوقعات بشكل شامل. يناقش هذا القسم أيضًا قطاعات سوق مراقبة الضغط والجغرافيا في جميع أنحاء أمريكا الشمالية وأوروبا ومنطقة آسيا والمحيط الهادئ والشرق الأوسط وأفريقيا وأمريكا الجنوبية والوسطى.
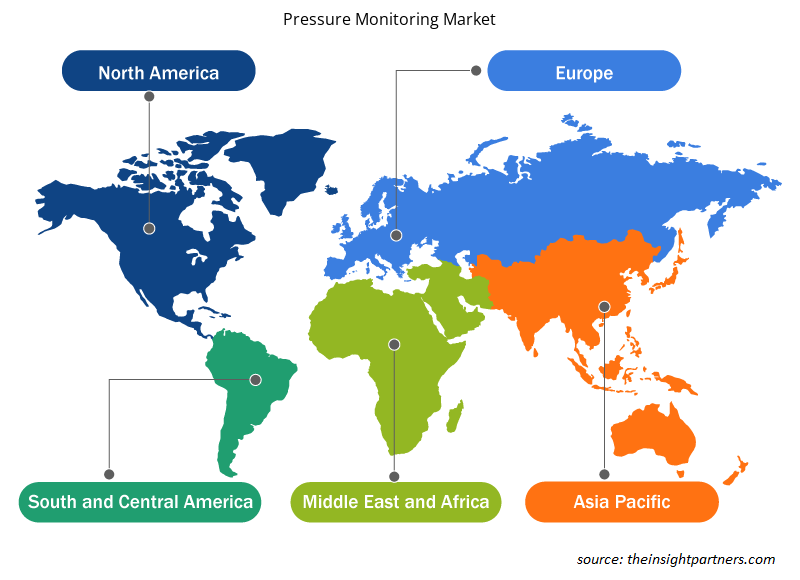
- احصل على البيانات الإقليمية المحددة لسوق مراقبة الضغط
نطاق تقرير سوق مراقبة الضغط
| سمة التقرير | تفاصيل |
|---|---|
| حجم السوق في عام 2024 | XX مليون دولار أمريكي |
| حجم السوق بحلول عام 2031 | XX مليون دولار أمريكي |
| معدل النمو السنوي المركب العالمي (2025 - 2031) | 6.8% |
| البيانات التاريخية | 2021-2023 |
| فترة التنبؤ | 2025-2031 |
| القطاعات المغطاة | حسب المنتج
|
| المناطق والدول المغطاة | أمريكا الشمالية
|
| قادة السوق وملفات تعريف الشركات الرئيسية |
|
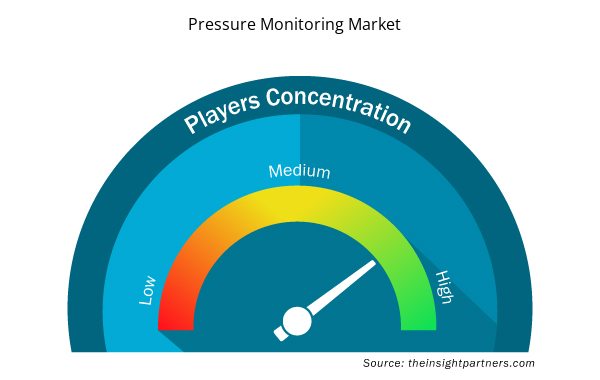
كثافة اللاعبين في سوق مراقبة الضغط: فهم تأثيرها على ديناميكيات الأعمال
يشهد سوق مراقبة الضغط نموًا سريعًا، مدفوعًا بالطلب المتزايد من المستخدم النهائي بسبب عوامل مثل تفضيلات المستهلك المتطورة والتقدم التكنولوجي والوعي المتزايد بفوائد المنتج. ومع ارتفاع الطلب، تعمل الشركات على توسيع عروضها والابتكار لتلبية احتياجات المستهلكين والاستفادة من الاتجاهات الناشئة، مما يؤدي إلى زيادة نمو السوق.
تشير كثافة اللاعبين في السوق إلى توزيع الشركات أو المؤسسات العاملة في سوق أو صناعة معينة. وهي تشير إلى عدد المنافسين (اللاعبين في السوق) الموجودين في مساحة سوق معينة نسبة إلى حجمها أو قيمتها السوقية الإجمالية.
الشركات الرئيسية العاملة في سوق مراقبة الضغط هي:
- مجموعة سميثس المحدودة
- شركة فيليبس الملكية
- ميدترونيك
- شركة جنرال الكتريك
- شركة صن تيك الطبية
إخلاء المسؤولية : الشركات المذكورة أعلاه ليست مرتبة بأي ترتيب معين.
- احصل على نظرة عامة على أهم اللاعبين الرئيسيين في سوق مراقبة الضغط
نقاط البيع الرئيسية
- التغطية الشاملة: يغطي التقرير بشكل شامل تحليل المنتجات والخدمات والأنواع والمستخدمين النهائيين لسوق مراقبة الضغط، مما يوفر صورة شاملة.
- تحليل الخبراء: تم تجميع التقرير على أساس الفهم العميق لخبراء الصناعة والمحللين.
- معلومات محدثة: يضمن التقرير أهمية الأعمال التجارية بسبب تغطيته للمعلومات الحديثة واتجاهات البيانات.
- خيارات التخصيص: يمكن تخصيص هذا التقرير لتلبية متطلبات العملاء المحددة وبما يتناسب مع استراتيجيات العمل بشكل مناسب.
وبالتالي، يمكن أن يساعد تقرير البحث حول سوق مراقبة الضغط في تمهيد الطريق لفك شفرة وفهم سيناريو الصناعة وآفاق النمو. ورغم وجود بعض المخاوف المشروعة، فإن الفوائد الإجمالية لهذا التقرير تميل إلى التفوق على العيوب.
- التحليل التاريخي (سنتان)، السنة الأساسية، التوقعات (7 سنوات) مع معدل النمو السنوي المركب
- تحليل PEST و SWOT
- حجم السوق والقيمة / الحجم - عالميًا وإقليميًا وقطريًا
- الصناعة والمنافسة
- مجموعة بيانات Excel


- Public Key Infrastructure Market
- Medical and Research Grade Collagen Market
- Dried Blueberry Market
- 3D Audio Market
- Non-Emergency Medical Transportation Market
- Cosmetic Bioactive Ingredients Market
- Greens Powder Market
- Photo Editing Software Market
- Bioremediation Technology and Services Market
- Third Party Logistics Market

Report Coverage
Revenue forecast, Company Analysis, Industry landscape, Growth factors, and Trends

Segment Covered
This text is related
to segments covered.

Regional Scope
North America, Europe, Asia Pacific, Middle East & Africa, South & Central America

Country Scope
This text is related
to country scope.
الأسئلة الشائعة
Blood pressure monitoring segment, by product, dominated the market in 2023.
Players operating in the market are Medtronic Plc, Philips Healthcare, GE Healthcare, Siemens Healthineers, Abbott, Boston Scientific, BD, and Stryker Corp
North America region dominated the vascular graft market in 2023.
Adoption of homecare and remote patient monitoring act as a opportunity for growth of the market in forecast period.
The Pressure Monitoring Market is estimated to witness a CAGR of 6.8% from 202#to 2031
The major factors driving the vascular market are:
1. Prevalence of Chronic Diseases.
2. Demand for noninvasive procedures
The List of Companies
1. Smiths Group plc.
2. Koninklijke Philips N.V.
3. Medtronic
4. General Electric Company
5. SunTech Medical, Inc.
6. Rudolf Riester GmbH
7. Uscom
8. Welch Allyn
9. Nonin Medical Inc.
10. ATC Medical
The Insight Partners performs research in 4 major stages: Data Collection & Secondary Research, Primary Research, Data Analysis and Data Triangulation & Final Review.
- Data Collection and Secondary Research:
As a market research and consulting firm operating from a decade, we have published and advised several client across the globe. First step for any study will start with an assessment of currently available data and insights from existing reports. Further, historical and current market information is collected from Investor Presentations, Annual Reports, SEC Filings, etc., and other information related to company’s performance and market positioning are gathered from Paid Databases (Factiva, Hoovers, and Reuters) and various other publications available in public domain.
Several associations trade associates, technical forums, institutes, societies and organization are accessed to gain technical as well as market related insights through their publications such as research papers, blogs and press releases related to the studies are referred to get cues about the market. Further, white papers, journals, magazines, and other news articles published in last 3 years are scrutinized and analyzed to understand the current market trends.
- Primary Research:
The primarily interview analysis comprise of data obtained from industry participants interview and answers to survey questions gathered by in-house primary team.
For primary research, interviews are conducted with industry experts/CEOs/Marketing Managers/VPs/Subject Matter Experts from both demand and supply side to get a 360-degree view of the market. The primary team conducts several interviews based on the complexity of the markets to understand the various market trends and dynamics which makes research more credible and precise.
A typical research interview fulfils the following functions:
- Provides first-hand information on the market size, market trends, growth trends, competitive landscape, and outlook
- Validates and strengthens in-house secondary research findings
- Develops the analysis team’s expertise and market understanding
Primary research involves email interactions and telephone interviews for each market, category, segment, and sub-segment across geographies. The participants who typically take part in such a process include, but are not limited to:
- Industry participants: VPs, business development managers, market intelligence managers and national sales managers
- Outside experts: Valuation experts, research analysts and key opinion leaders specializing in the electronics and semiconductor industry.
Below is the breakup of our primary respondents by company, designation, and region:

Once we receive the confirmation from primary research sources or primary respondents, we finalize the base year market estimation and forecast the data as per the macroeconomic and microeconomic factors assessed during data collection.
- Data Analysis:
Once data is validated through both secondary as well as primary respondents, we finalize the market estimations by hypothesis formulation and factor analysis at regional and country level.
- Macro-Economic Factor Analysis:
We analyse macroeconomic indicators such the gross domestic product (GDP), increase in the demand for goods and services across industries, technological advancement, regional economic growth, governmental policies, the influence of COVID-19, PEST analysis, and other aspects. This analysis aids in setting benchmarks for various nations/regions and approximating market splits. Additionally, the general trend of the aforementioned components aid in determining the market's development possibilities.
- Country Level Data:
Various factors that are especially aligned to the country are taken into account to determine the market size for a certain area and country, including the presence of vendors, such as headquarters and offices, the country's GDP, demand patterns, and industry growth. To comprehend the market dynamics for the nation, a number of growth variables, inhibitors, application areas, and current market trends are researched. The aforementioned elements aid in determining the country's overall market's growth potential.
- Company Profile:
The “Table of Contents” is formulated by listing and analyzing more than 25 - 30 companies operating in the market ecosystem across geographies. However, we profile only 10 companies as a standard practice in our syndicate reports. These 10 companies comprise leading, emerging, and regional players. Nonetheless, our analysis is not restricted to the 10 listed companies, we also analyze other companies present in the market to develop a holistic view and understand the prevailing trends. The “Company Profiles” section in the report covers key facts, business description, products & services, financial information, SWOT analysis, and key developments. The financial information presented is extracted from the annual reports and official documents of the publicly listed companies. Upon collecting the information for the sections of respective companies, we verify them via various primary sources and then compile the data in respective company profiles. The company level information helps us in deriving the base number as well as in forecasting the market size.
- Developing Base Number:
Aggregation of sales statistics (2020-2022) and macro-economic factor, and other secondary and primary research insights are utilized to arrive at base number and related market shares for 2022. The data gaps are identified in this step and relevant market data is analyzed, collected from paid primary interviews or databases. On finalizing the base year market size, forecasts are developed on the basis of macro-economic, industry and market growth factors and company level analysis.
- Data Triangulation and Final Review:
The market findings and base year market size calculations are validated from supply as well as demand side. Demand side validations are based on macro-economic factor analysis and benchmarks for respective regions and countries. In case of supply side validations, revenues of major companies are estimated (in case not available) based on industry benchmark, approximate number of employees, product portfolio, and primary interviews revenues are gathered. Further revenue from target product/service segment is assessed to avoid overshooting of market statistics. In case of heavy deviations between supply and demand side values, all thes steps are repeated to achieve synchronization.
We follow an iterative model, wherein we share our research findings with Subject Matter Experts (SME’s) and Key Opinion Leaders (KOLs) until consensus view of the market is not formulated – this model negates any drastic deviation in the opinions of experts. Only validated and universally acceptable research findings are quoted in our reports.
We have important check points that we use to validate our research findings – which we call – data triangulation, where we validate the information, we generate from secondary sources with primary interviews and then we re-validate with our internal data bases and Subject matter experts. This comprehensive model enables us to deliver high quality, reliable data in shortest possible time.
 احصل على عينة مجانية لهذا التقرير