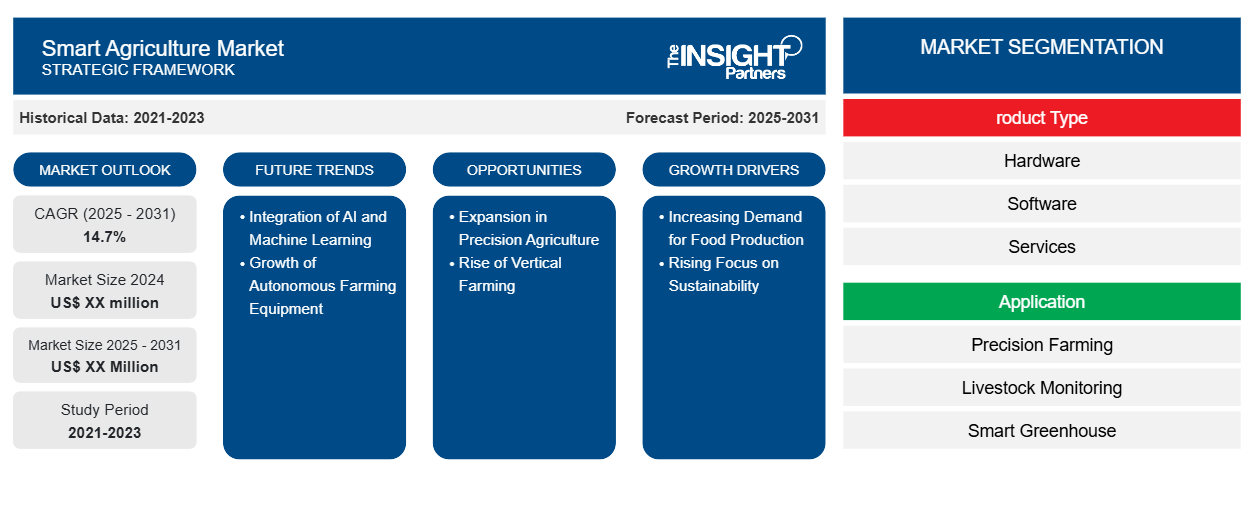
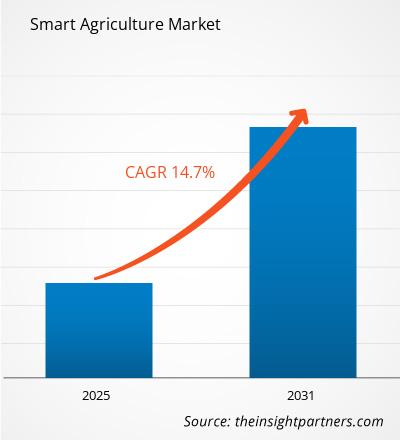
من المتوقع أن يسجل سوق الزراعة الذكية معدل نمو سنوي مركب بنسبة 14.7٪ من عام 2024 إلى عام 2031، مع توسع حجم السوق من XX مليون دولار أمريكي في عام 2024 إلى XX مليون دولار أمريكي بحلول عام 2031.
تم تقسيم التقرير حسب نوع المنتج (الأجهزة والبرامج والخدمات) والتطبيق (الزراعة الدقيقة ومراقبة الثروة الحيوانية والصوبات الزراعية الذكية وغيرها). كما تم تقسيم التحليل العالمي بشكل أكبر على المستوى الإقليمي والدول الرئيسية. يقدم التقرير القيمة بالدولار الأمريكي للتحليل والقطاعات المذكورة أعلاه
غرض التقرير
يهدف تقرير سوق الزراعة الذكية الصادر عن The Insight Partners إلى وصف المشهد الحالي والنمو المستقبلي وأهم العوامل الدافعة والتحديات والفرص. وسيوفر هذا رؤى لمختلف أصحاب المصلحة في الأعمال التجارية، مثل:
- مزودي/مصنعي التكنولوجيا: لفهم ديناميكيات السوق المتطورة ومعرفة فرص النمو المحتملة، وتمكينهم من اتخاذ قرارات استراتيجية مستنيرة.
- المستثمرون: إجراء تحليل شامل للاتجاهات فيما يتعلق بمعدل نمو السوق، وتوقعات السوق المالية، والفرص المتاحة عبر سلسلة القيمة.
- الهيئات التنظيمية: لتنظيم السياسات ومراقبة الأنشطة في السوق بهدف تقليل الانتهاكات والحفاظ على ثقة المستثمرين ودعم سلامة السوق واستقرارها.
تجزئة سوق الزراعة الذكية
نوع المنتج
- الأجهزة
- برمجة
- خدمات
طلب
- الزراعة الدقيقة
- مراقبة الثروة الحيوانية
- الدفيئة الذكية
- آحرون.
قم بتخصيص هذا التقرير ليناسب متطلباتك
ستحصل على تخصيص لأي تقرير - مجانًا - بما في ذلك أجزاء من هذا التقرير، أو تحليل على مستوى الدولة، وحزمة بيانات Excel، بالإضافة إلى الاستفادة من العروض والخصومات الرائعة للشركات الناشئة والجامعات
سوق الزراعة الذكية: رؤى استراتيجية
- احصل على أهم اتجاهات السوق الرئيسية لهذا التقرير.ستتضمن هذه العينة المجانية تحليلاً للبيانات، بدءًا من اتجاهات السوق وحتى التقديرات والتوقعات.
محركات نمو سوق الزراعة الذكية
- الطلب المتزايد على إنتاج الغذاء: مع النمو السريع لسكان العالم، أصبح الطلب على الغذاء في أعلى مستوياته على الإطلاق. تساعد حلول الزراعة الذكية، بما في ذلك الزراعة الدقيقة وأجهزة استشعار إنترنت الأشياء والآلات الآلية، في تحسين ممارسات الزراعة لتلبية هذه المطالب. تمكن هذه التقنيات المزارعين من زيادة غلة المحاصيل والحد من النفايات وتحسين إدارة الموارد، وبالتالي تلبية الحاجة إلى أنظمة إنتاج غذائي أكثر كفاءة لإطعام سكان العالم المتزايدين.
- التركيز المتزايد على الاستدامة: أصبحت الاستدامة مصدر قلق كبير في الزراعة بسبب تغير المناخ، ونضوب الموارد، والتدهور البيئي. تساعد تقنيات الزراعة الذكية المزارعين على تبني ممارسات أكثر استدامة من خلال تحسين استخدام المياه، وتقليل المدخلات الكيميائية، وتقليل النفايات. تتيح التقنيات مثل الطائرات بدون طيار، وأجهزة استشعار التربة، وأنظمة الري الآلية إدارة الموارد بكفاءة أكبر، وتعزيز الإدارة البيئية مع الحفاظ على الإنتاجية.
اتجاهات مستقبل سوق الزراعة الذكية
- دمج الذكاء الاصطناعي والتعلم الآلي: يتم دمج الذكاء الاصطناعي والتعلم الآلي بشكل متزايد في أنظمة الزراعة الذكية. تقوم هذه التقنيات بتحليل كميات هائلة من البيانات التي يتم جمعها من أجهزة الاستشعار والطائرات بدون طيار والأقمار الصناعية، مما يوفر رؤى قابلة للتنفيذ للمزارعين. يمكن للذكاء الاصطناعي والتعلم الآلي التنبؤ بأنماط الطقس وتحسين جداول الزراعة واكتشاف الآفات وتعزيز إدارة المحاصيل وتحسين عملية اتخاذ القرار وكفاءة المزرعة بشكل عام.
- نمو معدات الزراعة المستقلة: إن تبني المركبات والآلات المستقلة هو اتجاه متزايد في الزراعة الذكية. أصبحت الجرارات والحصادات والطائرات بدون طيار المجهزة بنظام تحديد المواقع العالمي وأجهزة الاستشعار أكثر شيوعًا. تعمل هذه الأنظمة المستقلة على تقليل تكاليف العمالة وتحسين الدقة وتمكين العمليات على مدار الساعة طوال أيام الأسبوع، مما يسمح للمزارعين بتحسين العمليات الميدانية مثل الزراعة والتسميد والحصاد بأقل تدخل بشري، مما يزيد الإنتاجية ويقلل من تكاليف التشغيل.
فرص سوق الزراعة الذكية
- التوسع في الزراعة الدقيقة: تعد الزراعة الدقيقة واحدة من أهم الفرص للزراعة الذكية. فمن خلال استخدام التقنيات المتقدمة مثل الجرارات الموجهة بنظام تحديد المواقع العالمي (GPS)، والطائرات بدون طيار، وأجهزة استشعار التربة، يمكن للمزارعين مراقبة المحاصيل وإدارتها بمستوى غير مسبوق من التفاصيل. ويمكن أن يؤدي هذا إلى زيادة غلة المحاصيل، وتقليل النفايات، واستخدام أكثر كفاءة للمدخلات مثل المياه والأسمدة، مما يخلق إمكانات نمو كبيرة في مجال تكنولوجيا الزراعة.
- صعود الزراعة العمودية: الزراعة العمودية، وهي نهج مبتكر يسمح بزراعة المحاصيل في طبقات مكدسة أو بيئات خاضعة للرقابة، توفر فرصًا كبيرة لتقنيات الزراعة الذكية. تعد الأنظمة الآلية للإضاءة ودرجة الحرارة والري وتوصيل العناصر الغذائية أمرًا بالغ الأهمية لتحقيق أقصى قدر من الاستفادة من المساحة والكفاءة. ومع نمو التحضر، يمكن للزراعة العمودية أن توفر حلاً لإنتاج الغذاء المحلي، مما يقلل من تكاليف النقل ويضمن المنتجات الطازجة على مدار العام.
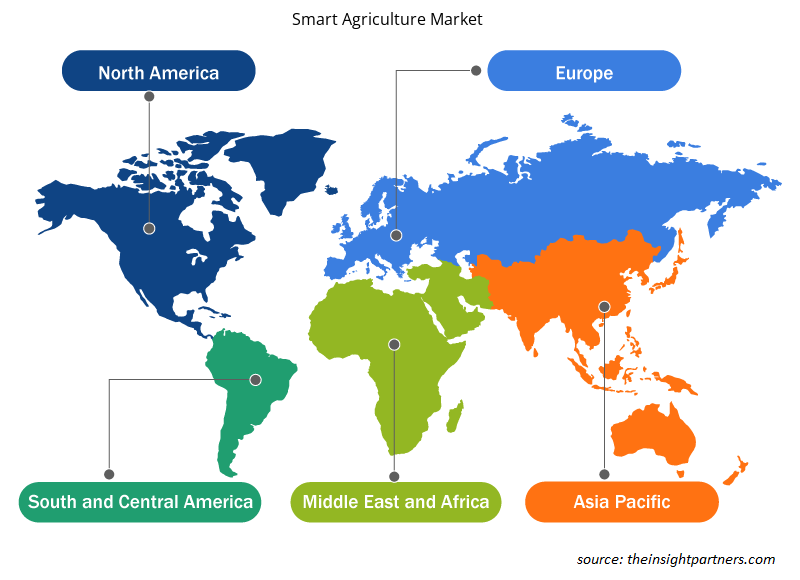
رؤى إقليمية حول سوق الزراعة الذكية
لقد قام المحللون في Insight Partners بشرح الاتجاهات والعوامل الإقليمية المؤثرة على سوق الزراعة الذكية طوال فترة التوقعات بشكل شامل. يناقش هذا القسم أيضًا قطاعات سوق الزراعة الذكية والجغرافيا في جميع أنحاء أمريكا الشمالية وأوروبا ومنطقة آسيا والمحيط الهادئ والشرق الأوسط وأفريقيا وأمريكا الجنوبية والوسطى.
- احصل على البيانات الإقليمية المحددة لسوق الزراعة الذكية
نطاق تقرير سوق الزراعة الذكية
| سمة التقرير | تفاصيل |
|---|---|
| حجم السوق في عام 2024 | XX مليون دولار أمريكي |
| حجم السوق بحلول عام 2031 | XX مليون دولار أمريكي |
| معدل النمو السنوي المركب العالمي (2025 - 2031) | 14.7% |
| البيانات التاريخية | 2021-2023 |
| فترة التنبؤ | 2025-2031 |
| القطاعات المغطاة | حسب نوع المنتج
|
| المناطق والدول المغطاة | أمريكا الشمالية
|
| قادة السوق وملفات تعريف الشركات الرئيسية |
|
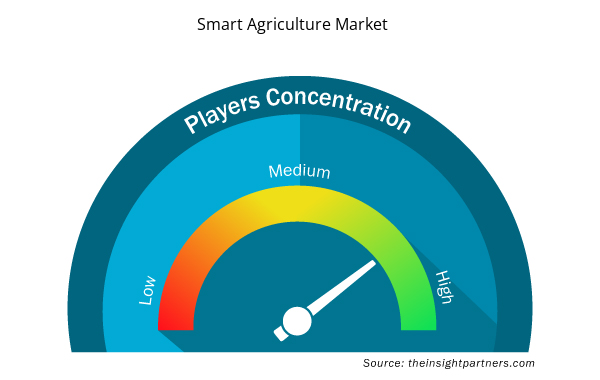
كثافة اللاعبين في سوق الزراعة الذكية: فهم تأثيرها على ديناميكيات الأعمال
يشهد سوق الزراعة الذكية نموًا سريعًا، مدفوعًا بالطلب المتزايد من المستخدم النهائي بسبب عوامل مثل تفضيلات المستهلكين المتطورة والتقدم التكنولوجي والوعي المتزايد بفوائد المنتج. ومع ارتفاع الطلب، تعمل الشركات على توسيع عروضها والابتكار لتلبية احتياجات المستهلكين والاستفادة من الاتجاهات الناشئة، مما يؤدي إلى زيادة نمو السوق.
تشير كثافة اللاعبين في السوق إلى توزيع الشركات أو المؤسسات العاملة في سوق أو صناعة معينة. وهي تشير إلى عدد المنافسين (اللاعبين في السوق) الموجودين في مساحة سوق معينة نسبة إلى حجمها أو قيمتها السوقية الإجمالية.
الشركات الرئيسية العاملة في سوق الزراعة الذكية هي:
- شركة AGCO
- شركة أج جانكشن
- شركة AG Leader Technology
- شركة ديري
- صناعات الغراب
- شركة.
إخلاء المسؤولية : الشركات المذكورة أعلاه ليست مرتبة بأي ترتيب معين.
- احصل على نظرة عامة على أهم اللاعبين الرئيسيين في سوق الزراعة الذكية
نقاط البيع الرئيسية
- التغطية الشاملة: يغطي التقرير بشكل شامل تحليل المنتجات والخدمات والأنواع والمستخدمين النهائيين لسوق الزراعة الذكية، مما يوفر صورة شاملة.
- تحليل الخبراء: تم تجميع التقرير على أساس الفهم العميق لخبراء الصناعة والمحللين.
- معلومات محدثة: يضمن التقرير أهمية الأعمال التجارية بسبب تغطيته للمعلومات الحديثة واتجاهات البيانات.
- خيارات التخصيص: يمكن تخصيص هذا التقرير لتلبية متطلبات العملاء المحددة وبما يتناسب مع استراتيجيات العمل بشكل مناسب.
وبالتالي، فإن تقرير البحث حول سوق الزراعة الذكية يمكن أن يساعد في تمهيد الطريق لفك شفرة وفهم سيناريو الصناعة وآفاق النمو. ورغم وجود بعض المخاوف المشروعة، فإن الفوائد الإجمالية لهذا التقرير تميل إلى التفوق على العيوب.
- التحليل التاريخي (سنتان)، السنة الأساسية، التوقعات (7 سنوات) مع معدل النمو السنوي المركب
- تحليل PEST و SWOT
- حجم السوق والقيمة / الحجم - عالميًا وإقليميًا وقطريًا
- الصناعة والمنافسة
- مجموعة بيانات Excel


- USB Device Market
- Medical Audiometer Devices Market
- Single-Use Negative Pressure Wound Therapy Devices Market
- Microcatheters Market
- Pharmacovigilance and Drug Safety Software Market
- Dried Blueberry Market
- Enzymatic DNA Synthesis Market
- Bio-Based Ethylene Market
- Frozen Potato Market
- Occupational Health Market

Report Coverage
Revenue forecast, Company Analysis, Industry landscape, Growth factors, and Trends

Segment Covered
This text is related
to segments covered.

Regional Scope
North America, Europe, Asia Pacific, Middle East & Africa, South & Central America

Country Scope
This text is related
to country scope.
الأسئلة الشائعة
The Smart Agriculture Market is estimated to witness a CAGR of 14.7% from 2023 to 2031
Rise in digitalization and governmentiInvestment are the major factors driving the smart agriculture market.
Focus on Advanced Technology Integration are likely to remain a key trend in the market.
The report can be delivered in PDF/PPT format; we can also share excel dataset based on the request
Some of the customization options available based on the request are an additional 3-5 company profiles and country-specific analysis of 3-5 countries of your choice. Customizations are to be requested/discussed before making final order confirmation# as our team would review the same and check the feasibility
The List of Companies - Smart Agriculture Market
1. AGCO Corporation
2. Ag Junction Inc.
3. AG Leader Technology
4. Deere & Company
5. Raven Industries, Inc.
6. Semiosbio Technologies Inc.
7. SST Development Group, Inc.
8. Teejet Technologies
9. Topcon Precision Agriculture
10. Trimble Navigation Limited among others.
The Insight Partners performs research in 4 major stages: Data Collection & Secondary Research, Primary Research, Data Analysis and Data Triangulation & Final Review.
- Data Collection and Secondary Research:
As a market research and consulting firm operating from a decade, we have published and advised several client across the globe. First step for any study will start with an assessment of currently available data and insights from existing reports. Further, historical and current market information is collected from Investor Presentations, Annual Reports, SEC Filings, etc., and other information related to company’s performance and market positioning are gathered from Paid Databases (Factiva, Hoovers, and Reuters) and various other publications available in public domain.
Several associations trade associates, technical forums, institutes, societies and organization are accessed to gain technical as well as market related insights through their publications such as research papers, blogs and press releases related to the studies are referred to get cues about the market. Further, white papers, journals, magazines, and other news articles published in last 3 years are scrutinized and analyzed to understand the current market trends.
- Primary Research:
The primarily interview analysis comprise of data obtained from industry participants interview and answers to survey questions gathered by in-house primary team.
For primary research, interviews are conducted with industry experts/CEOs/Marketing Managers/VPs/Subject Matter Experts from both demand and supply side to get a 360-degree view of the market. The primary team conducts several interviews based on the complexity of the markets to understand the various market trends and dynamics which makes research more credible and precise.
A typical research interview fulfils the following functions:
- Provides first-hand information on the market size, market trends, growth trends, competitive landscape, and outlook
- Validates and strengthens in-house secondary research findings
- Develops the analysis team’s expertise and market understanding
Primary research involves email interactions and telephone interviews for each market, category, segment, and sub-segment across geographies. The participants who typically take part in such a process include, but are not limited to:
- Industry participants: VPs, business development managers, market intelligence managers and national sales managers
- Outside experts: Valuation experts, research analysts and key opinion leaders specializing in the electronics and semiconductor industry.
Below is the breakup of our primary respondents by company, designation, and region:

Once we receive the confirmation from primary research sources or primary respondents, we finalize the base year market estimation and forecast the data as per the macroeconomic and microeconomic factors assessed during data collection.
- Data Analysis:
Once data is validated through both secondary as well as primary respondents, we finalize the market estimations by hypothesis formulation and factor analysis at regional and country level.
- Macro-Economic Factor Analysis:
We analyse macroeconomic indicators such the gross domestic product (GDP), increase in the demand for goods and services across industries, technological advancement, regional economic growth, governmental policies, the influence of COVID-19, PEST analysis, and other aspects. This analysis aids in setting benchmarks for various nations/regions and approximating market splits. Additionally, the general trend of the aforementioned components aid in determining the market's development possibilities.
- Country Level Data:
Various factors that are especially aligned to the country are taken into account to determine the market size for a certain area and country, including the presence of vendors, such as headquarters and offices, the country's GDP, demand patterns, and industry growth. To comprehend the market dynamics for the nation, a number of growth variables, inhibitors, application areas, and current market trends are researched. The aforementioned elements aid in determining the country's overall market's growth potential.
- Company Profile:
The “Table of Contents” is formulated by listing and analyzing more than 25 - 30 companies operating in the market ecosystem across geographies. However, we profile only 10 companies as a standard practice in our syndicate reports. These 10 companies comprise leading, emerging, and regional players. Nonetheless, our analysis is not restricted to the 10 listed companies, we also analyze other companies present in the market to develop a holistic view and understand the prevailing trends. The “Company Profiles” section in the report covers key facts, business description, products & services, financial information, SWOT analysis, and key developments. The financial information presented is extracted from the annual reports and official documents of the publicly listed companies. Upon collecting the information for the sections of respective companies, we verify them via various primary sources and then compile the data in respective company profiles. The company level information helps us in deriving the base number as well as in forecasting the market size.
- Developing Base Number:
Aggregation of sales statistics (2020-2022) and macro-economic factor, and other secondary and primary research insights are utilized to arrive at base number and related market shares for 2022. The data gaps are identified in this step and relevant market data is analyzed, collected from paid primary interviews or databases. On finalizing the base year market size, forecasts are developed on the basis of macro-economic, industry and market growth factors and company level analysis.
- Data Triangulation and Final Review:
The market findings and base year market size calculations are validated from supply as well as demand side. Demand side validations are based on macro-economic factor analysis and benchmarks for respective regions and countries. In case of supply side validations, revenues of major companies are estimated (in case not available) based on industry benchmark, approximate number of employees, product portfolio, and primary interviews revenues are gathered. Further revenue from target product/service segment is assessed to avoid overshooting of market statistics. In case of heavy deviations between supply and demand side values, all thes steps are repeated to achieve synchronization.
We follow an iterative model, wherein we share our research findings with Subject Matter Experts (SME’s) and Key Opinion Leaders (KOLs) until consensus view of the market is not formulated – this model negates any drastic deviation in the opinions of experts. Only validated and universally acceptable research findings are quoted in our reports.
We have important check points that we use to validate our research findings – which we call – data triangulation, where we validate the information, we generate from secondary sources with primary interviews and then we re-validate with our internal data bases and Subject matter experts. This comprehensive model enables us to deliver high quality, reliable data in shortest possible time.
 احصل على عينة مجانية لهذا التقرير