نظرة عامة على سوق تحليلات وسائل التواصل الاجتماعي والنمو والاتجاهات والتحليل وتقرير البحث (2023-2031)
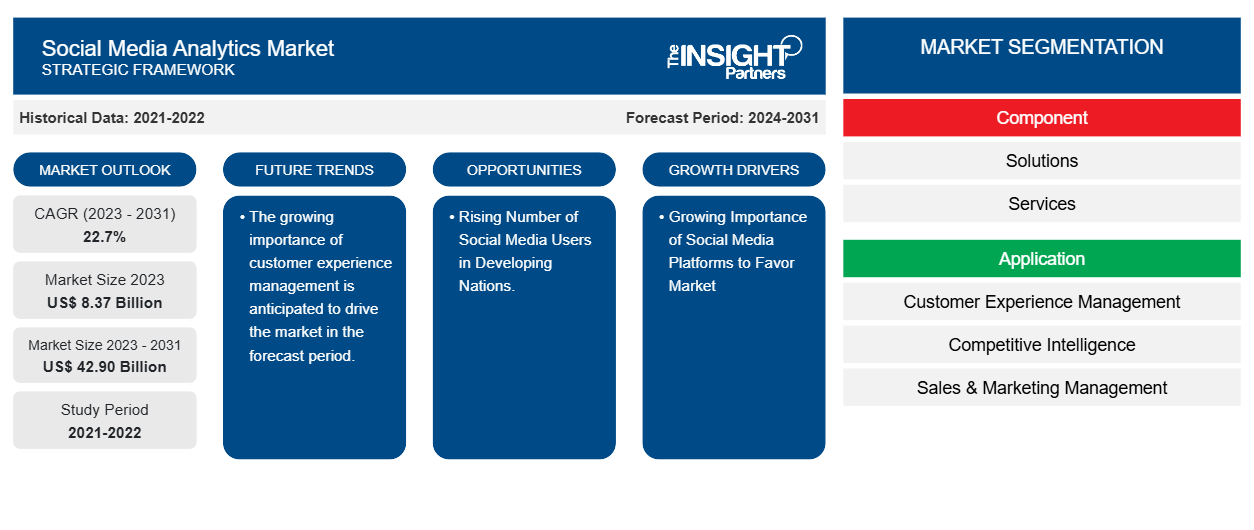
البيانات التاريخية : 2021-2022 | سنة الأساس : 2023 | فترة التنبؤ : 2024-2031حجم سوق تحليلات وسائل التواصل الاجتماعي وتوقعاته (2021-2031)، والحصة العالمية والإقليمية، والاتجاهات، وفرص النمو. يغطي التقرير: حسب المكونات [الحلول والخدمات (الخدمات المهنية والخدمات المُدارة)]، والتطبيق (إدارة تجربة العملاء، والاستخبارات التنافسية، وإدارة المبيعات والتسويق، وغيرها)، والنشر (السحابي والمحلي)، وحجم المؤسسة (الشركات الكبيرة والصغيرة والمتوسطة)، والقطاعات (الخدمات المصرفية والمالية والتأمين، وتكنولوجيا المعلومات والاتصالات، والإعلام والترفيه، وتجارة التجزئة والتجارة الإلكترونية، وغيرها)، والجغرافيا.
- تاريخ التقرير : Mar 2026
- رمز التقرير : TIPTE100000194
- الفئة : التكنولوجيا والإعلام والاتصالات
- الحالة : البيانات الصادرة
- تنسيقات التقارير المتاحة :


- عدد الصفحات : 150
من المتوقع أن يصل حجم سوق تحليلات وسائل التواصل الاجتماعي إلى 42.90 مليار دولار أمريكي بحلول عام 2031 من 8.37 مليار دولار أمريكي في عام 2023. ومن المتوقع أن يسجل السوق معدل نمو سنوي مركب بنسبة 22.7٪ خلال الفترة 2023-2031. ومن المرجح أن تكون الأهمية المتزايدة لمنصات التواصل الاجتماعي والطلب المتزايد على الذكاء التجاري من المحركات والاتجاهات الرئيسية للسوق.
تحليل سوق تحليلات وسائل التواصل الاجتماعي
يشهد سوق تحليلات وسائل التواصل الاجتماعي نموًا كبيرًا على مستوى العالم. ويعزى هذا النمو إلى الأهمية المتزايدة لمنصات وسائل التواصل الاجتماعي والطلب المتزايد على استخبارات الأعمال. علاوة على ذلك، من المتوقع أن يحمل العدد المتزايد من مستخدمي وسائل التواصل الاجتماعي في الدول النامية، والاستخدام المتزايد لتحليلات وسائل التواصل الاجتماعي من قبل وكالات إنفاذ القانون، والتكامل المتزايد للذكاء الاصطناعي في تحليلات وسائل التواصل الاجتماعي والأهمية المتزايدة لإدارة تجربة العملاء، العديد من الفرص في السوق.
نظرة عامة على سوق تحليلات وسائل التواصل الاجتماعي
تحليلات وسائل التواصل الاجتماعي هي القدرة على جمع وإيجاد المعنى في البيانات التي يتم جمعها من القنوات الاجتماعية لدعم القرارات التجارية وحساب أداء الإجراءات مع مراعاة تلك القرارات من خلال وسائل التواصل الاجتماعي. يمكن أن تفيد وسائل التواصل الاجتماعي الشركات من خلال السماح للمسوقين برصد الاتجاهات في سلوك المستهلك المرتبطة بصناعة الشركة ويمكن أن تؤثر على نجاح جهود التسويق.
قم بتخصيص هذا التقرير ليناسب متطلباتك
ستحصل على تخصيص لأي تقرير - مجانًا - بما في ذلك أجزاء من هذا التقرير، أو تحليل على مستوى الدولة، وحزمة بيانات Excel، بالإضافة إلى الاستفادة من العروض والخصومات الرائعة للشركات الناشئة والجامعات
سوق تحليلات وسائل التواصل الاجتماعي: رؤى استراتيجية
-
احصل على أهم اتجاهات السوق الرئيسية لهذا التقرير.ستتضمن هذه العينة المجانية تحليلاً للبيانات، بدءًا من اتجاهات السوق وحتى التقديرات والتوقعات.
محركات وفرص سوق تحليلات وسائل التواصل الاجتماعي
الأهمية المتزايدة لمنصات التواصل الاجتماعي في تعزيز السوق
إن الأهمية المتزايدة لمنصات التواصل الاجتماعي هي التي تدفع السوق بالفعل. تسمح منصات التواصل الاجتماعي بالاتصال الفوري مع الأحباء، والتغلب على المسافات وتعزيز الروابط القوية. في بيئة اليوم السريعة الخطى، يعد الحفاظ على العلاقات والمشاركة في التبادلات في الوقت الفعلي أمرًا بالغ الأهمية. تسهل وسائل التواصل الاجتماعي النشر السريع للمعلومات، مما يجعل من السهل مواكبة الأخبار والأحداث الجارية. إنها توفر منتدى لتبادل وجهات النظر المختلفة والوصول إلى المعلومات في الوقت الفعلي أثناء الأزمات أو الأحداث الدولية المهمة. إن تحليلات وسائل التواصل الاجتماعي أوسع من المقاييس مثل الإعجابات وإعادة التغريد والمتابعين والمعاينات والنقرات والانطباعات التي تم جمعها من القنوات الفردية. وبالتالي، فإن الأهمية المتزايدة لوسائل التواصل الاجتماعي هي التي تدفع سوق تحليلات وسائل التواصل الاجتماعي.
ارتفاع عدد مستخدمي وسائل التواصل الاجتماعي في الدول النامية.
من المتوقع أن يحمل العدد المتزايد من مستخدمي وسائل التواصل الاجتماعي في الدول النامية العديد من الفرص في السنوات القادمة. حيث يقوم المزيد من مستخدمي وسائل التواصل الاجتماعي بتوليد المزيد من البيانات للمشاركات والإعجابات والمشاركات والتعليقات والتفاعلات. تؤدي هذه الكمية الكبيرة من البيانات إلى الحاجة إلى التحليلات . علاوة على ذلك، تساعد تحليلات وسائل التواصل الاجتماعي الشركات المختلفة على فهم تفضيلات الجمهور الجديدة. اعتبارًا من عام 2024، يوجد 5.17 مليار مستخدم لوسائل التواصل الاجتماعي في جميع أنحاء العالم، بزيادة سنوية بنسبة 5.5٪. وبالتالي، من المتوقع أن يحمل العدد المتزايد من مستخدمي وسائل التواصل الاجتماعي في الدول النامية العديد من الفرص في السنوات القادمة.
تقرير تحليلات سوق وسائل التواصل الاجتماعي وتحليل التجزئة
إن القطاعات الرئيسية التي ساهمت في استنباط تحليل سوق تحليلات وسائل التواصل الاجتماعي هي المكون والتطبيق والنشر وحجم المنظمة والعمودي.
- بناءً على المكونات، ينقسم سوق تحليلات وسائل التواصل الاجتماعي إلى حلول وخدمات (خدمات مهنية وخدمات مُدارة). ومن المتوقع أن يحظى قطاع الحلول بحصة سوقية كبيرة في فترة التوقعات.
- بناءً على التطبيق، ينقسم سوق تحليلات وسائل التواصل الاجتماعي إلى إدارة تجربة العملاء، والاستخبارات التنافسية، وإدارة المبيعات والتسويق، وغيرها. ومن المتوقع أن يحظى قطاع إدارة تجربة العملاء بحصة سوقية كبيرة في الفترة المتوقعة.
- من حيث النشر، يتم تقسيم السوق إلى سحابية ومحلية. ومن المتوقع أن يحظى قطاع السحابة بحصة سوقية كبيرة خلال فترة التنبؤ.
- بحسب حجم المنظمة، يتم تقسيم السوق إلى شركات كبيرة وصغيرة الحجم. ومن المتوقع أن تحظى شريحة الشركات الكبيرة بحصة سوقية كبيرة خلال فترة التوقعات.
- من حيث القطاع الرأسي، يتم تقسيم السوق إلى قطاعات BFSI وIT والاتصالات والإعلام والترفيه والتجزئة والتجارة الإلكترونية وغيرها. ومن المتوقع أن يستحوذ قطاع BFSI على حصة سوقية كبيرة خلال الفترة المتوقعة.
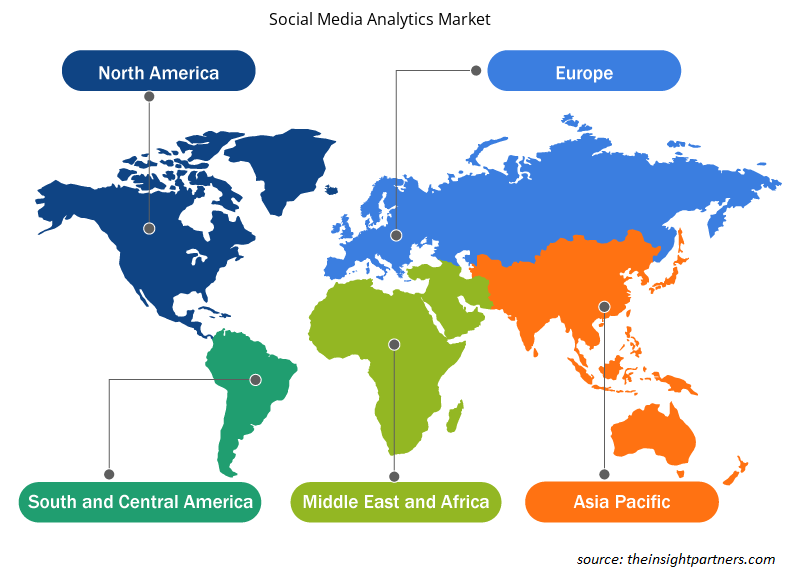
تحليل حصة سوق تحليلات وسائل التواصل الاجتماعي حسب المنطقة الجغرافية
ينقسم النطاق الجغرافي لتقرير سوق تحليلات وسائل التواصل الاجتماعي بشكل أساسي إلى خمس مناطق: أمريكا الشمالية، ومنطقة آسيا والمحيط الهادئ، وأوروبا، والشرق الأوسط وأفريقيا، وأمريكا الجنوبية والوسطى.
سيطرت أمريكا الشمالية على سوق تحليلات وسائل التواصل الاجتماعي. وقد أدت اتجاهات تبني التكنولوجيا العالية في مختلف الصناعات في منطقة أمريكا الشمالية إلى تغذية نمو سوق تحليلات وسائل التواصل الاجتماعي. ومن المتوقع أن تؤدي عوامل مثل زيادة اعتماد الأدوات الرقمية والإنفاق التكنولوجي العالي من قبل الوكالات الحكومية إلى دفع نمو سوق تحليلات وسائل التواصل الاجتماعي في أمريكا الشمالية. الأهمية المتزايدة لمنصات وسائل التواصل الاجتماعي والطلب المتزايد على استخبارات الأعمال. علاوة على ذلك، فإن التركيز القوي على البحث والتطوير في الاقتصادات المتقدمة في الولايات المتحدة وكندا يجبر اللاعبين في أمريكا الشمالية على جلب حلول متقدمة تقنيًا إلى السوق. بالإضافة إلى ذلك، تمتلك الولايات المتحدة عددًا كبيرًا من اللاعبين في سوق تحليلات وسائل التواصل الاجتماعي الذين يركزون بشكل متزايد على تطوير حلول مبتكرة. تساهم كل هذه العوامل في نمو المنطقة في سوق تحليلات وسائل التواصل الاجتماعي.
رؤى إقليمية حول سوق تحليلات وسائل التواصل الاجتماعي
لقد قام المحللون في Insight Partners بشرح الاتجاهات والعوامل الإقليمية المؤثرة على سوق تحليلات وسائل التواصل الاجتماعي طوال فترة التوقعات بشكل شامل. يناقش هذا القسم أيضًا قطاعات سوق تحليلات وسائل التواصل الاجتماعي والجغرافيا في جميع أنحاء أمريكا الشمالية وأوروبا ومنطقة آسيا والمحيط الهادئ والشرق الأوسط وأفريقيا وأمريكا الجنوبية والوسطى.
- احصل على بيانات إقليمية محددة لسوق تحليلات وسائل التواصل الاجتماعي
نطاق تقرير سوق تحليلات وسائل التواصل الاجتماعي
| سمة التقرير | تفاصيل |
|---|---|
| حجم السوق في عام 2023 | 8.37 مليار دولار أمريكي |
| حجم السوق بحلول عام 2031 | 42.90 مليار دولار أمريكي |
| معدل النمو السنوي المركب العالمي (2023 - 2031) | 22.7% |
| البيانات التاريخية | 2021-2022 |
| فترة التنبؤ | 2024-2031 |
| القطاعات المغطاة |
حسب المكون
|
| المناطق والدول المغطاة |
أمريكا الشمالية
|
| قادة السوق وملفات تعريف الشركات الرئيسية |
|
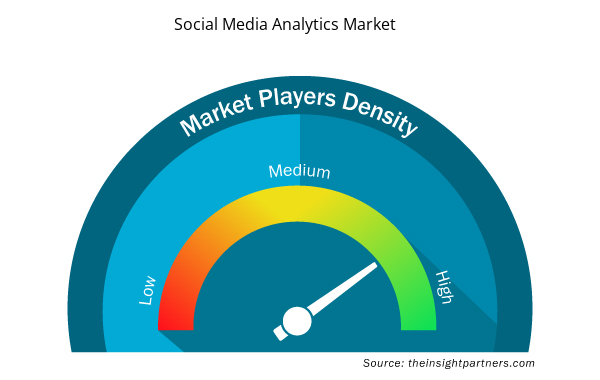
كثافة اللاعبين في سوق تحليلات وسائل التواصل الاجتماعي: فهم تأثيرها على ديناميكيات الأعمال
يشهد سوق تحليلات وسائل التواصل الاجتماعي نموًا سريعًا، مدفوعًا بالطلب المتزايد من المستخدم النهائي بسبب عوامل مثل تفضيلات المستهلكين المتطورة والتقدم التكنولوجي والوعي المتزايد بفوائد المنتج. ومع ارتفاع الطلب، تعمل الشركات على توسيع عروضها والابتكار لتلبية احتياجات المستهلكين والاستفادة من الاتجاهات الناشئة، مما يؤدي إلى زيادة نمو السوق.
تشير كثافة اللاعبين في السوق إلى توزيع الشركات أو المؤسسات العاملة في سوق أو صناعة معينة. وهي تشير إلى عدد المنافسين (اللاعبين في السوق) الموجودين في مساحة سوق معينة نسبة إلى حجمها أو قيمتها السوقية الإجمالية.
الشركات الرئيسية العاملة في سوق تحليلات وسائل التواصل الاجتماعي هي:
- شركة سيسيون المحدودة
- شركة هوتسويت
- شركة آي بي إم
- مياه الذوبان في نيفادا
- شركة أوراكل
- شركة كوالتريكس الدولية
إخلاء المسؤولية : الشركات المذكورة أعلاه ليست مرتبة بأي ترتيب معين.
- احصل على نظرة عامة على أهم اللاعبين الرئيسيين في سوق تحليلات وسائل التواصل الاجتماعي
أخبار سوق تحليلات وسائل التواصل الاجتماعي والتطورات الأخيرة
يتم تقييم سوق تحليلات وسائل التواصل الاجتماعي من خلال جمع البيانات النوعية والكمية بعد البحث الأولي والثانوي، والذي يتضمن منشورات الشركات المهمة وبيانات الجمعيات وقواعد البيانات. فيما يلي بعض التطورات في سوق تحليلات وسائل التواصل الاجتماعي:
- برزت وسائل التواصل الاجتماعي كقناة أساسية للعلامات التجارية للتواصل مع جماهيرها، ووفقًا لتقرير Muck Rack's 2023 State of PR، فإن اثنتين من أفضل ثلاث منصات في استراتيجيات الاتصالات هما Instagram (75%) وTwitter (72%). يسعد Muck Rack أن تعلن عن شراكتها مع أداة تحليلات وسائل التواصل الاجتماعي Keyhole، والتي تتيح للعملاء تضمين منصة الاستماع الاجتماعي الخاصة بـ Keyhole كإضافة إلى اشتراك Muck Rack. (المصدر: موقع شركة Muck Rack، نوفمبر 2023)
- أطلقت شركة Concept BIU، الرائدة في مجال مراقبة وسائل الإعلام وقياس العلاقات العامة والتحليلات في الهند، خدمة تحليلات واستخبارات سريعة وعالية الجودة وشاملة وقابلة للتخصيص لوسائل التواصل الاجتماعي. تزود هذه الخدمة العملاء من الشركات بتحديثات وسائل التواصل الاجتماعي الدقيقة وفي الوقت المناسب والاتجاهات والاستخبارات الميدانية بنقرة زر واحدة. (المصدر: موقع شركة Concept BIU على الويب، مارس 2022)
تقرير سوق تحليلات وسائل التواصل الاجتماعي والتغطية والنتائج المتوقعة
يوفر تقرير "حجم سوق تحليلات وسائل التواصل الاجتماعي والتوقعات (2021-2031)" تحليلاً مفصلاً للسوق يغطي المجالات التالية:
- حجم سوق تحليلات وسائل التواصل الاجتماعي وتوقعاتها على المستويات العالمية والإقليمية والوطنية لجميع قطاعات السوق الرئيسية التي يغطيها النطاق.
- اتجاهات سوق تحليلات وسائل التواصل الاجتماعي، بالإضافة إلى ديناميكيات السوق مثل المحركات والقيود والفرص الرئيسية.
- تحليل مفصل لقوى PEST/Porter الخمس و SWOT.
- تحليل سوق تحليلات وسائل التواصل الاجتماعي يغطي اتجاهات السوق الرئيسية والإطار العالمي والإقليمي واللاعبين الرئيسيين واللوائح والتطورات الأخيرة في السوق.
- تحليل المشهد الصناعي والمنافسة الذي يغطي تركيز السوق، وتحليل خريطة الحرارة، واللاعبين البارزين، والتطورات الأخيرة في سوق تحليلات وسائل التواصل الاجتماعي.
- ملفات تعريفية مفصلة للشركة.

أنكيتا خبيرة ديناميكية في أبحاث السوق والاستشارات، تتمتع بخبرة تزيد عن 8 سنوات في قطاعات التكنولوجيا والإعلام وتكنولوجيا المعلومات والاتصالات والإلكترونيات وأشباه الموصلات. وقد قادت ونفذت بنجاح أكثر من 100 مهمة استشارية وبحثية لعملاء عالميين مثل مايكروسوفت وأوراكل وشركة NEC وSAP وKPMG وExpeditors International. تشمل كفاءاتها الأساسية تقييم السوق، وتحليل البيانات، والتنبؤ، وصياغة الاستراتيجيات، والاستخبارات التنافسية، وكتابة التقارير.
أنكيتا بارعة في إدارة دورات المشاريع الكاملة، بدءًا من تصميم عروض ما قبل البيع ومناقشات العملاء، وصولًا إلى تقديم رؤى عملية بعد البيع. كما أنها ماهرة في إدارة فرق متعددة الوظائف، وهيكلة وحدات بحثية معقدة، ومواءمة الحلول مع أهداف العمل الخاصة بالعملاء. وقد مكنتها مهاراتها الممتازة في التواصل والقيادة والعرض التقديمي من تحقيق نتائج قيّمة باستمرار في بيئات سوقية سريعة التطور.
- التحليل التاريخي (سنتان)، سنة الأساس، التوقعات (7 سنوات) مع معدل النمو السنوي المركب
- تحليل PEST و SWOT
- حجم السوق والقيمة / الحجم - عالمي، إقليمي، بلد
- الصناعة والمنافسة
- مجموعة بيانات إكسل
التقارير الحديثة
تقارير ذات صلة
شهادات العملاء
تقرير سوق أنظمة SCADA من Insight Partners شامل، ويقدم رؤى قيّمة حول الاتجاهات الحالية والتوقعات المستقبلية. تميّز الفريق باحترافية عالية وسرعة في الاستجابة ودعم مستمر طوال الوقت. نحن راضون جدًا ونوصي بشدة بخدماتهم.
ران كيديم شريك, شركة ريالي تكنولوجيز المحدودةطلبتُ تقريرًا عن سوق برمجيات محدد، وأعدّه الفريق في غضون أيام قليلة. كانت المعلومات ذات صلة وثيقة وعرضها جيد. ثم طلبتُ بعض التعديلات والإضافات على التقرير. وكان الفريق متجاوبًا للغاية، وحصلتُ على التقرير النهائي في أقل من أسبوع.
جان هيرفيه جين رئيس مجلس الإدارة, فيوتشر أناليتيكاعملنا مع شركة "إنسايت بارتنرز" لإجراء دراسة سوقية وتوقعات مهمة. زودونا برؤى واضحة حول الفرص والمخاطر، مما ساعدنا في صياغة خططنا. كانت أبحاثهم سهلة الاستخدام ومبنية على بيانات دقيقة، مما ساعدنا على اتخاذ قرارات ذكية وواثقة. نوصي بهم بشدة.
بيوش ناجبال نائب الرئيس الأول, شعاع عالي عالميقدّمت شركة Insight Partners أبحاثًا سوقية ثاقبة ومنظمة جيدًا بخبرة واسعة في هذا المجال. تميّز فريقهم بالاحترافية وسرعة الاستجابة طوال الوقت. وسهّل موقعهم الإلكتروني سهل الاستخدام الوصول إلى تقارير القطاع. نوصي بهم بشدة لخدمات بحثية موثوقة وعالية الجودة.
يوكيهيكو أداتشي المدير التنفيذي, ديب بلو، ذ.م.م.هذه أول مرة أشتري فيها تقرير سوق من The Insight Partners. رغم أنني كنت مترددًا في البداية، إلا أنني زرت موقعهم الإلكتروني وشعرت براحة أكبر للمخاطرة وشراء تقرير السوق. أنا راضٍ تمامًا عن جودة التقرير وخدمة العملاء. كانت لديّ عدة أسئلة وتعليقات حول التقرير الأولي، ولكن بعد بضع محادثات عبر البريد الإلكتروني مع محللهم، أعتقد أن لديّ تقريرًا يمكنني استخدامه كمدخل لعملية التخطيط الاستراتيجي لدينا. شكرًا جزيلاً لكم على تخصيص وقتكم الإضافي وجعل هذه التجربة إيجابية. سأوصي بخدماتكم للآخرين بالتأكيد، وستكونون أول من ألجأ إليه عندما نحتاج إلى المزيد من بيانات السوق.
جون سوزوكي الرئيس والرئيس التنفيذي وعضو مجلس الإدارة, بي كيه تكنولوجيزأود أن أقدّر دعمكم واحترافيتكم في الاستجابة لطلبي للحصول على معلومات بشأن سوق التشخيص المخبري للأمراض المعدية في نيجيريا. كما أُقدّر صبركم وتوجيهكم، واستعدادكم لتقديم خصم، مما مكّننا في النهاية من إتمام الصفقة. أتطلع إلى التعامل مع "ذا إنسايت بارتنرز" مستقبلًا، كل ذلك بفضل الانطباع الذي تركتموه لديّ نتيجةً لهذا اللقاء الأول.
الدكتور تشيجيوك أونيا المدير الإداري, شركة باينكريست للرعاية الصحية المحدودةسبب الشراء
- اتخاذ قرارات مدروسة
- فهم ديناميكيات السوق
- تحليل المنافسة
- رؤى العملاء
- توقعات السوق
- تخفيف المخاطر
- التخطيط الاستراتيجي
- مبررات الاستثمار
- تحديد الأسواق الناشئة
- تحسين استراتيجيات التسويق
- تعزيز الكفاءة التشغيلية
- مواكبة التوجهات التنظيمية


 احصل على عينة مجانية ل - سوق تحليلات وسائل التواصل الاجتماعي