استراتيجيات سوق الطباعة اللمسية، وأفضل اللاعبين، وفرص النمو، والتحليل والتنبؤ بحلول عام 2028
البيانات التاريخية : 2019-2020 | سنة الأساس : 2021 | فترة التنبؤ : 2022-2028توقعات سوق الطباعة اللمسية حتى عام 2028 - تأثير كوفيد-19 والتحليل العالمي حسب التطبيق (التغليف والملصقات، والرسومات اللمسية، والتوثيق الآمن) والمستخدم النهائي (مستخدمو برايل، والصناعة، والحكومات والدفاع) والجغرافيا
- تاريخ التقرير : May 2021
- رمز التقرير : TIPRE00010303
- الفئة : الإلكترونيات وأشباه الموصلات
- الحالة : نُشرت
- تنسيقات التقارير المتاحة :


- عدد الصفحات : 140
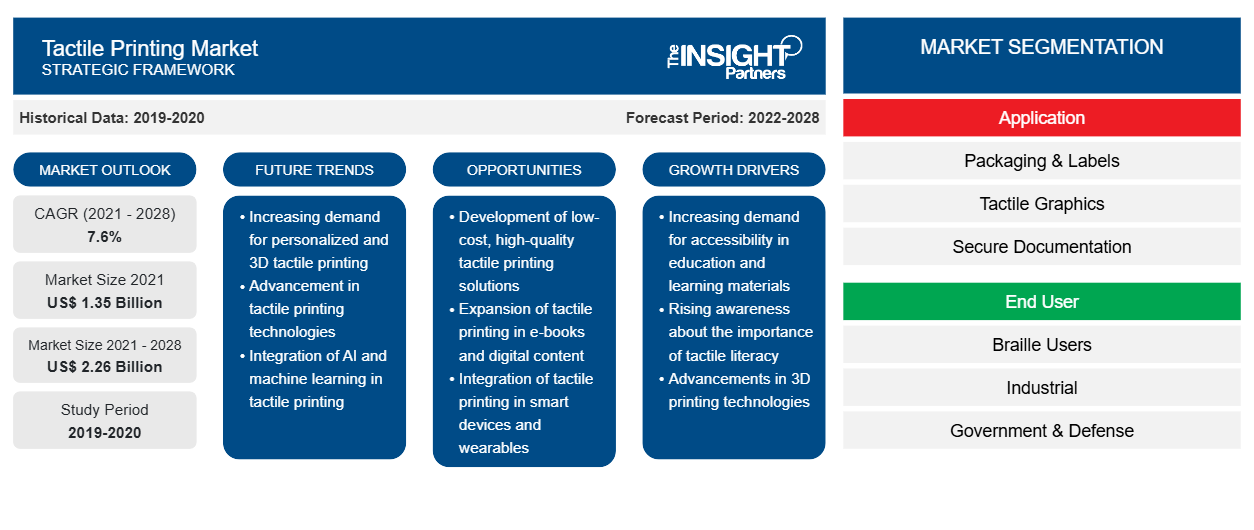
بلغت قيمة سوق الطباعة اللمسية 1,353.27 مليون دولار أمريكي في عام 2021 ومن المتوقع أن تصل إلى 2,257.92 مليون دولار أمريكي بحلول عام 2028؛ ومن المتوقع أن تنمو بمعدل نمو سنوي مركب قدره 7.6٪ من عام 2021 إلى عام 2028.
الطباعة اللمسية هي عملية إنشاء نسيج على ركيزة طباعة، والتي يمكن استشعارها باللمس. تجد الطباعة اللمسية تطبيقات مختلفة في الصناعات الدوائية، والتغليف الطبي، والخدمات الإنسانية، والعلوم الصحية، والزراعة، والخدمات، وغيرها من القطاعات. الطلب على الطباعة اللمسية مدفوع بشكل رئيسي بالاستخدام المتزايد لهذه التقنية في رسم الخرائط، ووضع العلامات، والتغليف، والأمن، والتوثيق الآمن. علاوة على ذلك، فإن زيادة الاستثمارات في تقنية الطباعة بطريقة برايل بسبب الطلب المتزايد على الحلول المخصصة مثل الألعاب المطبوعة بطريقة برايل، وأساور المعصم، والبطاقات الموسيقية، والدبابيس، والمفاتيح، وبطاقات الزيارة، وملصقات الموقع، والملصقات، وبطاقات المعايدة، والآلات الحاسبة تعمل على زيادة نمو سوق الطباعة اللمسية. مع تركيز العديد من البلدان على تشجيع توظيف الأشخاص ذوي الإعاقة البصرية، تقدم صناعة الطباعة بطريقة برايل فرصًا كبيرة للاعبين في سوق الطباعة اللمسية .
قم بتخصيص هذا التقرير ليناسب متطلباتك
ستحصل على تخصيص لأي تقرير - مجانًا - بما في ذلك أجزاء من هذا التقرير، أو تحليل على مستوى الدولة، وحزمة بيانات Excel، بالإضافة إلى الاستفادة من العروض والخصومات الرائعة للشركات الناشئة والجامعات
سوق الطباعة اللمسية: رؤى استراتيجية
- احصل على أهم اتجاهات السوق الرئيسية لهذا التقرير.ستتضمن هذه العينة المجانية تحليلاً للبيانات، بدءًا من اتجاهات السوق وحتى التقديرات والتوقعات.
تأثير جائحة كوفيد-19 على سوق الطباعة اللمسية
وبسبب الاضطرابات في العرض والطلب عبر سلسلة القيمة، تشهد الشركات العاملة في سوق الطباعة اللمسية العالمية انخفاضًا في الإيرادات ونمو الأعمال. لذلك، أدى تفشي المرض إلى تقييد النمو الإجمالي للسوق في عام 2020 إلى حد ما. ومع ذلك، نظرًا للارتفاع المتوقع في الطلب من المستخدمين التجاريين والصناعيين على مستوى العالم، من المتوقع أن يعود نمو السوق إلى طبيعته من الربع الثالث من عام 2021 ويستمر في النمو بمعدل ثابت من عام 2021 إلى عام 2028.
رؤى حول سوق الطباعة اللمسية
الطلب المتزايد على الرسومات اللمسية لتمكين الأشخاص ذوي الإعاقة البصرية
يوفر أصحاب العمل في الشركات الصغيرة والمتوسطة الحجم فرص العمل لمجموعة متنوعة من المرشحين، مع استيعاب المتنافسين من ذوي الإعاقة الجسدية في القوى العاملة. وبالتالي، فإن القطاعات مثل التسويق وإدارة الأعمال والإدارة والخدمات الإنسانية والعلوم الصحية والزراعة توظف على نطاق واسع الطامحين من ذوي الإعاقة البصرية. وتشمل العديد من القطاعات الأخرى التي توظف الأفراد ذوي الإعاقة البصرية المنظمات غير الربحية؛ والحكومات المحلية والولائية والفيدرالية؛ ورواد الأعمال العاملين لحسابهم الخاص. كما تؤثر التغييرات التشريعية وقوانين الحقوق المدنية بشكل إيجابي على فرص العمل للأفراد ذوي الإعاقة البصرية. لذلك، هناك طلب كبير على لوحات الإشارات والخرائط اللمسية لمساعدة هؤلاء الأشخاص في أماكن العمل.
رؤى السوق القائمة على التطبيقات
بناءً على التطبيق، يتم تقسيم سوق الطباعة اللمسية إلى التغليف والملصقات والرسومات اللمسية والتوثيق الآمن. قاد قطاع التغليف والملصقات السوق في عام 2020. تجد الطباعة اللمسية تطبيقًا رئيسيًا في عمليات التغليف والوسم عبر مختلف القطاعات الرأسية، مما يساعد الشركات في جذب قاعدة عملاء أوسع. تساعد مواد التغليف والملصقات المطبوعة باللمس أيضًا الأشخاص ضعاف البصر. علاوة على ذلك، يساعد استخدام الطباعة اللمسية العلامات التجارية في العرض العصري والتزيين الزخرفي في التغليف، مما يوفر حاجزًا وميزات خاصة أخرى.
اللاعبون العاملون في
الطباعة اللمسية
تتبنى الشركات في السوق استراتيجيات مثل عمليات الدمج والاستحواذ ومبادرات السوق للحفاظ على مواقعها في السوق. وفيما يلي بعض التطورات التي قام بها اللاعبون الرئيسيون:
- في عام 2020، قدمت شركة ViewPlus Technologies Inc. أقوى نقطة برايل وأكثرها قابلية للقراءة من بين أي طابعة برايل مكتبية، مع الحفاظ على شكل النقطة المستديرة المبهجة باستخدام Power-Dot Braille المتوفرة الآن. لا تزال طابعات VP Delta 2 وVP Columbia 2 تحمل رسومات لمسية عالية الدقة وطباعة برايل لمكتبة الكونجرس (LOC).
- في عام 2021، أعلنت شركة Roland DGA Corporation عن إطلاق VersaUV LEC2-640 وLEC2-330، طابعات/قاطعات UV من الجيل التالي والمصممة بشكل فريد لرفع إنتاج الملصقات والتعبئة واللافتات والعروض والديكور الداخلي إلى مستوى آخر.
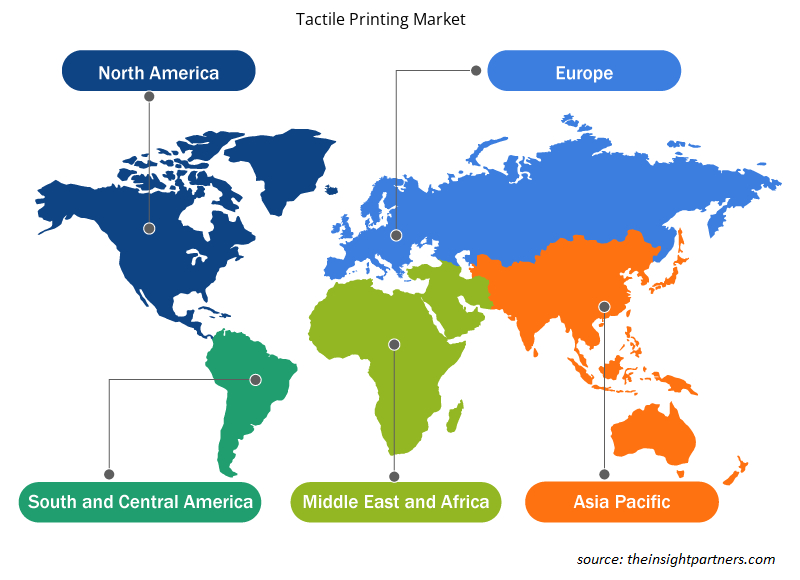
رؤى إقليمية حول سوق الطباعة اللمسية
لقد قام المحللون في Insight Partners بشرح الاتجاهات والعوامل الإقليمية المؤثرة على سوق الطباعة اللمسية طوال فترة التوقعات بشكل شامل. يناقش هذا القسم أيضًا قطاعات سوق الطباعة اللمسية والجغرافيا في جميع أنحاء أمريكا الشمالية وأوروبا ومنطقة آسيا والمحيط الهادئ والشرق الأوسط وأفريقيا وأمريكا الجنوبية والوسطى.
- احصل على البيانات الإقليمية المحددة لسوق الطباعة اللمسية
نطاق تقرير سوق الطباعة اللمسية
| سمة التقرير | تفاصيل |
|---|---|
| حجم السوق في عام 2021 | 1.35 مليار دولار أمريكي |
| حجم السوق بحلول عام 2028 | 2.26 مليار دولار أمريكي |
| معدل النمو السنوي المركب العالمي (2021 - 2028) | 7.6% |
| البيانات التاريخية | 2019-2020 |
| فترة التنبؤ | 2022-2028 |
| القطاعات المغطاة | حسب الطلب
|
| المناطق والدول المغطاة | أمريكا الشمالية
|
| قادة السوق وملفات تعريف الشركات الرئيسية |
|
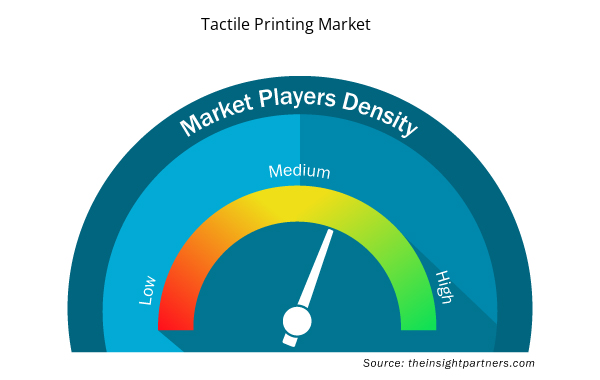
كثافة اللاعبين في السوق: فهم تأثيرها على ديناميكيات الأعمال
يشهد سوق الطباعة اللمسية نموًا سريعًا، مدفوعًا بالطلب المتزايد من المستخدم النهائي بسبب عوامل مثل تفضيلات المستهلك المتطورة والتقدم التكنولوجي والوعي المتزايد بفوائد المنتج. ومع ارتفاع الطلب، تعمل الشركات على توسيع عروضها والابتكار لتلبية احتياجات المستهلكين والاستفادة من الاتجاهات الناشئة، مما يؤدي إلى زيادة نمو السوق.
تشير كثافة اللاعبين في السوق إلى توزيع الشركات أو المؤسسات العاملة في سوق أو صناعة معينة. وهي تشير إلى عدد المنافسين (اللاعبين في السوق) الموجودين في مساحة سوق معينة نسبة إلى حجمها أو قيمتها السوقية الإجمالية.
الشركات الرئيسية العاملة في سوق الطباعة اللمسية هي:
- ألتيكس
- شركة كونيكا مينولتا
- شركة رينك للطباعة
- شركة سترودي للطباعة والتصميم المحدودة
- ثيرموفورم امريكي
إخلاء المسؤولية : الشركات المذكورة أعلاه ليست مرتبة بأي ترتيب معين.
- احصل على نظرة عامة على أهم اللاعبين الرئيسيين في سوق الطباعة اللمسية
تم تقسيم سوق الطباعة اللمسية على النحو التالي:
سوق الطباعة اللمسية – حسب التطبيق
- التغليف والملصقات
- الرسومات اللمسية
- توثيق آمن
سوق الطباعة اللمسية – حسب المستخدم النهائي
- مستخدمو برايل
- صناعي
- الحكومة والدفاع
سوق الطباعة اللمسية – حسب المنطقة الجغرافية
أمريكا الشمالية
- نحن
- كندا
- المكسيك
أوروبا
- المانيا
- فرنسا
- إيطاليا
- المملكة المتحدة
- روسيا
- بقية أوروبا
آسيا والمحيط الهادئ (APAC)
- أستراليا
- الصين
- الهند
- اليابان
- كوريا الجنوبية
- بقية منطقة آسيا والمحيط الهادئ
الشرق الأوسط وأفريقيا
- جنوب أفريقيا
- المملكة العربية السعودية
- الامارات العربية المتحدة
- باقي منطقة الشرق الأوسط وأفريقيا
أمريكا الجنوبية (SAM)
- البرازيل
- الأرجنتين
- بقية سام
نبذة عن الشركة
- ألتيكس
- شركة كونيكا مينولتا
- شركة رينك للطباعة
- شركة سترودي للطباعة والتصميم المحدودة
- ثيرموفورم امريكي
- شركة كانون
- فهرس برايل
- كانيماتسو الولايات المتحدة الأمريكية
- شركة فيو بلس للتكنولوجيا
- شركة رولاند دي جي

نافين خبيرٌ متمرسٌ في أبحاث السوق والاستشارات، يتمتع بخبرةٍ تزيد عن 9 سنوات في مشاريع مُخصصة ومُشتركة واستشارية. يشغل حاليًا منصب نائب الرئيس المساعد، وقد نجح في إدارة أصحاب المصلحة عبر سلسلة قيمة المشاريع، وألّف أكثر من 100 تقرير بحثي وأكثر من 30 مهمة استشارية. يمتد نطاق عمله ليشمل مشاريع صناعية وحكومية، مساهمًا بشكل كبير في نجاح العملاء واتخاذ القرارات القائمة على البيانات.
نافين حاصلٌ على شهادة في هندسة الإلكترونيات والاتصالات من جامعة فرجينيا التقنية، كارناتاكا، وشهادة ماجستير في إدارة الأعمال في التسويق والعمليات من جامعة مانيبال. وهو عضوٌ نشطٌ في معهد مهندسي الكهرباء والإلكترونيات (IEEE) لمدة 9 سنوات، حيث شارك في مؤتمراتٍ وندواتٍ تقنية، وتطوّع على مستوى الأقسام والمناطق. قبل منصبه الحالي، عمل مستشارًا استراتيجيًا مساعدًا في IndustryARC، ومستشارًا للخوادم الصناعية في شركة هيوليت باكارد (HP Global).
- التحليل التاريخي (سنتان)، سنة الأساس، التوقعات (7 سنوات) مع معدل النمو السنوي المركب
- تحليل PEST و SWOT
- حجم السوق والقيمة / الحجم - عالمي، إقليمي، بلد
- الصناعة والمنافسة
- مجموعة بيانات إكسل
التقارير الحديثة
تقارير ذات صلة
شهادات العملاء
تقرير سوق أنظمة SCADA من Insight Partners شامل، ويقدم رؤى قيّمة حول الاتجاهات الحالية والتوقعات المستقبلية. تميّز الفريق باحترافية عالية وسرعة في الاستجابة ودعم مستمر طوال الوقت. نحن راضون جدًا ونوصي بشدة بخدماتهم.
ران كيديم شريك, شركة ريالي تكنولوجيز المحدودةطلبتُ تقريرًا عن سوق برمجيات محدد، وأعدّه الفريق في غضون أيام قليلة. كانت المعلومات ذات صلة وثيقة وعرضها جيد. ثم طلبتُ بعض التعديلات والإضافات على التقرير. وكان الفريق متجاوبًا للغاية، وحصلتُ على التقرير النهائي في أقل من أسبوع.
جان هيرفيه جين رئيس مجلس الإدارة, فيوتشر أناليتيكاعملنا مع شركة "إنسايت بارتنرز" لإجراء دراسة سوقية وتوقعات مهمة. زودونا برؤى واضحة حول الفرص والمخاطر، مما ساعدنا في صياغة خططنا. كانت أبحاثهم سهلة الاستخدام ومبنية على بيانات دقيقة، مما ساعدنا على اتخاذ قرارات ذكية وواثقة. نوصي بهم بشدة.
بيوش ناجبال نائب الرئيس الأول, شعاع عالي عالميقدّمت شركة Insight Partners أبحاثًا سوقية ثاقبة ومنظمة جيدًا بخبرة واسعة في هذا المجال. تميّز فريقهم بالاحترافية وسرعة الاستجابة طوال الوقت. وسهّل موقعهم الإلكتروني سهل الاستخدام الوصول إلى تقارير القطاع. نوصي بهم بشدة لخدمات بحثية موثوقة وعالية الجودة.
يوكيهيكو أداتشي المدير التنفيذي, ديب بلو، ذ.م.م.هذه أول مرة أشتري فيها تقرير سوق من The Insight Partners. رغم أنني كنت مترددًا في البداية، إلا أنني زرت موقعهم الإلكتروني وشعرت براحة أكبر للمخاطرة وشراء تقرير السوق. أنا راضٍ تمامًا عن جودة التقرير وخدمة العملاء. كانت لديّ عدة أسئلة وتعليقات حول التقرير الأولي، ولكن بعد بضع محادثات عبر البريد الإلكتروني مع محللهم، أعتقد أن لديّ تقريرًا يمكنني استخدامه كمدخل لعملية التخطيط الاستراتيجي لدينا. شكرًا جزيلاً لكم على تخصيص وقتكم الإضافي وجعل هذه التجربة إيجابية. سأوصي بخدماتكم للآخرين بالتأكيد، وستكونون أول من ألجأ إليه عندما نحتاج إلى المزيد من بيانات السوق.
جون سوزوكي الرئيس والرئيس التنفيذي وعضو مجلس الإدارة, بي كيه تكنولوجيزأود أن أقدّر دعمكم واحترافيتكم في الاستجابة لطلبي للحصول على معلومات بشأن سوق التشخيص المخبري للأمراض المعدية في نيجيريا. كما أُقدّر صبركم وتوجيهكم، واستعدادكم لتقديم خصم، مما مكّننا في النهاية من إتمام الصفقة. أتطلع إلى التعامل مع "ذا إنسايت بارتنرز" مستقبلًا، كل ذلك بفضل الانطباع الذي تركتموه لديّ نتيجةً لهذا اللقاء الأول.
الدكتور تشيجيوك أونيا المدير الإداري, شركة باينكريست للرعاية الصحية المحدودةسبب الشراء
- اتخاذ قرارات مدروسة
- فهم ديناميكيات السوق
- تحليل المنافسة
- رؤى العملاء
- توقعات السوق
- تخفيف المخاطر
- التخطيط الاستراتيجي
- مبررات الاستثمار
- تحديد الأسواق الناشئة
- تحسين استراتيجيات التسويق
- تعزيز الكفاءة التشغيلية
- مواكبة التوجهات التنظيمية


 احصل على عينة مجانية ل - سوق الطباعة اللمسية