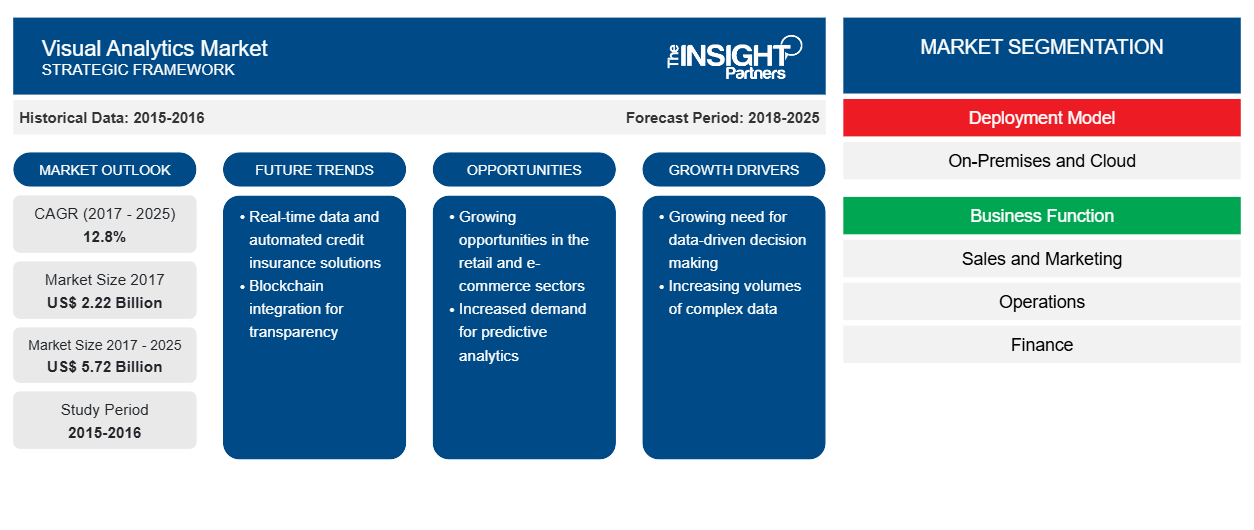
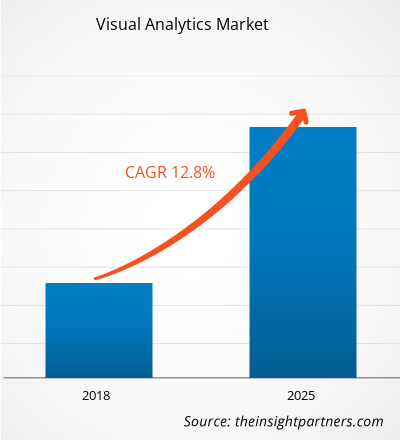
[تقرير بحثي] تم تقييم سوق التحليلات المرئية بمبلغ 2215.0 مليون دولار أمريكي في عام 2017 ومن المتوقع أن تصل إلى 5718.6 مليون دولار أمريكي بحلول عام 2025. ومن المتوقع أن ينمو سوق التحليلات المرئية بمعدل نمو سنوي مركب قدره 12.8٪ خلال الفترة المتوقعة من 2017 إلى 2025.
إن الجمع بين التصور والتحليل التفاعلي لاستكشاف مجموعة كبيرة من البيانات هو الهدف الشامل لحلول التحليلات البصرية. بعبارة أخرى، التحليلات البصرية هي علم التفكير التحليلي الذي تسهله واجهات بصرية تفاعلية. وبصورة أكثر دقة، التحليلات البصرية هي عملية تكرارية تتضمن جمع المعلومات ومعالجة البيانات مسبقًا وتمثيل المعرفة والتفاعل واتخاذ القرار. والهدف النهائي هو اكتساب نظرة ثاقبة للمشكلة المطروحة والتي يتم وصفها بكميات هائلة من البيانات العلمية أو الجنائية أو التجارية من مصادر غير متجانسة. لتحقيق هذا الهدف، تجمع التحليلات البصرية بين نقاط قوة الآلات ونقاط قوة البشر. من ناحية، تشكل الأساليب المستمدة من اكتشاف المعرفة في قواعد البيانات (KDD) والإحصاء والرياضيات القوة الدافعة على جانب التحليل التلقائي، بينما من ناحية أخرى، تحول القدرات البشرية على الإدراك والربط والاستنتاج التحليلات البصرية إلى مجال بحث واعد للغاية. اليوم، لم يعد التصور المرئي للبيانات كافيًا، وتتطلع الشركات إلى قدرات التحليلات القائمة على البيانات والمتكاملة مع التصور المرئي للبيانات. يمكن تفسير التحليلات البصرية على أنها تشكيل استعارات بصرية فكرية مقترنة بالتفاعل اليدوي للمعلومات.
تم تقسيم سوق التحليلات المرئية على أساس نموذج النشر ووظيفة العمل والقطاع الرأسي. بناءً على نموذج النشر، تم تقسيم سوق التحليلات المرئية إلى محلي وسحابي. بناءً على وظيفة العمل، تم تقسيم سوق التحليلات المرئية إلى المبيعات والتسويق والعمليات والتمويل وسلسلة التوريد وتكنولوجيا المعلومات وإدارة علاقات العملاء والموارد البشرية. يتم تقسيم السوق بشكل أكبر على أساس عمودي إلى سلع التجزئة والاستهلاك وتكنولوجيا المعلومات والاتصالات والخدمات المصرفية والمالية والتأمين والتصنيع والطاقة والمرافق والرعاية الصحية والحكومة. جغرافيًا، يتم تجزئة السوق إلى خمس مناطق، بما في ذلك أمريكا الشمالية وأوروبا وآسيا والمحيط الهادئ والشرق الأوسط وأفريقيا وأمريكا الجنوبية.
قم بتخصيص هذا التقرير ليناسب متطلباتك
ستحصل على تخصيص لأي تقرير - مجانًا - بما في ذلك أجزاء من هذا التقرير، أو تحليل على مستوى الدولة، وحزمة بيانات Excel، بالإضافة إلى الاستفادة من العروض والخصومات الرائعة للشركات الناشئة والجامعات
سوق التحليلات البصرية:
- احصل على أهم اتجاهات السوق الرئيسية لهذا التقرير.ستتضمن هذه العينة المجانية تحليلاً للبيانات، بدءًا من اتجاهات السوق وحتى التقديرات والتوقعات.
رؤى السوق للتحليلات البصرية
انتشار الذكاء الاصطناعي والتعلم الآلي على مستوى العالم
إن الاتجاه الأكبر الذي يؤثر على ابتكارات تحليل البيانات وتصورها اليوم هو انتشار الذكاء الاصطناعي والتعلم الآلي. ورغم أن الأمر قد يبدو مخيفًا بالنسبة لأقسام تكنولوجيا المعلومات والمحللين الذين يترددون في التخلي عن السيطرة البشرية، فإن المنصات التحليلية التي تتضمن قدرات الذكاء الاصطناعي والتعلم الآلي ستعمل في الواقع كمساعد فعال للغاية للمحللين المعاصرين. ورغم أنه قد يكون هناك قلق بشأن استبدالها، فإن التعلم الآلي سيعمل في الواقع على تعزيز قدرات المحللين وجعلهم أكثر كفاءة ودقة وتأثيرًا على الأعمال. وبدلاً من الخوف من تكنولوجيا التعلم الآلي، اغتنم الفرص التي تقدمها.
رؤى السوق المستندة إلى نموذج النشر
يتألف التحليل المرئي من نموذج نشر سحابي ونموذج نشر محلي. يعد نموذج نشر التحليل المرئي قرارًا بالغ الأهمية لاتخاذ قرار بشأن نموذج معين للاختيار. تفضل الشركات كلاً من نموذجي النشر السحابي والمحلي اعتمادًا على عوامل مختلفة. يفضل العديد من الشركات الصغيرة والمتوسطة الحجم الطلب على التحليل المرئي المستند إلى السحابة باعتباره أفضل نوع نشر لأنه يأتي بأسعار غير مكلفة.
رؤى السوق المستندة إلى وظيفة الأعمال
لقد أدى التحول النموذجي في مناهج الأعمال إلى زيادة الطلب على دمج برامج التحليلات المختلفة في العمليات التجارية من قبل مختلف القطاعات الصناعية، في جميع أنحاء العالم وخاصة في المناطق المتقدمة. لقد حقق مستخدمو الأعمال اليوم قفزات من تقنيات إدارة البيانات ومعالجتها وتحليلها التقليدية. تتطلب وظائف الأعمال المختلفة في قطاع معين تحليل البيانات لأغراض مختلفة.
رؤى السوق القائمة على القطاعات العمودية
الوظيفة الأساسية لأي أداة تحليل بصري هي أخذ البيانات المعقدة وتقديمها للمستخدم بطريقة تجعلها تفاعلية للغاية وسهلة الفهم. تتطلب أدوات التحليل البصري أداء مهمتين أساسيتين تتضمنان تصور البيانات ثم تحليل تلك البيانات. لن يكون التصور البسيط كافياً لحل مشكلات تبسيط حجم كبير من البيانات. تعد سهولة استخدام هذه الأدوات، والفعالية من حيث التكلفة، والقدرة على تخصيص أدوات التحليل البصري، وواجهات المستخدم التفاعلية، ولوحات المعلومات، وخيارات التصفية من بين المعايير التي تساعد المستخدمين النهائيين على اتخاذ قرار بشأن اختيار أداة تحليل بصرية معينة لوظيفة أعمالهم.
يركز اللاعبون العاملون في سوق التحليلات المرئية على الاستراتيجيات، مثل مبادرات السوق، والاستحواذات، وإطلاق المنتجات، للحفاظ على مواقعهم في سوق التحليلات المرئية. فيما يلي بعض التطورات التي قام بها اللاعبون الرئيسيون في سوق التحليلات المرئية:
في سبتمبر 2018، قدمت شركة TIBCO تجربة A(X) لـ TIBCO Spotfire والتي ستسمح بإجراء تحليلات بصرية في الوقت الفعلي على تدفقات البيانات مما يسمح بالوعي والإجراءات في الوقت الفعلي.
في سبتمبر 2018، قدمت شركة SAP SE خدمة SAP Analytics Cloud، وهي عبارة عن سحابة واحدة بسيطة لجميع التحليلات. توفر هذه السحابة التحليلية لعملائها تكاملاً شاملاً لتصور البيانات والقدرات التنبؤية والتخطيطية.
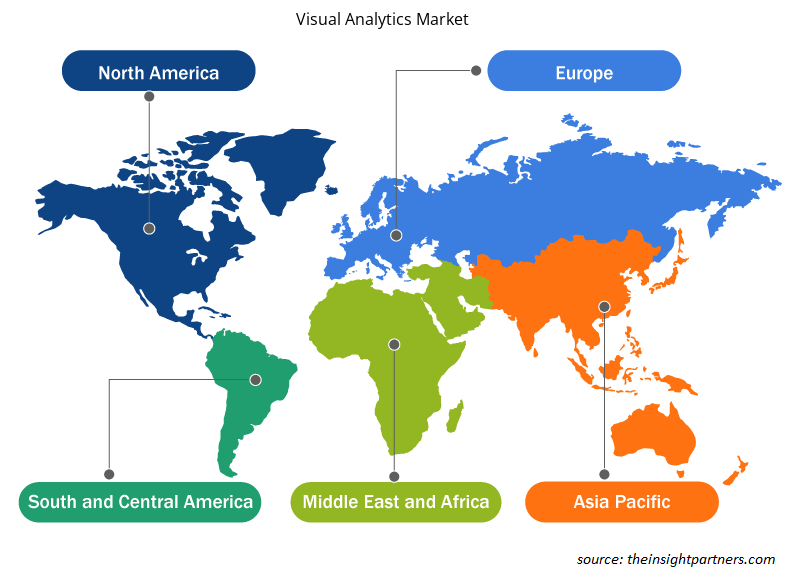
رؤى إقليمية حول سوق التحليلات البصرية
لقد قام المحللون في Insight Partners بشرح الاتجاهات والعوامل الإقليمية المؤثرة على سوق التحليلات المرئية طوال فترة التوقعات بشكل شامل. يناقش هذا القسم أيضًا قطاعات سوق التحليلات المرئية والجغرافيا في جميع أنحاء أمريكا الشمالية وأوروبا ومنطقة آسيا والمحيط الهادئ والشرق الأوسط وأفريقيا وأمريكا الجنوبية والوسطى.
- احصل على بيانات إقليمية محددة لسوق التحليلات البصرية
نطاق تقرير سوق التحليلات البصرية
| سمة التقرير | تفاصيل |
|---|---|
| حجم السوق في عام 2017 | 2.22 مليار دولار أمريكي |
| حجم السوق بحلول عام 2025 | 5.72 مليار دولار أمريكي |
| معدل النمو السنوي المركب العالمي (2017 - 2025) | 12.8% |
| البيانات التاريخية | 2015-2016 |
| فترة التنبؤ | 2018-2025 |
| القطاعات المغطاة | حسب نموذج النشر
|
| المناطق والدول المغطاة | أمريكا الشمالية
|
| قادة السوق وملفات تعريف الشركات الرئيسية |
|
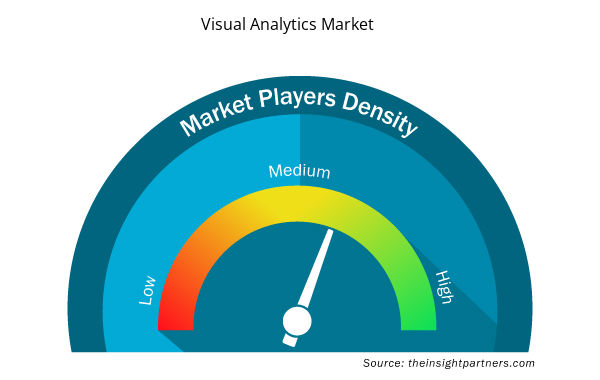
كثافة اللاعبين في السوق: فهم تأثيرها على ديناميكيات الأعمال
يشهد سوق التحليلات المرئية نموًا سريعًا، مدفوعًا بالطلب المتزايد من المستخدم النهائي بسبب عوامل مثل تفضيلات المستهلك المتطورة والتقدم التكنولوجي والوعي المتزايد بفوائد المنتج. ومع ارتفاع الطلب، تعمل الشركات على توسيع عروضها والابتكار لتلبية احتياجات المستهلكين والاستفادة من الاتجاهات الناشئة، مما يؤدي إلى زيادة نمو السوق.
تشير كثافة اللاعبين في السوق إلى توزيع الشركات أو المؤسسات العاملة في سوق أو صناعة معينة. وهي تشير إلى عدد المنافسين (اللاعبين في السوق) الموجودين في مساحة سوق معينة نسبة إلى حجمها أو قيمتها السوقية الإجمالية.
الشركات الرئيسية العاملة في سوق التحليلات البصرية هي:
- برنامج Tableau
- ساب اس اي
- كليك تكنولوجيز
- برمجيات تيبكو
- شركة ADVIZOR Solutions Pvt. Ltd
إخلاء المسؤولية : الشركات المذكورة أعلاه ليست مرتبة بأي ترتيب معين.
- احصل على نظرة عامة على أهم اللاعبين الرئيسيين في سوق التحليلات المرئية
سوق التحليلات المرئية – حسب نموذج النشر
- في الموقع
- سحاب
سوق التحليلات البصرية – حسب وظيفة العمل
- المبيعات والتسويق
- العمليات
- تمويل
- الموردين
- تكنولوجيا المعلومات
- إدارة علاقات العملاء
- الموارد البشرية
- آحرون
سوق التحليلات البصرية – حسب القطاعات
- سوق التجزئة والسلع الاستهلاكية
- تكنولوجيا المعلومات والاتصالات
- الخدمات المالية والمصرفية والتأمين
- تصنيع
- الطاقة والمرافق
- آحرون
- الرعاية الصحية
- حكومة
سوق التحليلات البصرية – حسب المنطقة الجغرافية
أمريكا الشمالية
- نحن
- كندا
- المكسيك
أوروبا
- فرنسا
- ألمانيا
- إسبانيا
- المملكة المتحدة
- إيطاليا
آسيا والمحيط الهادئ (APAC)
- الصين
- الهند
- اليابان
- أستراليا
الشرق الأوسط وأفريقيا
- المملكة العربية السعودية
- الامارات العربية المتحدة
- جنوب أفريقيا
سام
- البرازيل
سوق التحليلات البصرية – نبذة عن الشركة
- شركة ADVIZOR للحلول
- شركة ألتريكس
- شركة آي بي إم
- شركة مايكروستراتيجي
- شركة أوراكل
- شركة كليك للتكنولوجيا
- نظام SAP
- معهد SAS
- برنامج Tableau
- شركة تيبكو للبرمجيات
- التحليل التاريخي (سنتان)، السنة الأساسية، التوقعات (7 سنوات) مع معدل النمو السنوي المركب
- تحليل PEST و SWOT
- حجم السوق والقيمة / الحجم - عالميًا وإقليميًا وقطريًا
- الصناعة والمنافسة
- مجموعة بيانات Excel


Report Coverage
Revenue forecast, Company Analysis, Industry landscape, Growth factors, and Trends

Segment Covered
This text is related
to segments covered.

Regional Scope
North America, Europe, Asia Pacific, Middle East & Africa, South & Central America

Country Scope
This text is related
to country scope.
The List of Companies
1. Tableau Software
2. SAP SE
3. Qlik Technologies
4. TIBCO Software
5. ADVIZOR Solutions Pvt. Ltd
6. SAS Institute
7. Oracle Corporation
8. MicroStrategy
9. IBM Corporation
10. Alteryx, Inc.
The Insight Partners performs research in 4 major stages: Data Collection & Secondary Research, Primary Research, Data Analysis and Data Triangulation & Final Review.
- Data Collection and Secondary Research:
As a market research and consulting firm operating from a decade, we have published and advised several client across the globe. First step for any study will start with an assessment of currently available data and insights from existing reports. Further, historical and current market information is collected from Investor Presentations, Annual Reports, SEC Filings, etc., and other information related to company’s performance and market positioning are gathered from Paid Databases (Factiva, Hoovers, and Reuters) and various other publications available in public domain.
Several associations trade associates, technical forums, institutes, societies and organization are accessed to gain technical as well as market related insights through their publications such as research papers, blogs and press releases related to the studies are referred to get cues about the market. Further, white papers, journals, magazines, and other news articles published in last 3 years are scrutinized and analyzed to understand the current market trends.
- Primary Research:
The primarily interview analysis comprise of data obtained from industry participants interview and answers to survey questions gathered by in-house primary team.
For primary research, interviews are conducted with industry experts/CEOs/Marketing Managers/VPs/Subject Matter Experts from both demand and supply side to get a 360-degree view of the market. The primary team conducts several interviews based on the complexity of the markets to understand the various market trends and dynamics which makes research more credible and precise.
A typical research interview fulfils the following functions:
- Provides first-hand information on the market size, market trends, growth trends, competitive landscape, and outlook
- Validates and strengthens in-house secondary research findings
- Develops the analysis team’s expertise and market understanding
Primary research involves email interactions and telephone interviews for each market, category, segment, and sub-segment across geographies. The participants who typically take part in such a process include, but are not limited to:
- Industry participants: VPs, business development managers, market intelligence managers and national sales managers
- Outside experts: Valuation experts, research analysts and key opinion leaders specializing in the electronics and semiconductor industry.
Below is the breakup of our primary respondents by company, designation, and region:

Once we receive the confirmation from primary research sources or primary respondents, we finalize the base year market estimation and forecast the data as per the macroeconomic and microeconomic factors assessed during data collection.
- Data Analysis:
Once data is validated through both secondary as well as primary respondents, we finalize the market estimations by hypothesis formulation and factor analysis at regional and country level.
- Macro-Economic Factor Analysis:
We analyse macroeconomic indicators such the gross domestic product (GDP), increase in the demand for goods and services across industries, technological advancement, regional economic growth, governmental policies, the influence of COVID-19, PEST analysis, and other aspects. This analysis aids in setting benchmarks for various nations/regions and approximating market splits. Additionally, the general trend of the aforementioned components aid in determining the market's development possibilities.
- Country Level Data:
Various factors that are especially aligned to the country are taken into account to determine the market size for a certain area and country, including the presence of vendors, such as headquarters and offices, the country's GDP, demand patterns, and industry growth. To comprehend the market dynamics for the nation, a number of growth variables, inhibitors, application areas, and current market trends are researched. The aforementioned elements aid in determining the country's overall market's growth potential.
- Company Profile:
The “Table of Contents” is formulated by listing and analyzing more than 25 - 30 companies operating in the market ecosystem across geographies. However, we profile only 10 companies as a standard practice in our syndicate reports. These 10 companies comprise leading, emerging, and regional players. Nonetheless, our analysis is not restricted to the 10 listed companies, we also analyze other companies present in the market to develop a holistic view and understand the prevailing trends. The “Company Profiles” section in the report covers key facts, business description, products & services, financial information, SWOT analysis, and key developments. The financial information presented is extracted from the annual reports and official documents of the publicly listed companies. Upon collecting the information for the sections of respective companies, we verify them via various primary sources and then compile the data in respective company profiles. The company level information helps us in deriving the base number as well as in forecasting the market size.
- Developing Base Number:
Aggregation of sales statistics (2020-2022) and macro-economic factor, and other secondary and primary research insights are utilized to arrive at base number and related market shares for 2022. The data gaps are identified in this step and relevant market data is analyzed, collected from paid primary interviews or databases. On finalizing the base year market size, forecasts are developed on the basis of macro-economic, industry and market growth factors and company level analysis.
- Data Triangulation and Final Review:
The market findings and base year market size calculations are validated from supply as well as demand side. Demand side validations are based on macro-economic factor analysis and benchmarks for respective regions and countries. In case of supply side validations, revenues of major companies are estimated (in case not available) based on industry benchmark, approximate number of employees, product portfolio, and primary interviews revenues are gathered. Further revenue from target product/service segment is assessed to avoid overshooting of market statistics. In case of heavy deviations between supply and demand side values, all thes steps are repeated to achieve synchronization.
We follow an iterative model, wherein we share our research findings with Subject Matter Experts (SME’s) and Key Opinion Leaders (KOLs) until consensus view of the market is not formulated – this model negates any drastic deviation in the opinions of experts. Only validated and universally acceptable research findings are quoted in our reports.
We have important check points that we use to validate our research findings – which we call – data triangulation, where we validate the information, we generate from secondary sources with primary interviews and then we re-validate with our internal data bases and Subject matter experts. This comprehensive model enables us to deliver high quality, reliable data in shortest possible time.
 احصل على عينة مجانية لهذا التقرير