Marktübersicht für 3D-Sensoren, Wachstum, Trends, Analyse, Forschungsbericht (2018-2027)
Markt für 3D-Sensoren bis 2027 – Globale Analyse und Prognosen nach Technologie (Stereovision, Time-of-Flight und strukturiertes Licht); Endbenutzer-Vertikalen (Gesundheitswesen, Luft- und Raumfahrt, Industrie, Automobil, Unterhaltungselektronik und andere)
- Status : Veröffentlicht
- Berichtscode : TIPTE100000302
- Kategorie : Elektronik und Halbleiter
- Anzahl der Seiten : 150
- Verfügbare Berichtsformate :


- Datum der letzten Aktualisierung : June 12, 2024


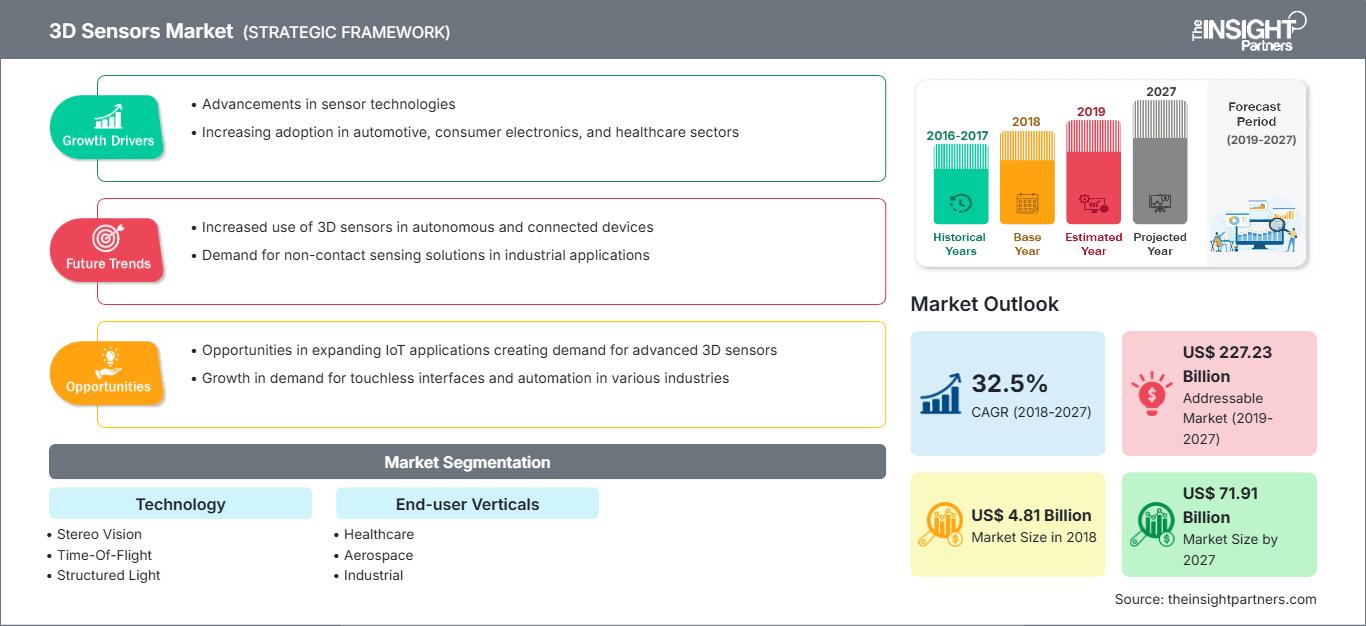
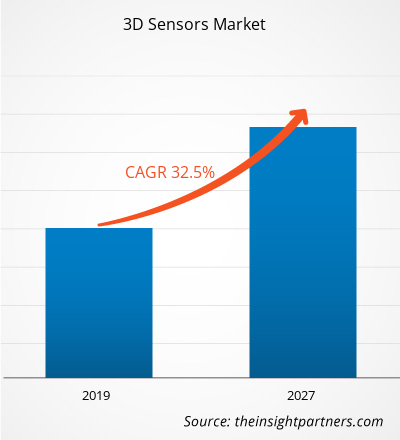
[Forschungsbericht]Der Markt für 3D-Sensoren wurde 2018 auf 4.805,7 Millionen US-Dollar geschätzt und soll bis 2027 voraussichtlich 71.914,2 Millionen US-Dollar erreichen; für den Zeitraum 2019–2027 wird ein durchschnittliches jährliches Wachstum von 32,5 % erwartet.
3D-Sensoren verwenden Aktivbereichssensoren, die Tiefenbilder mit hoher Bildrate liefern. Diese Kameras sind mit einer IR-Lichtquelle ausgestattet, die das Feld beleuchtet, und einem CMOS/CCD-Sensor, der das reflektierte IR-Licht erfasst. Die Tiefenmessung basiert auf dem ToF-Prinzip; die Tiefe ist somit proportional zur Zeit, die das IR-Signal benötigt, um das Objekt oder Beobachtungsfeld zu erreichen und wieder zurückzukehren. Die für jedes Pixel des Sensors ermittelten Tiefenmessungen ergeben zusammen ein Tiefenbild. Die schnelle Erfassung von Tiefenbildern ist in zahlreichen Endbenutzerbranchen von großem Nutzen, beispielsweise in der Robotik, der Mensch-Maschine-Interaktion und der Szenenmodellierung. Leider haben viele der derzeit verfügbaren ToF-Kameras eine niedrige Auflösung und sind mit verschiedenen Messfehlern behaftet, darunter sensorbedingtes Rauschen, systematische Wackelfehler aufgrund der Schwierigkeit, sinusförmige Signale zu erzeugen, nichtlineare Tiefenabweichungen abhängig von Reflektivität und Integrationszeit sowie fliegende Pixel, die durch die Überlagerung von Signalen an Tiefeninhomogenitäten (Kanten) entstehen. Daher liefern ToF-Sensoren genaue und präzise Tiefenmessungen. Die derzeit verfügbaren Multi-ToF-Sensorsysteme konzentrieren sich auf die Kombination von Tiefenbildern zur Erstellung von 3D-Rekonstruktionen, indem sie sich auf Belegungswahrscheinlichkeitsraster stützen oder die aus verschiedenen Ansichten generierten Punktwolken registrieren usw.
ToF-Techniken werden seit mehr als einem Jahrzehnt zur Entfernungsmessung eingesetzt. SONAR und RADAR sind die beiden Techniken, die Ton- und Funksignale nach ToF-Prinzipien nutzen, insbesondere in der Luft- und Raumfahrt. In jüngerer Zeit ist es mit der Verbesserung und Weiterentwicklung elektronischer Geräte möglich geworden, Lichtsignale für ToF-Systeme zu nutzen. Es gibt zahlreiche Endnutzerbranchen, die ein solches System nutzen, insbesondere im Industrie- und Verbraucherbereich. Generell gibt es zwei Techniken zur Entfernungsmessung mit modernen ToF-Sensoren: Pulsmodulation oder Dauerstrichmodulation (CW). Moderne ToF-Systeme nutzen Mehrfrequenztechnologien und kombinieren mehrere Modulationsfrequenzen.
Passen Sie diesen Bericht Ihren Anforderungen an
Sie erhalten kostenlos Anpassungen an jedem Bericht, einschließlich Teilen dieses Berichts oder einer Analyse auf Länderebene, eines Excel-Datenpakets sowie tolle Angebote und Rabatte für Start-ups und Universitäten.
Markt für 3D-Sensoren: Strategische Einblicke
-
Holen Sie sich die wichtigsten Markttrends aus diesem Bericht.Dieses KOSTENLOSE Beispiel umfasst Datenanalysen, die von Markttrends bis hin zu Schätzungen und Prognosen reichen.
Die Unterhaltungselektronikbranche erlebt sowohl in Industrie- als auch in Entwicklungsländern ein enormes Wachstum. Die von den Herstellern angebotenen Weiterentwicklungen und intelligenten Funktionen haben maßgeblich zu diesem Wachstum beigetragen.
Derzeit werden verschiedene Geräte der Unterhaltungselektronik von Einzelpersonen für eine Vielzahl von Aufgaben verwendet. Unterhaltungselektronik wie Smartphones, Tablets, PCs, Fernseher, Waschmaschinen, Kühlschränke und Musikplayer sind zu einem festen Bestandteil des täglichen Lebens geworden. All diese Geräte werden mit den fortlaufenden technologischen Fortschritten und der Integration des Internets der Dinge (IoT) und der künstlichen Intelligenz (KI) immer intelligenter. Die Fortschritte in der Sensortechnologie haben den Weg für ein bemerkenswertes Wachstum von IoT und KI in den meisten Technologiebereichen, einschließlich der Automobilbranche, geebnet. Der Markt für Geräte der Unterhaltungselektronik wächst ständig, da die Hersteller regelmäßig fortschrittliche Technologien und Funktionen in ihre Geräte integrieren und das verfügbare Einkommen der Nutzer in Industrie- und Entwicklungsländern steigt.
Einige der führenden Smartphone-Hersteller haben als Erste 3D-ToF-Sensoren in ihre Smartphone-Modelle integriert. Führende globale Smartphone-Hersteller wie Huawei, Samsung, Oppo, LG und Apple sind Pioniere bei der Integration von 3D-ToF-Sensoren in verschiedene Modelle. Die Modelle Huawei P30 Pro, Samsung Galaxy S10 5G, Oppo RX17 Pro, Honor View 20, LG G8 ThinQ und iPhone 2020 haben 3D-ToF-Sensoren integriert oder planen deren Integration.
Einblicke in die Segmente der Endnutzerbranchen
Basierend auf den Endnutzerbranchen ist der Markt für 3D-Sensoren in die Bereiche Gesundheitswesen, Luft- und Raumfahrt, Industrie, Automobil, Unterhaltungselektronik und andere unterteilt. Früher sperrige Geräte werden heute leichter und miniaturisiert und verfügen über Sensoren, die Formen in Echtzeit erfassen können. Aufgrund des rasanten technologischen Fortschritts entstehen zahlreiche neue Anwendungen auf dem Markt. Diese Technologien bieten enorme Chancen in verschiedenen Branchen, in denen 3D-Sensoren eingesetzt werden können, beispielsweise in der Automobilindustrie, der Verteidigungsindustrie, dem Gesundheitswesen, der Luft- und Raumfahrt, der Robotik, der Elektronik, der Halbleiterindustrie und dem Einzelhandel. Unternehmen gehen Partnerschaften ein und intensivieren ihre gemeinsamen Anstrengungen, um mehr 3D-Anwendungen zu entwickeln.
Einblicke in das Technologiesegment
Technologischerseits ist der Markt für 3D-Sensoren in Stereovision, Time-of-Flight und strukturiertes Licht unterteilt. 3D-Sensoren spielen eine zentrale Rolle in der Tiefensensorik, um Geräte in der realen Welt zu verbinden. Kontinuierliche Fortschritte bei 3D-Sensoren durch umfassende Forschung und Entwicklung haben die Kreativität auf dem Markt für 3D-Sensoren beflügelt. Neben der Automobilindustrie, dem Gesundheitswesen, der Robotik und der Verteidigung finden 3D-Sensoren breite Anwendung in der Unterhaltungselektronik wie Fernsehern, Smartphones und Laptops. Neben der Nanotechnologie werden 3D-Sensoren auch in tragbaren Geräten verwendet. Darüber hinaus versuchen Smartphone-Hersteller, 3D-Sensortechnologie unter anderem in Spiele und Gesichtserkennung zu integrieren. Im Gesundheitswesen helfen 3D-Sensoren dabei, die inneren Schichten von Haut, Tumoren und Venen zu betrachten. In der Automobilindustrie werden 3D-Sensoren häufig eingesetzt, um bei Kollisionen oder drohender Gefahr zu warnen und Unfälle zu vermeiden. K-Serie, iGPS, Laserlinienscanner und Laserradar gehören zu den Produkten, die in der Luft- und Raumfahrt- sowie der Verteidigungsindustrie eingesetzt werden. Die Anwendungen von 3D-Sensoren werden weiter zunehmen, da es in der Elektronik-, Automobil- und anderen Branchen neue Erfindungen gibt.
Die Marktteilnehmer konzentrieren sich auf Produktinnovationen und -entwicklungen, indem sie fortschrittliche Technologien und Funktionen in ihre Produkte integrieren, um mit der Konkurrenz wettbewerbsfähig zu sein.
- 2019: Die AMS AG stellt ein neues ASV-Technologieproduktportfolio vor, das es Herstellern von Konsumgütern, Computern und Industrieprodukten ermöglicht, Gesichtserkennung und andere 3D-Sensoranwendungen einfacher und kostengünstiger zu implementieren. Basierend auf umfassender 3D-Erfahrung hat ams sein Portfolio um Produkte der Active Stereo Vision-Technologie erweitert, um zusätzliche und unterschiedliche 3D-Sensoranwendungen zu adressieren und niedrigere Preise im Mobilsegment zu erreichen. Darüber hinaus gab die AMS AG ihre Partnerschaft mit SmartSens Technology bekannt. Mit dieser Partnerschaft erweitert AMS sein Portfolio um drei 3D-Technologien – Time-of-Flight (ToF), Active Stereo Vision (ASV) und Structured Light (SL) – und beschleunigt die Markteinführung neuer Produkte.
3D-Sensoren
Regionale Einblicke in den Markt für 3D-SensorenDie Analysten von The Insight Partners haben die regionalen Trends und Faktoren, die den Markt für 3D-Sensoren im Prognosezeitraum beeinflussen, ausführlich erläutert. In diesem Abschnitt werden auch die Marktsegmente und die geografische Verteilung von 3D-Sensoren in Nordamerika, Europa, dem asiatisch-pazifischen Raum, dem Nahen Osten und Afrika sowie Süd- und Mittelamerika erläutert.
Umfang des Marktberichts zu 3D-Sensoren
| Berichtsattribut | Einzelheiten |
|---|---|
| Marktgröße in 2018 | US$ 4.81 Billion |
| Marktgröße nach 2027 | US$ 71.91 Billion |
| Globale CAGR (2018 - 2027) | 32.5% |
| Historische Daten | 2016-2017 |
| Prognosezeitraum | 2019-2027 |
| Abgedeckte Segmente |
By Technologie
|
| Abgedeckte Regionen und Länder |
Nordamerika
|
| Marktführer und wichtige Unternehmensprofile |
|
Marktdichte der 3D-Sensoren: Auswirkungen auf die Geschäftsdynamik verstehen
Der Markt für 3D-Sensoren wächst rasant. Die steigende Nachfrage der Endverbraucher ist auf Faktoren wie veränderte Verbraucherpräferenzen, technologische Fortschritte und ein stärkeres Bewusstsein für die Produktvorteile zurückzuführen. Mit der steigenden Nachfrage erweitern Unternehmen ihr Angebot, entwickeln Innovationen, um den Bedürfnissen der Verbraucher gerecht zu werden, und nutzen neue Trends, was das Marktwachstum weiter ankurbelt.
- Holen Sie sich die Markt für 3D-Sensoren Übersicht der wichtigsten Akteure
- Stereovision
- Time-Of-Flight
- Strukturiertes Licht
Globaler Markt für 3D-Sensoren – nach Endbenutzerbranchen
- Gesundheitswesen
- Luft- und Raumfahrt
- Industrie
- Automobil
- Unterhaltungselektronik
- Sonstige
Globaler Markt für 3D-Sensoren – Nach Geografie
-
Nordamerika
- USA
- Kanada
- Mexiko
-
Europa
- Deutschland
- Frankreich
- Italien
- Großbritannien
- Russland
- Restliches Europa
-
Asien-Pazifik (APAC)
- China
- Australien
- Indien
- Japan
- Südkorea
- Restlicher Asien-Pazifik-Raum
-
Naher Osten und Afrika (MEA)
- Saudi-Arabien
- Südafrika
- VAE
- Restlicher Naher Osten und Afrika
-
Süd Amerika
- Argentinien
- Brasilien
- Restliches Südamerika (SAM)
Unternehmensprofile
- AMS AG
- Infineon Technologies AG
- Ifm Electronic GmbH
- Melexis
- Sony Corporation
- STMicroelectronics NV
- Basler AG
- Cognex Corporation
- OmniVision Technologies, Inc.
- LMI Technologies Inc.

Naveen ist ein erfahrener Marktforschungs- und Beratungsexperte mit über 9 Jahren Erfahrung in kundenspezifischen, syndizierten und Beratungsprojekten. In seiner aktuellen Funktion als Associate Vice President hat er erfolgreich Stakeholder entlang der gesamten Projektwertschöpfungskette gemanagt und ist Autor von über 100 Forschungsberichten und über 30 Beratungsaufträgen. Seine Arbeit erstreckt sich auf Industrie- und Regierungsprojekte und trägt maßgeblich zum Kundenerfolg und zur datengesteuerten Entscheidungsfindung bei.
Naveen hat einen Ingenieursabschluss in Elektronik und Kommunikation von der VTU, Karnataka, und einen MBA in Marketing und Operations von der Manipal University. Er ist seit 9 Jahren aktives IEEE-Mitglied und nimmt an Konferenzen und technischen Symposien teil und engagiert sich ehrenamtlich auf Sektions- und regionaler Ebene. Vor seiner aktuellen Position arbeitete er als Associate Strategic Consultant bei IndustryARC und als Industrial Server Consultant bei Hewlett Packard (HP Global).
- Umfassende Analyse der Marktgröße und Prognosen
- Detaillierte Segmentierungsanalyse
- Tiefgehende Bewertung der Marktdynamik
- Einblicke auf regionaler und nationaler Ebene
- Wettbewerbslandschaft und Unternehmens-Benchmarking
- Strategische Business Intelligence
Erfahrungsberichte
Der SCADA-Systemmarktbericht von Insight Partners ist umfassend und bietet wertvolle Einblicke in aktuelle Trends und Zukunftsprognosen. Das Team war durchweg hochprofessionell, reaktionsschnell und hilfsbereit. Wir sind sehr zufrieden und können die Dienstleistungen wärmstens empfehlen.
RAN KEDEM Partner, Reali Technologies LTDsIch habe einen Bericht über einen sehr spezifischen Softwaremarkt angefordert, und das Team hat ihn innerhalb weniger Tage erstellt. Die Informationen waren sehr relevant und gut präsentiert. Anschließend habe ich einige Änderungen und Ergänzungen zum Bericht angefordert. Das Team reagierte erneut sehr schnell, und ich erhielt den Abschlussbericht in weniger als einer Woche.
JEAN-HERVE JENN Vorsitzende, Future AnalyticaWir haben mit The Insight Partners für eine wichtige Marktstudie und Prognose zusammengearbeitet. Sie gaben uns klare Einblicke in Chancen und Risiken, die uns bei der Gestaltung unserer Pläne halfen. Ihre Recherchen waren benutzerfreundlich und basierten auf soliden Daten. Sie halfen uns, kluge und sichere Entscheidungen zu treffen. Wir können sie wärmstens empfehlen.
PIYUSH NAGPAL Sr. Vizepräsident, Fernlicht GlobalDie Insight Partners lieferten aufschlussreiche, gut strukturierte Marktforschung mit fundierter Fachkompetenz. Ihr Team war durchweg professionell und reaktionsschnell. Die benutzerfreundliche Website ermöglichte den Zugriff auf Branchenberichte. Wir empfehlen sie wärmstens für zuverlässige und hochwertige Forschungsdienstleistungen.
YUKIHIKO ADACHI Geschäftsführer, Deep Blue, LLC.Dies ist das erste Mal, dass ich einen Marktbericht von The Insight Partners erworben habe. Obwohl ich zunächst unsicher war, besuchte ich die Website und fühlte mich dann sicherer, das Risiko einzugehen und einen Marktbericht zu kaufen. Ich bin mit der Qualität des Berichts und dem Kundenservice rundum zufrieden. Ich hatte einige Fragen und Anmerkungen zum ersten Bericht, aber nach einigen E-Mail-Gesprächen mit dem Analysten bin ich überzeugt, dass ich einen Bericht habe, den ich als Input für unseren strategischen Planungsprozess verwenden kann. Vielen Dank, dass Sie sich die Zeit genommen und dies zu einer positiven Erfahrung gemacht haben. Ich werde Ihren Service auf jeden Fall weiterempfehlen und Sie werden meine erste Anlaufstelle sein, wenn wir weitere Marktdaten benötigen.
JOHN SUZUKI Präsident und Chief Executive Officer, Vorstandsmitglied, BK TechnologiesIch möchte mich für Ihre Unterstützung und die Professionalität bedanken, die Sie bei der Bearbeitung meiner Informationsanfrage zum IVD-Markt für Infektionskrankheiten in Nigeria gezeigt haben. Ich schätze Ihre Geduld, Ihre Beratung und die Tatsache, dass Sie bereit waren, einen Rabatt anzubieten, der uns schließlich den Abschluss eines Geschäfts ermöglichte. Ich freue mich darauf, The Insight Partners in Zukunft wieder zu beauftragen, dank des Eindrucks, den Sie bei dieser ersten Begegnung bei mir hinterlassen haben.
DR. CHIJIOKE ONYIA GESCHÄFTSFÜHRERIN, PineCrest Healthcare Ltd.Grund zum Kauf
- Fundierte Entscheidungsfindung
- Marktdynamik verstehen
- Wettbewerbsanalyse
- Kundeneinblicke
- Marktprognosen
- Risikominimierung
- Strategische Planung
- Investitionsbegründung
- Identifizierung neuer Märkte
- Verbesserung von Marketingstrategien
- Steigerung der Betriebseffizienz
- Anpassung an regulatorische Trends


