Marktwachstum, Trends und Nachfrage im Bereich DevOps-Tools bis 2034
Historische Daten : 2021-2024 | Basisjahr : 2025 | Prognosezeitraum : 2026-2034Marktgröße und Prognose für DevOps-Tools (2021–2034), globaler und regionaler Marktanteil, Trends und Wachstumspotenzialanalyse. Berichtsabdeckung: Nach Produkttyp (DevOps-fähig, DevOps-bereit und DevOps-fähig), Bereitstellungstyp (On-Premises und Cloud), Anwendung (Banken, Finanzdienstleistungen und Versicherungen, IT und Telekommunikation, Einzelhandel und Sonstige) und Region
- Status : Veröffentlichte Daten
- Berichtscode : TIPRE00012761
- Kategorie : Technologie, Medien und Telekommunikation
- Anzahl der Seiten : 150
- Verfügbare Berichtsformate :


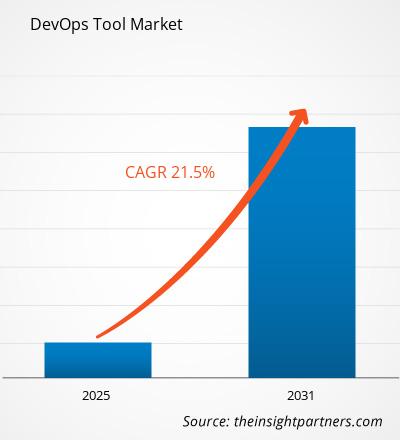
Der globale Markt für DevOps-Tools wird bis 2034 voraussichtlich ein Volumen von 26,24 Milliarden US-Dollar erreichen, gegenüber 9,9 Milliarden US-Dollar im Jahr 2025. Es wird erwartet, dass der Markt im Prognosezeitraum 2026-2034 eine durchschnittliche jährliche Wachstumsrate (CAGR) von 12,96 % verzeichnen wird.
Marktanalyse für DevOps-Tools
- Da DevOps-Tools darauf ausgelegt sind, die Softwareentwicklung und -bereitstellung zu beschleunigen, steigt ihre Akzeptanz, und führende Unternehmen in allen Branchen investieren massiv in DevOps-Tools.
- Die großen Unternehmen sind die klaren Vorreiter, viele haben bereits durchgängige DevOps-Toolchains eingeführt.
- Mittelständische Unternehmen holen schnell auf. Die führenden Tools reichen von Versionskontrollsystemen über CI/CD-Plattformen (Continuous Integration/Continuous Deployment) und Containerisierungstechnologien bis hin zu Monitoring-Tools.
- Cloud-native DevOps-Tools gewinnen ebenfalls zunehmend an Bedeutung, parallel zum anhaltenden Trend des Cloud Computing. Die Akzeptanz ist jedoch unterschiedlich: Einige Unternehmen sind noch relativ unerfahren im Bereich DevOps oder hinken bei der kulturellen Umstellung oder Integration hinterher.
Marktübersicht für DevOps-Tools
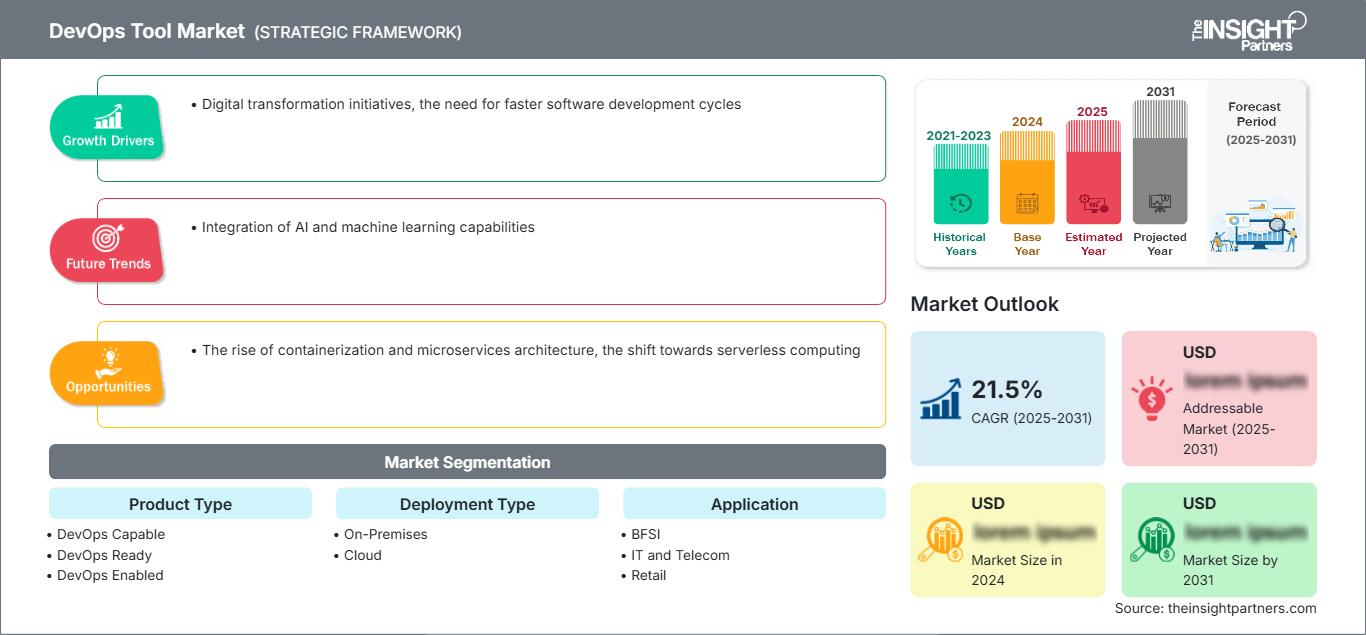
- Der DevOps-Markt verzeichnet ein starkes Wachstum, dank zunehmender Digitalisierungsinitiativen zur Transformation von Unternehmen und zur Bewältigung der Herausforderung der ständigen Weiterentwicklung der Technologie bei gleichzeitigem Bedarf an schneller und einfacher Softwarebereitstellung.
- Zahlreiche große Technologieunternehmen und Startups drängen in den Markt für Cloud-Plattformen, die eine breite Palette an Tools und Plattformen für Automatisierung, Zusammenarbeit und Continuous Integration/Delivery bieten. Nordamerika ist führend bei der Einführung, dicht gefolgt vom asiatisch-pazifischen Raum mit rasantem Wachstum. Cloud-Plattformen erfreuen sich steigender Nachfrage. Der Markt steht zwar vor Herausforderungen wie Fachkräftemangel und Widerstand innerhalb der Organisation bei der DevOps-Implementierung, doch die Transformation wird einen bedeutenden Fortschritt bringen.
Marktanalyse und Einblicke
- Der globale Markt für DevOps-Tools wurde im Jahr 2025 auf 9,90 Milliarden US-Dollar geschätzt.
- Es wird erwartet, dass das jährliche Marktvolumen bis 2034 26,24 Milliarden US-Dollar erreichen wird.
- Der gesamte adressierbare Markt (TAM) wird im Zeitraum 2026-2034 voraussichtlich rund 172,10 Milliarden US-Dollar erreichen.
- Es wird erwartet, dass der Markt im Prognosezeitraum eine durchschnittliche jährliche Wachstumsrate (CAGR) von 12,96 % verzeichnen wird.
- Die Vereinigten Staaten stellen einen Schlüsselmarkt dar, der durch Initiativen zur digitalen Transformation, den Bedarf an schnelleren Softwareentwicklungszyklen sowie die sich wandelnde Branchendynamik gestützt wird.
- Die Marktanalyse umfasst Nordamerika, Europa, den asiatisch-pazifischen Raum, Süd- und Mittelamerika, den Nahen Osten und Afrika, wobei das Wachstum über den gesamten Prognosezeitraum bewertet wird.
- Marktchancen wie der Aufstieg der Containerisierung und der Microservices-Architektur sowie der Wandel hin zu Serverless Computing werden voraussichtlich die Marktdynamik und den adressierbaren Markt beeinflussen.
- Der Bericht stellt Branchenteilnehmer wie HPE Company, CA Technologies Inc., Chef, Inc., Cisco Systems, Inc., Docker, Inc., IBM Corporation, Microsoft Corporation, Puppet Labs, Inc., Red Hat, Inc. und Spirent Communications plc vor und analysiert Wettbewerbsstrategien und Innovationsentwicklungen.
Passen Sie diesen Bericht Ihren Anforderungen an.
Kostenlose AnpassungDevOps-Tool-Markt: Strategische Einblicke
-
Ermitteln Sie die wichtigsten Markttrends dieses Berichts.Diese KOSTENLOSE Probe beinhaltet eine Datenanalyse, die von Markttrends bis hin zu Schätzungen und Prognosen reicht.
Markttreiber und Chancen für DevOps-Tools
Bedarf an schnelleren Softwareentwicklungszyklen, um dem Markt Vorteile zu verschaffen
- Ein wesentlicher Treiber des DevOps-Tools-Marktes ist die Nachfrage nach schnelleren Softwareentwicklungszyklen in einem Umfeld, in dem sich digitale Systeme rasant verändern. Diese kritischen Systeme sollen die Wettbewerbsfähigkeit steigern und neue Dienstleistungen und Produkte auf den Markt bringen, die den Kundenbedürfnissen gerecht werden und neue, durch Technologie eröffnete Möglichkeiten nutzen.
- Diese Geschwindigkeitsanforderung entsteht aus dem Wunsch, schnell und flexibel auf sich ändernde Markt-, Kunden- und technische Anforderungen reagieren zu können. DevOps-Tools können die Softwareentwicklung beschleunigen, indem sie Teile des Softwareentwicklungszyklus automatisieren und so die sogenannte kontinuierliche Integration und kontinuierliche Bereitstellung (CI/CD) erleichtern.
- Durch Automatisierung, Vereinfachung und Optimierung von Prozessen sowie die Reduzierung manueller Fehler ermöglichen DevOps-Tools Unternehmen, die Softwareentwicklung und die Bereitstellung stabilerer Softwaresysteme zu beschleunigen. Dies steigert die Agilität von Unternehmen, ermöglicht schnellere Iterationen, eine zügigere Markteinführung von Produkten und Dienstleistungen und erhöht die Wettbewerbsfähigkeit, was wiederum zu mehr Umsatz und Geschäftserfolg führt. Die Nachfrage nach einem schnelleren Softwareentwicklungszyklus trägt somit zum Wachstum und zur Innovation des DevOps-Tool-Marktes bei.
Integration von KI- und maschinellen Lernfähigkeiten
- Die Integration von KI- und Machine-Learning-Funktionen ermöglicht es DevOps-Tool-Anbietern, die in diesen Technologien eingebetteten Automatisierungs-, Entscheidungsfindungs- und Vorhersagefunktionen optimal zu nutzen.
- Tools, die KI- und ML-Funktionen integrieren, können viele komplexe Aufgaben automatisieren, Systemausfälle vorhersagen, die Ressourcennutzung identifizieren und maximieren, die Qualität und Effektivität von Sicherheitsvorkehrungen verbessern und intelligente Warnungen und Erkenntnisse darüber liefern, was als Nächstes zu tun ist.
- DevOps-Tools bieten erweiterte Funktionen wie vorausschauende Wartung, intelligentere Tests und verbesserte Kapazitätsplanung. Diese Integration steigert nicht nur die Effizienz und Effektivität von DevOps-Prozessen, sondern hilft Anbietern auch, sich durch Differenzierung von der Vielzahl alternativer Tool-Anbieter abzuheben.
Marktbericht für DevOps-Tools: Segmentierungsanalyse
Zu den wichtigsten Segmenten, die zur Ableitung der Marktanalyse für DevOps-Tools beigetragen haben, gehören Produkttyp, Bereitstellungstyp und Anwendung.
- Basierend auf dem Produkttyp wird der Markt für DevOps-Tools in DevOps-fähige, DevOps-bereite und DevOps-fähige Tools unterteilt.
- Basierend auf dem Bereitstellungstyp wird der Markt für DevOps-Tools in On-Premises und Cloud unterteilt. BFSI (Banken, Finanzdienstleistungen und Versicherungen), IT und Telekommunikation, Einzelhandel, Sonstige
- Basierend auf der Anwendung wird der Markt für DevOps-Tools in BFSI (Banken, Finanzdienstleistungen und Versicherungen), IT und Telekommunikation, Einzelhandel und Sonstige unterteilt.
Marktanteilsanalyse für DevOps-Tools nach Regionen
- Der DevOps-Tool-Marktbericht enthält eine detaillierte Analyse von fünf wichtigen geografischen Regionen, einschließlich der aktuellen und historischen Marktgröße sowie Prognosen für den Zeitraum von 2021 bis 2034, und deckt Nordamerika, Europa, den asiatisch-pazifischen Raum (APAC), den Nahen Osten und Afrika (MEA) sowie Süd- und Mittelamerika ab.
- Jede Region ist weiter in einzelne Länder unterteilt. Dieser Bericht bietet Analysen und Prognosen für über 18 Länder und deckt die Marktdynamik von DevOps-Tools ab, darunter Treiber, Trends und Chancen, die die Märkte auf regionaler Ebene beeinflussen.
- Der Bericht umfasst außerdem eine PEST-Analyse, bei der die wichtigsten Faktoren untersucht werden, die den Markt für DevOps-Tools in diesen Regionen beeinflussen.
Umfang des Marktberichts zu DevOps-Tools
| Berichtattribute | Details |
|---|---|
| Marktgröße im Jahr 2025 | 9,9 Milliarden US-Dollar |
| Marktgröße bis 2034 | 26,24 Milliarden US-Dollar |
| Globale durchschnittliche jährliche Wachstumsrate (2026 - 2034) | 12,96 % |
| Historische Daten | 2021-2024 |
| Prognosezeitraum | 2026–2034 |
| Abgedeckte Segmente |
Nach Produkttyp
|
| Abgedeckte Regionen und Länder |
Nordamerika
|
| Marktführer und wichtige Unternehmensprofile |
|
Marktdichte der DevOps-Tools: Auswirkungen auf die Geschäftsdynamik verstehen
Der Markt für DevOps-Tools wächst rasant, angetrieben durch die steigende Nachfrage der Endnutzer. Gründe hierfür sind unter anderem sich wandelnde Verbraucherpräferenzen, technologische Fortschritte und ein wachsendes Bewusstsein für die Vorteile der Produkte. Mit steigender Nachfrage erweitern Unternehmen ihr Angebot, entwickeln innovative Lösungen, um den Kundenbedürfnissen gerecht zu werden, und nutzen neue Trends, was das Marktwachstum zusätzlich beflügelt.
Neuigkeiten und aktuelle Entwicklungen auf dem DevOps-Tool-Markt
Der Markt für DevOps-Tools wird anhand qualitativer und quantitativer Daten nach Primär- und Sekundärforschung analysiert. Zu den relevanten Quellen zählen wichtige Unternehmensveröffentlichungen, Verbandsdaten und Datenbanken. Einige Entwicklungen auf dem Markt für DevOps-Tools sind nachfolgend aufgeführt:
- Appdome hat die Integration seiner Cyber Defense Automation Platform in einen Cloud-basierten Dienst von Microsoft Azure DevOps bekannt gegeben. Dieser bietet Continuous Integration und Continuous Delivery (CI/CD)-Funktionen und ermöglicht es Teams, die Erstellung, das Testen und die Bereitstellung ihrer Anwendungen zu automatisieren. Azure DevOps ist nun Teil der Appdome Dev2Cyber Agility Partner Initiative, die die weltweite Bereitstellung sicherer mobiler Apps vorantreiben soll. Dank dieser neuen Integration können Azure Pipelines-Nutzer die Appdome-Konfiguration als Code direkt in Azure Pipelines nutzen und alle Sicherheits-, Betrugs-, Malware-, Cheat- und andere Cyberabwehrfunktionen von Appdome in Android- und iOS-Apps integrieren. (Quelle: Appdome, Pressemitteilung, Juli 2023)
Marktbericht zu DevOps-Tools: Abdeckung und Ergebnisse
Der Bericht „Marktgröße und Prognose für DevOps-Tools (2021–2034)“ bietet eine detaillierte Analyse des Marktes und deckt folgende Bereiche ab:
- Marktgröße und Prognose für DevOps-Tools auf globaler, regionaler und Länderebene für alle wichtigen Marktsegmente, die im Rahmen des Berichts abgedeckt werden
- Trends im DevOps-Tool-Markt sowie Marktdynamiken wie Treiber, Hemmnisse und wichtige Chancen
- Detaillierte PEST-/Porter-Fünf-Kräfte- und SWOT-Analyse
- Marktanalyse für DevOps-Tools mit Fokus auf wichtige Markttrends, globale und regionale Rahmenbedingungen, Hauptakteure, regulatorische Rahmenbedingungen und aktuelle Marktentwicklungen
- Branchenlandschaft und Wettbewerbsanalyse mit Fokus auf Marktkonzentration, Heatmap-Analyse, prominente Akteure und aktuelle Entwicklungen im DevOps-Tool-Markt
- Detaillierte Unternehmensprofile

Ankita ist eine dynamische Marktforschungs- und Beratungsexpertin mit über 8 Jahren Erfahrung in den Bereichen Technologie, Medien, IKT sowie Elektronik und Halbleiter. Sie hat über 100 Beratungs- und Forschungsaufträge für globale Kunden wie Microsoft, Oracle, NEC Corporation, SAP, KPMG und Expeditors International erfolgreich geleitet und durchgeführt. Zu ihren Kernkompetenzen gehören Marktbewertung, Datenanalyse, Prognose, Strategieformulierung, Wettbewerbsbeobachtung und das Verfassen von Berichten. Ankita ist versiert in der Abwicklung kompletter Projektzyklen – von der Angebotserstellung vor dem Verkauf und Kundengesprächen bis hin zur Bereitstellung umsetzbarer Erkenntnisse nach dem Verkauf. Sie ist versiert in der Leitung funktionsübergreifender Teams, der Strukturierung komplexer Forschungsmodule und der Ausrichtung von Lösungen an kundenspezifischen Geschäftszielen. Ihre ausgezeichneten Kommunikationsfähigkeiten, Führungsqualitäten und Präsentationsfähigkeiten haben es ihr ermöglicht, in einem schnelllebigen und sich entwickelnden Marktumfeld stets wertorientierte Ergebnisse zu liefern.
- Historische Analyse (2 Jahre), Basisjahr, Prognose (7 Jahre) mit CAGR
- PEST- und SWOT-Analyse
- Marktgröße Wert/Volumen – Global, Regional, Land
- Branchen- und Wettbewerbslandschaft
- Excel-Datensatz
Erfahrungsberichte
Der SCADA-Systemmarktbericht von Insight Partners ist umfassend und bietet wertvolle Einblicke in aktuelle Trends und Zukunftsprognosen. Das Team war durchweg hochprofessionell, reaktionsschnell und hilfsbereit. Wir sind sehr zufrieden und können die Dienstleistungen wärmstens empfehlen.
RAN KEDEM Partner, Reali Technologies LTDsIch habe einen Bericht über einen sehr spezifischen Softwaremarkt angefordert, und das Team hat ihn innerhalb weniger Tage erstellt. Die Informationen waren sehr relevant und gut präsentiert. Anschließend habe ich einige Änderungen und Ergänzungen zum Bericht angefordert. Das Team reagierte erneut sehr schnell, und ich erhielt den Abschlussbericht in weniger als einer Woche.
JEAN-HERVE JENN Vorsitzende, Future AnalyticaWir haben mit The Insight Partners für eine wichtige Marktstudie und Prognose zusammengearbeitet. Sie gaben uns klare Einblicke in Chancen und Risiken, die uns bei der Gestaltung unserer Pläne halfen. Ihre Recherchen waren benutzerfreundlich und basierten auf soliden Daten. Sie halfen uns, kluge und sichere Entscheidungen zu treffen. Wir können sie wärmstens empfehlen.
PIYUSH NAGPAL Sr. Vizepräsident, Fernlicht GlobalDie Insight Partners lieferten aufschlussreiche, gut strukturierte Marktforschung mit fundierter Fachkompetenz. Ihr Team war durchweg professionell und reaktionsschnell. Die benutzerfreundliche Website ermöglichte den Zugriff auf Branchenberichte. Wir empfehlen sie wärmstens für zuverlässige und hochwertige Forschungsdienstleistungen.
YUKIHIKO ADACHI Geschäftsführer, Deep Blue, LLC.Dies ist das erste Mal, dass ich einen Marktbericht von The Insight Partners erworben habe. Obwohl ich zunächst unsicher war, besuchte ich die Website und fühlte mich dann sicherer, das Risiko einzugehen und einen Marktbericht zu kaufen. Ich bin mit der Qualität des Berichts und dem Kundenservice rundum zufrieden. Ich hatte einige Fragen und Anmerkungen zum ersten Bericht, aber nach einigen E-Mail-Gesprächen mit dem Analysten bin ich überzeugt, dass ich einen Bericht habe, den ich als Input für unseren strategischen Planungsprozess verwenden kann. Vielen Dank, dass Sie sich die Zeit genommen und dies zu einer positiven Erfahrung gemacht haben. Ich werde Ihren Service auf jeden Fall weiterempfehlen und Sie werden meine erste Anlaufstelle sein, wenn wir weitere Marktdaten benötigen.
JOHN SUZUKI Präsident und Chief Executive Officer, Vorstandsmitglied, BK TechnologiesIch möchte mich für Ihre Unterstützung und die Professionalität bedanken, die Sie bei der Bearbeitung meiner Informationsanfrage zum IVD-Markt für Infektionskrankheiten in Nigeria gezeigt haben. Ich schätze Ihre Geduld, Ihre Beratung und die Tatsache, dass Sie bereit waren, einen Rabatt anzubieten, der uns schließlich den Abschluss eines Geschäfts ermöglichte. Ich freue mich darauf, The Insight Partners in Zukunft wieder zu beauftragen, dank des Eindrucks, den Sie bei dieser ersten Begegnung bei mir hinterlassen haben.
DR. CHIJIOKE ONYIA GESCHÄFTSFÜHRERIN, PineCrest Healthcare Ltd.Grund zum Kauf
- Fundierte Entscheidungsfindung
- Marktdynamik verstehen
- Wettbewerbsanalyse
- Kundeneinblicke
- Marktprognosen
- Risikominimierung
- Strategische Planung
- Investitionsbegründung
- Identifizierung neuer Märkte
- Verbesserung von Marketingstrategien
- Steigerung der Betriebseffizienz
- Anpassung an regulatorische Trends


Exklusive Berichtsrabatte freischalten
Jetzt anfragen


 Kostenlose Probe anfordern für - DevOps-Tool-Markt