
Markt für On-Shelf-Verfügbarkeitslösungen – Erkenntnisse durch globale und regionale Analyse – Prognose bis 2031
Marktgröße und Prognose für On-Shelf-Verfügbarkeitslösungen (2021-2031), Berichtsabdeckung für globale und regionale Anteils-, Trend- und Wachstumschancenanalyse: Nach Komponente (Lösung und Dienste), Bereitstellung (Cloud und vor Ort), Endbenutzer (CPG-Hersteller, Einzelhändler, Lieferanten und andere) und Geografie
- Status : Veröffentlichte Daten
- Berichtscode : TIPRE00007761
- Kategorie : Technologie, Medien und Telekommunikation
- Anzahl der Seiten : 150
- Verfügbare Berichtsformate :


- Datum der letzten Aktualisierung : October 24, 2024

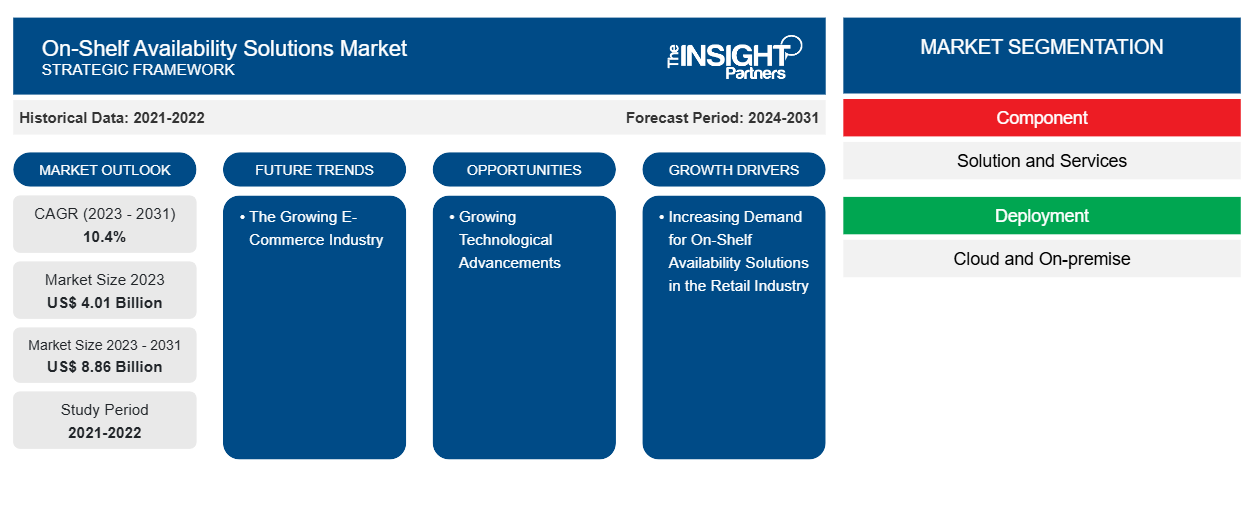
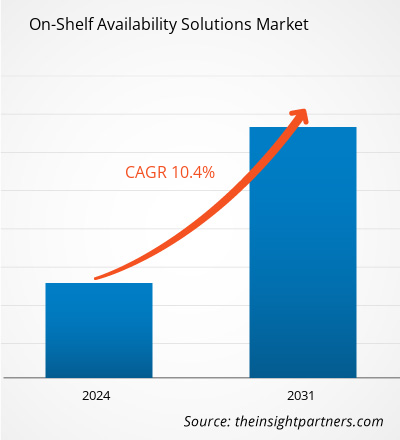
Der Markt für Regalverfügbarkeitslösungen soll von 4,01 Milliarden US-Dollar im Jahr 2023 auf 8,86 Milliarden US-Dollar im Jahr 2031 anwachsen. Der Markt wird voraussichtlich zwischen 2023 und 2031 eine durchschnittliche jährliche Wachstumsrate von 10,4 % verzeichnen. Die wachsende E-Commerce-Branche wird voraussichtlich ein wichtiger Markttrend für Regalverfügbarkeitslösungen bleiben.
Marktanalyse für On-Shelf-Verfügbarkeitslösungen
Die wachsende Zahl von Einzelhandelsgeschäften weltweit steigert die Nachfrage nach Regalverfügbarkeitslösungen im Einzelhandel, was einer der Hauptfaktoren ist, die das Wachstum des Marktes antreiben. Darüber hinaus treiben die wachsende Nachfrage nach Omnichannel- Lösungen und der zunehmende Fokus auf das Kundenerlebnis das Wachstum des Marktes voran. Darüber hinaus schafft die zunehmende Integration fortschrittlicher Technologien wie KI, ML, Computer Vision und andere eine Chance für das Wachstum des Marktes für Regalverfügbarkeitslösungen in den kommenden Jahren.
Marktübersicht für On-Shelf-Verfügbarkeitslösungen
Unter Regalverfügbarkeit versteht man die Anwesenheit eines Produkts in den Regalen eines Geschäfts, wenn ein Kunde kommt, um es zu kaufen. Die Regalverfügbarkeit garantiert, dass Kunden das gewünschte Produkt einfach und problemlos kaufen können. Für den Einzelhändler bedeutet sie zufriedene Kunden sowie höhere Umsätze aus Produktverkäufen. Auch Hersteller profitieren von der Regalverfügbarkeit, da sie den Verkauf ihrer Waren garantiert und nützliche Informationen für die Bestandskontrolle bietet. Daher ist die Regalverfügbarkeit im Einzelhandel ein entscheidender Faktor, der effektiv überwacht und aufrechterhalten werden muss.
Passen Sie diesen Bericht Ihren Anforderungen an
Sie erhalten kostenlose Anpassungen an jedem Bericht, einschließlich Teilen dieses Berichts oder einer Analyse auf Länderebene, eines Excel-Datenpakets sowie tolle Angebote und Rabatte für Start-ups und Universitäten.
Markt für On-Shelf-Verfügbarkeitslösungen: Strategische Einblicke
-
Holen Sie sich die wichtigsten Markttrends aus diesem Bericht.Dieses KOSTENLOSE Beispiel umfasst eine Datenanalyse von Markttrends bis hin zu Schätzungen und Prognosen.
Markttreiber und Chancen für On-Shelf-Verfügbarkeitslösungen
Steigende Nachfrage nach Regalverfügbarkeitslösungen im Einzelhandel
Die Grundlagen des Ladenbetriebs sind für viele Einzelhändler weiterhin eine Herausforderung, häufig, weil sie die vorhandenen Daten nicht interpretieren können oder keinen Zugriff auf die erforderlichen Informationen haben, um Verbesserungen vorzunehmen. Um dieses Problem zu lösen, setzen Einzelhändler auf Regalverfügbarkeitslösungen. Diese Lösung kann Einzelhändlern helfen, die Kundenzufriedenheit zu steigern und den Umsatz durch den Verkauf des Produkts zu erhöhen. Darüber hinaus hilft sie Einzelhändlern, den Ruf ihrer Marke zu verbessern und eine positivere Unternehmenskultur zu fördern. Alle oben genannten Faktoren erhöhen also die Nachfrage nach Regalverfügbarkeitslösungen im Einzelhandel und treiben das Wachstum des Marktes voran.
Wachsender technologischer Fortschritt
Die manuelle Regalverwaltung erfordert einen hohen Personalaufwand und wird meist in einer festgelegten Häufigkeit durchgeführt. Um dieses Problem zu lösen, arbeiten verschiedene Marktteilnehmer kontinuierlich an der Integration fortschrittlicher Technologien wie KI , Computer Vision und anderen. Die Integration der Technologien kann automatisch dazu beitragen, OOS-Artikel, falsche Platzierungen und andere Probleme zu erkennen, indem Regalartikel mithilfe von Algorithmen wie Preisschilderkennung, Produkterkennung, OOS-Erkennung, Aktivitätserkennung und optischer Zeichenerkennung (OCR) identifiziert, klassifiziert und inventarisiert werden. Daher können solche technologischen Fortschritte im Prognosezeitraum eine Chance für Marktwachstum schaffen.
Marktbericht zu On-Shelf-Verfügbarkeitslösungen – Segmentierungsanalyse
Wichtige Segmente, die zur Ableitung der Marktanalyse für Lösungen zur Regalverfügbarkeit beigetragen haben, sind Komponente, Bereitstellung und Endbenutzer.
- Basierend auf den Komponenten ist der Markt in Lösungen und Dienstleistungen unterteilt. Das Lösungssegment hatte im Jahr 2023 einen größeren Marktanteil.
- Nach Bereitstellung ist der Markt in Cloud und On-Premise segmentiert. Das Cloud-Segment hatte im Jahr 2023 den größten Marktanteil.
- Nach Endverbraucher ist der Markt in CPG-Hersteller, Einzelhändler, Lieferanten und andere segmentiert. Das Segment der CPG-Hersteller hielt im Jahr 2023 den größten Marktanteil.
Marktanteilsanalyse für On-Shelf-Verfügbarkeitslösungen nach geografischer Lage
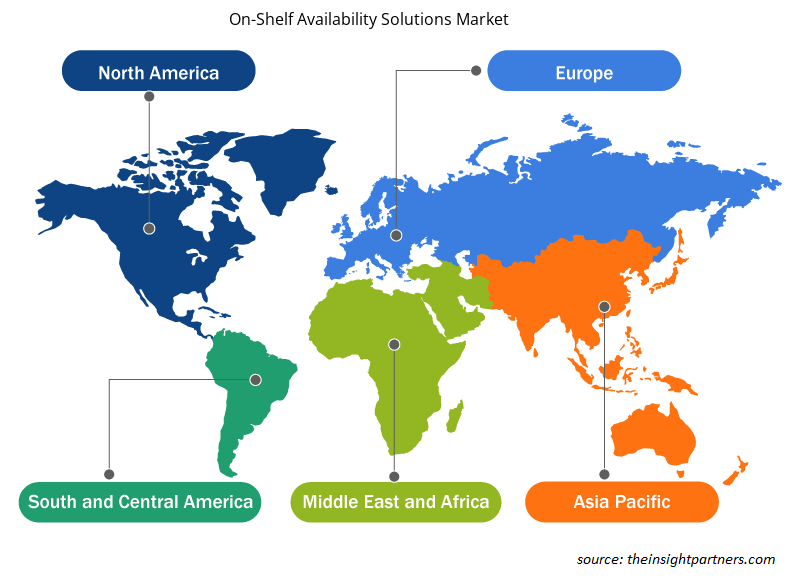
Der geografische Umfang des Marktberichts zu Lösungen zur Regalverfügbarkeit ist hauptsächlich in fünf Regionen unterteilt: Nordamerika, Asien-Pazifik, Europa, Naher Osten und Afrika sowie Südamerika/Süd- und Mittelamerika.
In Bezug auf den Umsatz hatte Nordamerika den größten Marktanteil bei Lösungen zur Regalverfügbarkeit. Der Markt in dieser Region ist in die USA, Kanada und Mexiko unterteilt. Die Region erlebt einen enormen Anstieg ihres E-Commerce-Sektors, der einer der Hauptfaktoren für das Wachstum des Marktes ist. Darüber hinaus verfügt die Region über hoch entwickelte Einzelhandels- und Lieferkettensektoren, was weiter zur steigenden Nachfrage nach Lösungen zur Regalverfügbarkeit in Nordamerika beiträgt.
Regionale Einblicke in den Markt für On-Shelf-Verfügbarkeitslösungen
Die regionalen Trends und Faktoren, die den Markt für On-Shelf-Verfügbarkeitslösungen während des gesamten Prognosezeitraums beeinflussen, wurden von den Analysten von Insight Partners ausführlich erläutert. In diesem Abschnitt werden auch die Marktsegmente und die Geografie von On-Shelf-Verfügbarkeitslösungen in Nordamerika, Europa, im asiatisch-pazifischen Raum, im Nahen Osten und Afrika sowie in Süd- und Mittelamerika erörtert.
- Erhalten Sie regionale Daten zum Markt für On-Shelf-Verfügbarkeitslösungen
Umfang des Marktberichts zu On-Shelf-Verfügbarkeitslösungen
| Berichtsattribut | Details |
|---|---|
| Marktgröße im Jahr 2023 | 4,01 Milliarden US-Dollar |
| Marktgröße bis 2031 | 8,86 Milliarden US-Dollar |
| Globale CAGR (2023 - 2031) | 10,4 % |
| Historische Daten | 2021-2022 |
| Prognosezeitraum | 2024–2031 |
| Abgedeckte Segmente |
Nach Komponente
|
| Abgedeckte Regionen und Länder |
Nordamerika
|
| Marktführer und wichtige Unternehmensprofile |
|
Dichte der Marktteilnehmer für Lösungen zur Regalverfügbarkeit: Die Auswirkungen auf die Geschäftsdynamik verstehen
Der Markt für On-Shelf-Availability-Lösungen wächst rasant, angetrieben von der steigenden Nachfrage der Endnutzer aufgrund von Faktoren wie sich entwickelnden Verbraucherpräferenzen, technologischen Fortschritten und einem größeren Bewusstsein für die Vorteile des Produkts. Mit steigender Nachfrage erweitern Unternehmen ihr Angebot, entwickeln Innovationen, um die Bedürfnisse der Verbraucher zu erfüllen, und nutzen neue Trends, was das Marktwachstum weiter ankurbelt.
Die Marktteilnehmerdichte bezieht sich auf die Verteilung von Firmen oder Unternehmen, die in einem bestimmten Markt oder einer bestimmten Branche tätig sind. Sie gibt an, wie viele Wettbewerber (Marktteilnehmer) in einem bestimmten Marktraum im Verhältnis zu seiner Größe oder seinem gesamten Marktwert präsent sind.
Die wichtigsten Unternehmen auf dem Markt für On-Shelf-Verfügbarkeitslösungen sind:
- Atlas Technology Group
- BeMyEye Holdings Ltd.
- IBM Corporation
- Lösungen für den Einzelhandel
- Einschl.
- SAP SE
Haftungsausschluss : Die oben aufgeführten Unternehmen sind nicht in einer bestimmten Reihenfolge aufgeführt.
- Überblick über die wichtigsten Akteure auf dem Markt für On-Shelf-Verfügbarkeitslösungen
Marktnachrichten und aktuelle Entwicklungen zu Lösungen zur Regalverfügbarkeit
Der Markt für On-Shelf-Availability-Lösungen wird durch die Erfassung qualitativer und quantitativer Daten nach Primär- und Sekundärforschung bewertet, die wichtige Unternehmensveröffentlichungen, Verbandsdaten und Datenbanken umfasst. Im Folgenden finden Sie eine Liste der Entwicklungen auf dem Markt für Sprach- und Sprechstörungen und -strategien:
- Retail Velocity, der Pionier und Branchenführer im Bereich Datenmanagement, Reporting und Analyse von Verbrauchernachfrage und -angebot, hat die Einführung der 10. Generation seiner VELOCITY-Plattform und die Einführung von VELOCITY Essential angekündigt. Dieses neue VELOCITY Pro 10 bietet mehr Leistung, einfacheres Datenmanagement, verbessertes Reporting und zusätzliche Sicherheit, sodass Hersteller von Konsumgütern schneller als je zuvor tiefere, umsetzbare Erkenntnisse gewinnen, intern und mit Einzelhandelspartnern fundiertere, kollaborative Entscheidungen treffen und schnell und effektiv auf sich ändernde Verbrauchernachfrage und Marktbedingungen reagieren können. (Quelle: Retail Velocity, Pressemitteilung, 2022)
- Tredence Inc., ein führendes Unternehmen für Datenwissenschaft und KI-Engineering, gab eine Partnerschaft mit Databricks bekannt, dem führenden Anbieter von Unified Analytics, der von den ursprünglichen Entwicklern von Apache Spark gegründet wurde. Im Rahmen dieser Partnerschaft entwickelten die Unternehmen gemeinsam den On-Shelf Availability Solution (OSA)-Beschleuniger, der Einzelhändlern und Herstellern hilft, Lagerbestände zu beheben, indem er die Datenverarbeitungsfunktionen von Databricks und die Expertise von Tredence im Bereich KI/ML kombiniert. (Quelle: Tredence Inc, Pressemitteilung, 2021)
Marktbericht zu Lösungen zur Regalverfügbarkeit – Abdeckung und Ergebnisse
Der Bericht „Marktgröße und Prognose für On-Shelf-Verfügbarkeitslösungen (2021–2031)“ bietet eine detaillierte Analyse des Marktes, die die folgenden Bereiche abdeckt:
- Marktgröße und Prognose auf globaler, regionaler und Länderebene für alle wichtigen Marktsegmente, die im Rahmen des Projekts abgedeckt sind
- Marktdynamik wie Treiber, Beschränkungen und wichtige Chancen
- Wichtige Zukunftstrends
- Detaillierte PEST/Porters Five Forces- und SWOT-Analyse
- Globale und regionale Marktanalyse mit wichtigen Markttrends, wichtigen Akteuren, Vorschriften und aktuellen Marktentwicklungen
- Branchenlandschaft und Wettbewerbsanalyse, einschließlich Marktkonzentration, Heatmap-Analyse, prominenten Akteuren und aktuellen Entwicklungen
- Detaillierte Firmenprofile

Ankita ist eine dynamische Marktforschungs- und Beratungsexpertin mit über 8 Jahren Erfahrung in den Bereichen Technologie, Medien, IKT sowie Elektronik und Halbleiter. Sie hat über 100 Beratungs- und Forschungsaufträge für globale Kunden wie Microsoft, Oracle, NEC Corporation, SAP, KPMG und Expeditors International erfolgreich geleitet und durchgeführt. Zu ihren Kernkompetenzen gehören Marktbewertung, Datenanalyse, Prognose, Strategieformulierung, Wettbewerbsbeobachtung und das Verfassen von Berichten. Ankita ist versiert in der Abwicklung kompletter Projektzyklen – von der Angebotserstellung vor dem Verkauf und Kundengesprächen bis hin zur Bereitstellung umsetzbarer Erkenntnisse nach dem Verkauf. Sie ist versiert in der Leitung funktionsübergreifender Teams, der Strukturierung komplexer Forschungsmodule und der Ausrichtung von Lösungen an kundenspezifischen Geschäftszielen. Ihre ausgezeichneten Kommunikationsfähigkeiten, Führungsqualitäten und Präsentationsfähigkeiten haben es ihr ermöglicht, in einem schnelllebigen und sich entwickelnden Marktumfeld stets wertorientierte Ergebnisse zu liefern.
- Umfassende Analyse der Marktgröße und Prognosen
- Detaillierte Segmentierungsanalyse
- Tiefgehende Bewertung der Marktdynamik
- Einblicke auf regionaler und nationaler Ebene
- Wettbewerbslandschaft und Unternehmens-Benchmarking
- Strategische Business Intelligence
Erfahrungsberichte
Der SCADA-Systemmarktbericht von Insight Partners ist umfassend und bietet wertvolle Einblicke in aktuelle Trends und Zukunftsprognosen. Das Team war durchweg hochprofessionell, reaktionsschnell und hilfsbereit. Wir sind sehr zufrieden und können die Dienstleistungen wärmstens empfehlen.
RAN KEDEM Partner, Reali Technologies LTDsIch habe einen Bericht über einen sehr spezifischen Softwaremarkt angefordert, und das Team hat ihn innerhalb weniger Tage erstellt. Die Informationen waren sehr relevant und gut präsentiert. Anschließend habe ich einige Änderungen und Ergänzungen zum Bericht angefordert. Das Team reagierte erneut sehr schnell, und ich erhielt den Abschlussbericht in weniger als einer Woche.
JEAN-HERVE JENN Vorsitzende, Future AnalyticaWir haben mit The Insight Partners für eine wichtige Marktstudie und Prognose zusammengearbeitet. Sie gaben uns klare Einblicke in Chancen und Risiken, die uns bei der Gestaltung unserer Pläne halfen. Ihre Recherchen waren benutzerfreundlich und basierten auf soliden Daten. Sie halfen uns, kluge und sichere Entscheidungen zu treffen. Wir können sie wärmstens empfehlen.
PIYUSH NAGPAL Sr. Vizepräsident, Fernlicht GlobalDie Insight Partners lieferten aufschlussreiche, gut strukturierte Marktforschung mit fundierter Fachkompetenz. Ihr Team war durchweg professionell und reaktionsschnell. Die benutzerfreundliche Website ermöglichte den Zugriff auf Branchenberichte. Wir empfehlen sie wärmstens für zuverlässige und hochwertige Forschungsdienstleistungen.
YUKIHIKO ADACHI Geschäftsführer, Deep Blue, LLC.Dies ist das erste Mal, dass ich einen Marktbericht von The Insight Partners erworben habe. Obwohl ich zunächst unsicher war, besuchte ich die Website und fühlte mich dann sicherer, das Risiko einzugehen und einen Marktbericht zu kaufen. Ich bin mit der Qualität des Berichts und dem Kundenservice rundum zufrieden. Ich hatte einige Fragen und Anmerkungen zum ersten Bericht, aber nach einigen E-Mail-Gesprächen mit dem Analysten bin ich überzeugt, dass ich einen Bericht habe, den ich als Input für unseren strategischen Planungsprozess verwenden kann. Vielen Dank, dass Sie sich die Zeit genommen und dies zu einer positiven Erfahrung gemacht haben. Ich werde Ihren Service auf jeden Fall weiterempfehlen und Sie werden meine erste Anlaufstelle sein, wenn wir weitere Marktdaten benötigen.
JOHN SUZUKI Präsident und Chief Executive Officer, Vorstandsmitglied, BK TechnologiesIch möchte mich für Ihre Unterstützung und die Professionalität bedanken, die Sie bei der Bearbeitung meiner Informationsanfrage zum IVD-Markt für Infektionskrankheiten in Nigeria gezeigt haben. Ich schätze Ihre Geduld, Ihre Beratung und die Tatsache, dass Sie bereit waren, einen Rabatt anzubieten, der uns schließlich den Abschluss eines Geschäfts ermöglichte. Ich freue mich darauf, The Insight Partners in Zukunft wieder zu beauftragen, dank des Eindrucks, den Sie bei dieser ersten Begegnung bei mir hinterlassen haben.
DR. CHIJIOKE ONYIA GESCHÄFTSFÜHRERIN, PineCrest Healthcare Ltd.Grund zum Kauf
- Fundierte Entscheidungsfindung
- Marktdynamik verstehen
- Wettbewerbsanalyse
- Kundeneinblicke
- Marktprognosen
- Risikominimierung
- Strategische Planung
- Investitionsbegründung
- Identifizierung neuer Märkte
- Verbesserung von Marketingstrategien
- Steigerung der Betriebseffizienz
- Anpassung an regulatorische Trends


