Marktbericht für Apothekenautomatisierungsgeräte 2031 nach Segmenten, Geografie, Dynamik, jüngsten Entwicklungen und strategischen Erkenntnissen
Historische Daten : 2021-2022 | Basisjahr : 2023 | Prognosezeitraum : 2024-2031Marktgröße und Prognose für Apothekenautomatisierungsgeräte (2021 – 2031), Berichtsabdeckung für globale und regionale Anteils-, Trend- und Wachstumschancenanalyse: Nach Typ (Automatisierte Medikamentenabgabesysteme, Automatisierte Verpackungs- und Etikettiersysteme, Automatisierte Lager- und Bereitstellungssysteme, Automatisierte Compounding-Geräte, Tischtablettenzähler), Endbenutzer (Krankenhausapotheke, Einzelhandelsapotheke, Sonstige) und Geografie
- Status : Veröffentlichte Daten
- Berichtscode : TIPRE00018308
- Kategorie : Biowissenschaften
- Anzahl der Seiten : 150
- Verfügbare Berichtsformate :


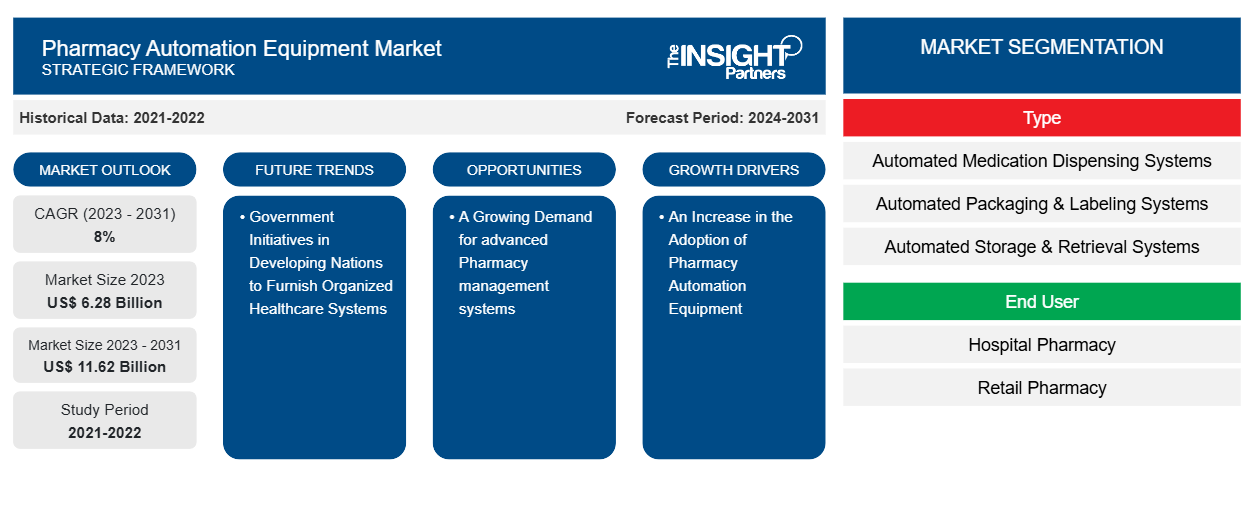
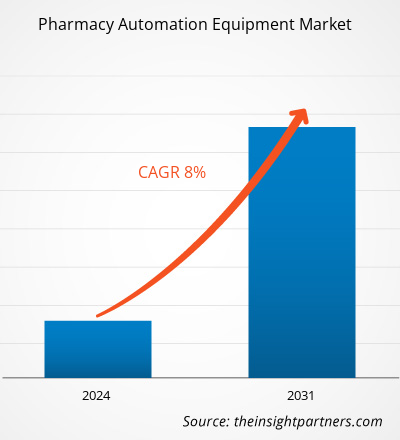
Der Markt für Automatisierungsgeräte für Apotheken soll von 6,28 Milliarden US-Dollar im Jahr 2023 auf 11,62 Milliarden US-Dollar im Jahr 2031 anwachsen. Der Markt wird zwischen 2023 und 2031 voraussichtlich eine durchschnittliche jährliche Wachstumsrate (CAGR) von 8,00 % verzeichnen. Die Einführung von Medikamentenabgabesystemen, Robotern, künstlicher Intelligenz (KI), Telepharmazie und automatisierten Bestandsverwaltungssystemen dürfte ein wichtiger Trend auf dem Markt bleiben.
Marktanalyse für Apothekenautomatisierungsgeräte
Dank neuer Technologien verändert und verbessert sich der Gesundheitssektor ständig, insbesondere für Apotheken. Um Aktualität, Präzision und Genauigkeit zu gewährleisten, müssen Apotheken eine Vielzahl von Systemen verwenden. Daher müssen die in diesem Bereich tätigen Personen über technologische Fortschritte auf dem Laufenden bleiben. Vorreiter der technologischen Revolution zur Verbesserung der Patienten und Gesundheitsdienstleister war die Automatisierung der Apotheken. Dank der Automatisierung, die alles von mühsamen Aufgaben bis hin zum reibungslosen Austausch von Gesundheitsinformationen übernehmen kann, können Apotheker Patientenrezepte jetzt effizienter bearbeiten und produktiver arbeiten.
Marktübersicht für Apothekenautomatisierungsgeräte
Der Markt für Apothekenautomatisierungssysteme wird von den zahlreichen Vorteilen angetrieben, die sie Apotheken bieten. Die Automatisierung verbessert die Genauigkeit, den Apotheken-Workflow und das Patientenerlebnis und senkt gleichzeitig Kosten und medikamentenbezogene Fehler. Zukunftsprognosen für den globalen Automatisierungsmarkt deuten auf ein exponentielles Wachstum der Nachfrage nach Rezepten, der technischen Ausrüstung und der Erweiterung des technologischen Wissens hin. Der Bereich der digitalen Gesundheitsfürsorge wächst rasant und dominiert. Die Zahl der ausgestellten Rezepte wird parallel zur alternden Bevölkerung steigen, was bedeutet, dass die Automatisierung in Zukunft erhebliche Auswirkungen auf die Apothekenpraxis haben wird. Die Automatisierung kombiniert derzeit automatisierte Etikettierung, Verpackung, Lagerung und Abgabe, um Abgabefehler zu verringern und die Produktivität der Apothekenleiter zu steigern. Von diesem Punkt an wird das Unternehmen nur noch Elektronik und Technologie nutzen, um zu wachsen.
Passen Sie diesen Bericht Ihren Anforderungen an
Sie erhalten kostenlos individuelle Anpassungen an jedem Bericht, einschließlich Teilen dieses Berichts oder einer Analyse auf Länderebene, eines Excel-Datenpakets sowie tolle Angebote und Rabatte für Start-ups und Universitäten.
Markt für Apothekenautomatisierungsgeräte: Strategische Einblicke
-
Holen Sie sich die wichtigsten Markttrends aus diesem Bericht.Dieses KOSTENLOSE Beispiel umfasst eine Datenanalyse von Markttrends bis hin zu Schätzungen und Prognosen.
Treiber und Chancen auf dem Markt für Automatisierungsgeräte für Apotheken
Die zunehmende Einführung von Apothekenautomatisierungsgeräten begünstigt das Marktwachstum
Die Automatisierung von Apotheken erfolgt heute mithilfe von Robotik und KI. Mechanische Geräte, die als Apothekenroboter bezeichnet werden, können menschliches Verhalten nachahmen, wenn sie entsprechend programmiert sind, ohne dass ständige Unterstützung durch den Bediener erforderlich ist. Viele automatisierte Workflow-Systeme, Barcodes in Apotheken und Systeme zur Medikamentenausgabe werden beispielsweise als Robotersysteme eingestuft. Künstliche Intelligenz (KI) ist ein sich rasch entwickelndes Feld in der Apothekentechnologie, das für verschiedene Aufgaben wie Polypharmakologie, Darreichungsformdesign, Arzneimittelentdeckung, Computerprogramme und Krankenhausapotheke eingesetzt werden kann. Da KI typischerweise verwendet wird, um menschliche kognitive Aufgaben nachzuahmen, könnte die Pharmaindustrie einen deutlichen Anstieg bei der Verwendung dieser Technologie erleben. Sie kann verwendet werden, um menschenähnliche Aufgaben auf digitalen Computern oder computergesteuerten Robotern (wie z. B. automatisierten Ausgabeschränken) auszuführen. Führende Pharmaunternehmen beginnen, künstliche Intelligenz (KI) in Forschung und Entwicklung, Arzneimittelentdeckung, Gesundheitssystemanalyse, Medikamentengenauigkeit, medizinischer Unterstützung und Betreuung einzusetzen, und helfen bei sich wiederholenden Aufgaben, der Gestaltung von Behandlungsplänen und der Pflege von Krankenakten. KI kann in Krankenhausapotheken für eine Vielzahl von Zwecken eingesetzt werden, darunter Barcode-Scanning, automatisierte Medikamentenzubereitung, automatisierte Nachverfolgung und Abgabe. Daher dürfte eine zunehmende Nutzung in Verbindung mit neuen Anwendungen von Apothekenautomatisierungssystemen das Wachstum des Marktes vorantreiben.barcoding, and medication dispensing systems are all categorized as robotic. Artificial Intelligence (AI) is a rapidly developing field in pharmacy technology that can be applied to various tasks like polypharmacology, dosage form design, drug discovery, computer programs, and hospital pharmacy. Since AI is typically used to mimic human cognitive tasks, the pharmaceutical industry may see a significant increase in its use of this technology. It can be used to carry out human-like tasks on digital computers or computer-controlled robots (such as automated dispensing cabinets). Leading pharmaceutical companies are beginning to use artificial intelligence (AI) in research and development, drug discovery, healthcare system analysis, medication accuracy, medical support, and assistance, helping with repetitive tasks, treatment plan design, and health record maintenance. AI can be used in hospital pharmacies for a variety of purposes, including barcode scanning, automated medication preparation, automated tracking, and dispensing. Thus, an increase in use coupled with emerging applications of pharmacy automation systems is likely to drive the growth of the market.
Regierungsinitiativen in Entwicklungsländern
Da die Gesundheitskosten steigen und der Druck zunimmt, den Zugang zu Dienstleistungen zu verbessern, spielt das Arzneimittelmanagement in Entwicklungsländern eine entscheidende Rolle. So hat sich beispielsweise die Rolle des Apothekers erweitert und umfasst nun auch die Gewährleistung angemessener Beratung , Überwachung und Einhaltung der Medikamenteneinnahme sowie die Verhinderung der Entwicklung einer HIV-Arzneimittelresistenz in vielen ressourcenbeschränkten, vom Virus belasteten Umgebungen. Dies führt zu einem Bedarf an hochmodernen technologischen Lösungen. Die Regierungen der Entwicklungsländer ergreifen verschiedene Maßnahmen, um den Zugang zu diesen Medikamenten zu erleichtern. Um beispielsweise die Bereitstellung von HIV-Behandlungen zu verbessern, hat das Ministerium für Gesundheit und Soziales in Namibia eine mehrmonatige Abgabe eingeführt, um die Ausweitung der antiretroviralen Therapie zu ermöglichen. In Namibias Gesundheitseinrichtungen wird dies derzeit weithin genutzt, was dazu beiträgt, die HIV-Behandlungsziele des Landes zu erreichen. In Indien macht der Krankenhaussektor 80 % des gesamten Gesundheitsmarktes aus. Es besteht eine erhebliche Nachfrage sowohl von inländischen als auch von internationalen Investoren. Folglich werden diese Faktoren im Prognosezeitraum wahrscheinlich erhebliche Wachstumschancen für den Markt für Apothekenautomatisierungsgeräte schaffen.antiretroviral therapy. In Namibia's healthcare facilities, this is currently widely used, which aids in achieving the country's HIV treatment objectives. In India, the hospital sector makes up 80% of the whole healthcare market. There is a significant demand for it from both domestic and international investors. Consequently, during the projected period, these factors are probably going to generate significant growth opportunities for the pharmacy automation equipment market.
Marktbericht zur Automatisierungsausrüstung für Apotheken – Segmentierungsanalyse
Schlüsselsegmente, die zur Ableitung der Marktanalyse für Apothekenautomatisierungsgeräte beigetragen haben, sind Typ und Endbenutzer.
- Nach Typ ist der Markt für Apothekenautomatisierungsgeräte in automatisierte Medikamentenabgabesysteme, automatisierte Verpackungs- und Etikettiersysteme, automatisierte Lager- und Bereitstellungssysteme, automatisierte Mischgeräte und Tischtablettenzähler unterteilt. Das Segment der automatisierten Medikamentenabgabesysteme hatte im Jahr 2023 den größten Marktanteil.
- Nach Endverbraucher ist der Markt in Krankenhausapotheken, Einzelhandelsapotheken und andere segmentiert. Das Segment der Krankenhausapotheken hatte im Jahr 2023 den größten Marktanteil.
Marktanteilsanalyse für Apothekenautomatisierungsgeräte nach Geografie
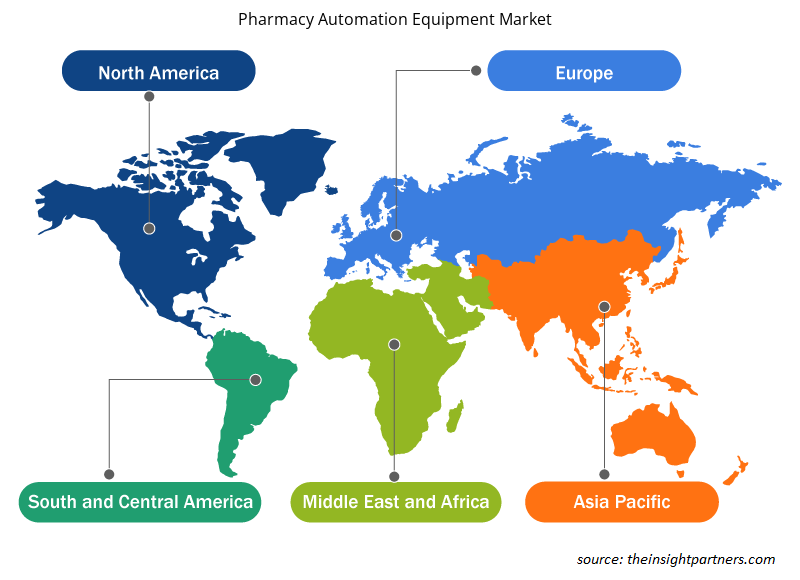
Der geografische Umfang des Marktberichts für Apothekenautomatisierungsgeräte ist hauptsächlich in fünf Regionen unterteilt: Nordamerika, Asien-Pazifik, Europa, Naher Osten und Afrika sowie Süd- und Mittelamerika.
Nordamerika hat den größten Anteil des globalen Marktes erobert. Das Wachstum wird von Faktoren wie der zunehmenden Nutzung von Apothekenautomatisierungsgeräten in den USA, dem wachsenden Gesundheitsbewusstsein der Bevölkerung, zunehmenden Regierungsinitiativen und der Präsenz führender Akteure vorangetrieben. Ein wichtiger Treiber des Marktwachstums ist die Zunahme von Medikationsfehlern und die steigende Nachfrage nach pharmazeutischen Produkten. Die wachsende Patientenzahl in den USA weist auf eine Zunahme der Zahl der Patienten hin, die täglich mehrere Medikamente einnehmen. Untersuchungen zeigen, dass in den USA über 50 % der Patienten mindestens ein Rezept haben und viele davon täglich mehrere Medikamente einnehmen, was sie einem erhöhten Risiko von Medikationsfehlern und potenziellen Gesundheitsrisiken aussetzt. Die steigende Nachfrage nach pharmazeutischen Produkten, die fortschreitende Technologie und der Bedarf an präzisen Robotergeräten und -werkzeugen zur effizienten Ausführung von Aufgaben werden voraussichtlich Schlüsselfaktoren für das Marktwachstum sein.
Regionale Einblicke in den Markt für Apothekenautomatisierungsgeräte
Die regionalen Trends und Faktoren, die den Markt für Apothekenautomatisierungsgeräte während des gesamten Prognosezeitraums beeinflussen, wurden von den Analysten von Insight Partners ausführlich erläutert. In diesem Abschnitt werden auch die Marktsegmente und die Geografie von Apothekenautomatisierungsgeräten in Nordamerika, Europa, im asiatisch-pazifischen Raum, im Nahen Osten und Afrika sowie in Süd- und Mittelamerika erörtert.
- Erhalten Sie regionale Daten zum Markt für Apothekenautomatisierungsgeräte
Umfang des Marktberichts über Automatisierungsgeräte für Apotheken
| Berichtsattribut | Details |
|---|---|
| Marktgröße im Jahr 2023 | 6,28 Milliarden US-Dollar |
| Marktgröße bis 2031 | 11,62 Milliarden US-Dollar |
| Globale CAGR (2023 - 2031) | 8 % |
| Historische Daten | 2021-2022 |
| Prognosezeitraum | 2024–2031 |
| Abgedeckte Segmente |
Nach Typ
|
| Abgedeckte Regionen und Länder |
Nordamerika
|
| Marktführer und wichtige Unternehmensprofile |
|
Dichte der Marktteilnehmer für Apothekenautomatisierungsgeräte: Die Auswirkungen auf die Geschäftsdynamik verstehen
Der Markt für Automatisierungsgeräte für Apotheken wächst rasant. Dies wird durch die steigende Nachfrage der Endnutzer aufgrund von Faktoren wie sich entwickelnden Verbraucherpräferenzen, technologischen Fortschritten und einem größeren Bewusstsein für die Vorteile des Produkts vorangetrieben. Mit der steigenden Nachfrage erweitern Unternehmen ihr Angebot, entwickeln Innovationen, um die Bedürfnisse der Verbraucher zu erfüllen, und nutzen neue Trends, was das Marktwachstum weiter ankurbelt.
Die Marktteilnehmerdichte bezieht sich auf die Verteilung der Firmen oder Unternehmen, die in einem bestimmten Markt oder einer bestimmten Branche tätig sind. Sie gibt an, wie viele Wettbewerber (Marktteilnehmer) in einem bestimmten Marktraum im Verhältnis zu seiner Größe oder seinem gesamten Marktwert präsent sind.
Die wichtigsten Unternehmen auf dem Markt für Automatisierungsgeräte für Apotheken sind:
- Cerner Corporation
- AmerisourceBergen
- Baxter International Inc
- Talyst LLC (Swisslog Healthcare)
- Capsa-Gesundheitswesen
- BD
Haftungsausschluss : Die oben aufgeführten Unternehmen sind nicht in einer bestimmten Reihenfolge aufgeführt.
- Überblick über die wichtigsten Akteure auf dem Markt für Apothekenautomatisierungsgeräte
Neuigkeiten und aktuelle Entwicklungen zum Markt für Automatisierungsgeräte für Apotheken
Der Markt für Apothekenautomatisierungsgeräte wird durch die Erhebung qualitativer und quantitativer Daten nach Primär- und Sekundärforschung bewertet, die wichtige Unternehmensveröffentlichungen, Verbandsdaten und Datenbanken umfasst. Nachfolgend sind einige der Entwicklungen auf dem Markt für Apothekenautomatisierungsgeräte aufgeführt:
- BD (Becton, Dickinson and Company), ein weltweit führendes Medizintechnikunternehmen, und Frazier Healthcare Partners, ein führendes Private-Equity-Unternehmen, das sich ausschließlich auf den Gesundheitssektor konzentriert, haben eine endgültige Vereinbarung bekannt gegeben, wonach BD Parata Systems, einen innovativen Anbieter von Apothekenautomatisierungslösungen, für 1,525 Milliarden US-Dollar übernimmt. (Quelle: BD, Pressemitteilung, Juni 2022)
- Kanadische Apotheken, die den Krankenhaus-, Einzelhandels- und Langzeitpflegemarkt bedienen, haben jetzt Zugang zu Apothekenautomatisierungstechnologie der nächsten Generation, um die Zuverlässigkeit, Effizienz und Sicherheit der Medikamentenverwaltung zu erhöhen. Dazu gehören Verpackungs- und Inspektionssysteme für Haftbeutel sowie halbautomatische Frontlader-Fläschchenabfüllmaschinen. (Quelle: News Letter, April 2024)
Marktbericht zu Automatisierungsgeräten für Apotheken – Umfang und Ergebnisse
Der Bericht „Marktgröße und Prognose für Apothekenautomatisierungsgeräte (2021–2031)“ bietet eine detaillierte Analyse des Marktes, die die folgenden Bereiche abdeckt:
- Marktgröße und Prognose für Apothekenautomatisierungsgeräte auf globaler, regionaler und Länderebene für alle wichtigen Marktsegmente, die im Rahmen des Berichts abgedeckt sind
- Markttrends und Marktdynamiken für Apothekenautomatisierungsgeräte wie Treiber, Einschränkungen und wichtige Chancen
- Detaillierte PEST/Porters Five Forces- und SWOT-Analyse
- Analyse des Marktes für Automatisierungsgeräte für Apotheken, die wichtige Markttrends, globale und regionale Rahmenbedingungen, wichtige Akteure, Vorschriften und aktuelle Marktentwicklungen umfasst.
- Branchenlandschaft und Wettbewerbsanalyse, die die Marktkonzentration, Heatmap-Analyse, prominente Akteure und aktuelle Entwicklungen auf dem Markt für Apothekenautomatisierungsgeräte umfasst
- Detaillierte Firmenprofile

Mrinal ist eine erfahrene Research-Analystin mit über 8 Jahren Erfahrung in der Marktanalyse und Beratung im Bereich Life Sciences. Mit ihrer strategischen Denkweise und ihrem unerschütterlichen Streben nach Exzellenz hat sie sich umfassende Expertise in den Bereichen Pharmaprognosen, Marktchancenbewertung und Entwicklung von Branchen-Benchmarks angeeignet. Ihre Arbeit konzentriert sich darauf, umsetzbare Erkenntnisse zu liefern, die Kunden fundierte strategische Entscheidungen ermöglichen. Mrinals Kernkompetenz liegt in der Übersetzung komplexer quantitativer Datensätze in aussagekräftige Geschäftsinformationen. Ihr analytischer Scharfsinn ist entscheidend für die Entwicklung von Go-to-Market-Strategien (GTM) und die Erschließung von Wachstumschancen in der Pharma- und Medizinproduktebranche. Als vertrauenswürdige Beraterin konzentriert sie sich konsequent auf die Optimierung von Arbeitsabläufen und die Etablierung von Best Practices, um so Innovation und Betriebseffizienz für ihre Kunden zu fördern.
- Historische Analyse (2 Jahre), Basisjahr, Prognose (7 Jahre) mit CAGR
- PEST- und SWOT-Analyse
- Marktgröße Wert/Volumen – Global, Regional, Land
- Branchen- und Wettbewerbslandschaft
- Excel-Datensatz
Erfahrungsberichte
Der SCADA-Systemmarktbericht von Insight Partners ist umfassend und bietet wertvolle Einblicke in aktuelle Trends und Zukunftsprognosen. Das Team war durchweg hochprofessionell, reaktionsschnell und hilfsbereit. Wir sind sehr zufrieden und können die Dienstleistungen wärmstens empfehlen.
RAN KEDEM Partner, Reali Technologies LTDsIch habe einen Bericht über einen sehr spezifischen Softwaremarkt angefordert, und das Team hat ihn innerhalb weniger Tage erstellt. Die Informationen waren sehr relevant und gut präsentiert. Anschließend habe ich einige Änderungen und Ergänzungen zum Bericht angefordert. Das Team reagierte erneut sehr schnell, und ich erhielt den Abschlussbericht in weniger als einer Woche.
JEAN-HERVE JENN Vorsitzende, Future AnalyticaWir haben mit The Insight Partners für eine wichtige Marktstudie und Prognose zusammengearbeitet. Sie gaben uns klare Einblicke in Chancen und Risiken, die uns bei der Gestaltung unserer Pläne halfen. Ihre Recherchen waren benutzerfreundlich und basierten auf soliden Daten. Sie halfen uns, kluge und sichere Entscheidungen zu treffen. Wir können sie wärmstens empfehlen.
PIYUSH NAGPAL Sr. Vizepräsident, Fernlicht GlobalDie Insight Partners lieferten aufschlussreiche, gut strukturierte Marktforschung mit fundierter Fachkompetenz. Ihr Team war durchweg professionell und reaktionsschnell. Die benutzerfreundliche Website ermöglichte den Zugriff auf Branchenberichte. Wir empfehlen sie wärmstens für zuverlässige und hochwertige Forschungsdienstleistungen.
YUKIHIKO ADACHI Geschäftsführer, Deep Blue, LLC.Dies ist das erste Mal, dass ich einen Marktbericht von The Insight Partners erworben habe. Obwohl ich zunächst unsicher war, besuchte ich die Website und fühlte mich dann sicherer, das Risiko einzugehen und einen Marktbericht zu kaufen. Ich bin mit der Qualität des Berichts und dem Kundenservice rundum zufrieden. Ich hatte einige Fragen und Anmerkungen zum ersten Bericht, aber nach einigen E-Mail-Gesprächen mit dem Analysten bin ich überzeugt, dass ich einen Bericht habe, den ich als Input für unseren strategischen Planungsprozess verwenden kann. Vielen Dank, dass Sie sich die Zeit genommen und dies zu einer positiven Erfahrung gemacht haben. Ich werde Ihren Service auf jeden Fall weiterempfehlen und Sie werden meine erste Anlaufstelle sein, wenn wir weitere Marktdaten benötigen.
JOHN SUZUKI Präsident und Chief Executive Officer, Vorstandsmitglied, BK TechnologiesIch möchte mich für Ihre Unterstützung und die Professionalität bedanken, die Sie bei der Bearbeitung meiner Informationsanfrage zum IVD-Markt für Infektionskrankheiten in Nigeria gezeigt haben. Ich schätze Ihre Geduld, Ihre Beratung und die Tatsache, dass Sie bereit waren, einen Rabatt anzubieten, der uns schließlich den Abschluss eines Geschäfts ermöglichte. Ich freue mich darauf, The Insight Partners in Zukunft wieder zu beauftragen, dank des Eindrucks, den Sie bei dieser ersten Begegnung bei mir hinterlassen haben.
DR. CHIJIOKE ONYIA GESCHÄFTSFÜHRERIN, PineCrest Healthcare Ltd.Grund zum Kauf
- Fundierte Entscheidungsfindung
- Marktdynamik verstehen
- Wettbewerbsanalyse
- Kundeneinblicke
- Marktprognosen
- Risikominimierung
- Strategische Planung
- Investitionsbegründung
- Identifizierung neuer Märkte
- Verbesserung von Marketingstrategien
- Steigerung der Betriebseffizienz
- Anpassung an regulatorische Trends


Exklusive Berichtsrabatte freischalten
Jetzt anfragen


 Kostenlose Probe anfordern für - Markt für Apothekenautomatisierungsgeräte