
Marktprognose für Telekommunikationsabrechnung und Umsatzmanagement bis 2034
Marktgröße und Prognose für Telekommunikationsabrechnung und Umsatzmanagement (2021–2034): Globaler und regionaler Marktanteil, Trends und Wachstumspotenzialanalyse. Berichtsabdeckung: Nach Typ (Telekommunikationsabrechnung, Cloud-Abrechnung und IoT-Abrechnung); Komponente (Lösungen und Dienstleistungen); Bereitstellungsart (Cloud, On-Premise und Hybrid); und Geografie.
- Status : Veröffentlichte Daten
- Berichtscode : TIPTE100000103
- Kategorie : Technologie, Medien und Telekommunikation
- Anzahl der Seiten : 150
- Verfügbare Berichtsformate :


- Datum der letzten Aktualisierung : January 19, 2026

Es wird erwartet, dass der Markt für Telekommunikationsabrechnung und Umsatzmanagement bis 2034 ein Volumen von 133,89 Milliarden US-Dollar erreichen wird, gegenüber 39,89 Milliarden US-Dollar im Jahr 2025. Dies entspricht einer durchschnittlichen jährlichen Wachstumsrate (CAGR) von 14,4 % im Zeitraum 2026-2034.
Marktanalyse für Telekommunikationsabrechnung und Umsatzmanagement
Der Markt für Telekommunikationsabrechnung und Umsatzmanagement (BRM) wird voraussichtlich stark wachsen. Treiber dieser Entwicklung sind die rasante Digitalisierung der Telekommunikation, die zunehmende Verbreitung von Datendiensten (wie 5G und IoT) sowie die steigende Nachfrage nach Echtzeitabrechnung und Umsatzsicherung. Cloudbasierte BRM-Lösungen werden von Telekommunikationsanbietern, die operative Effizienz, Flexibilität und Skalierbarkeit anstreben, immer häufiger eingesetzt. Darüber hinaus veranlasst der Bedarf, Umsatzverluste, Betrug und Abrechnungsfehler zu reduzieren, Telekommunikationsunternehmen zu verstärkten Investitionen in fortschrittliche Abrechnungs-, Mediations- und Umsatzsicherungsplattformen.
Marktübersicht Telekommunikationsabrechnung und Umsatzmanagement
Systeme für Abrechnung und Umsatzmanagement (BRM) in der Telekommunikation sind wichtige Software- und Servicelösungen, die Telekommunikationsanbietern die Verwaltung von Abrechnung, Gebühren, Kontoführung, Partnerverbindungen, Betrugsprävention und Umsatzsicherung ermöglichen. Diese Systeme unterstützen Telekommunikationsanbieter bei der Verarbeitung großer Transaktionsvolumina, der Kundenabrechnung, der Echtzeit-Nutzungsüberwachung und der Abrechnung zwischen Netzbetreibern. BRM-Plattformen sind unerlässlich, um die finanzielle Integrität zu wahren, die Umsatzströme zu optimieren und eine effiziente Monetarisierung von Diensten (Sprache, Daten, IoT, Cloud usw.) sicherzustellen.
Durch die Automatisierung und Konsolidierung von Abrechnungs- und Umsatzprozessen ermöglichen BRM-Systeme Telekommunikationsanbietern, sich auf Innovation und Kundenerlebnis zu konzentrieren und gleichzeitig Umsatzverluste und Compliance-Risiken zu minimieren.
Passen Sie diesen Bericht Ihren Anforderungen an.
Sie erhalten eine kostenlose Anpassung aller Berichte – einschließlich Teilen dieses Berichts, Länderanalysen und Excel-Datenpaketen – sowie attraktive Angebote und Rabatte für Start-ups und Universitäten.
Markt für Telekommunikationsabrechnung und Umsatzmanagement: Strategische Einblicke
-
Ermitteln Sie die wichtigsten Markttrends dieses Berichts.Diese KOSTENLOSE Probe beinhaltet eine Datenanalyse, die von Markttrends bis hin zu Schätzungen und Prognosen reicht.
Markttreiber und Chancen im Bereich Telekommunikationsabrechnung und Umsatzmanagement
Markttreiber:
- Wachsende Abonnentenbasis und zunehmender Datenverkehr: Mit steigenden Mobilfunk- und Breitbandabonnements benötigen Kommunikationsdienstleister robuste Abrechnungs- und Umsatzsysteme, um hohe Transaktionsvolumina und vielfältige Servicenutzungen zu bewältigen.
- Einführung von Cloud-basiertem BRM: Telekommunikationsbetreiber verlagern ihren Fokus auf Cloud-Lösungen, um Skalierbarkeit zu erreichen, den Kapitalaufwand zu reduzieren und ein schnelles Geschäftswachstum zu unterstützen.
- Anforderungen an Umsatzsicherung und Betrugsprävention: Die zunehmende Komplexität von Telekommunikationsdiensten (wie Roaming, Interconnect, IoT) erfordert leistungsstarke Systeme, um Umsatzverluste zu verhindern und Betrug aufzudecken.
- Digitale Transformation & Echtzeit-Abrechnung: Mit 5G, IoT und konvergierten Diensten werden Echtzeit-Abrechnung und -Abrechnung entscheidend für die Monetarisierung und Kundenzufriedenheit.
Marktchancen:
- IoT und neue Servicemodelle: Das Wachstum des IoT (Internet der Dinge) eröffnet CSPs Möglichkeiten, die Nutzung über dynamische Abrechnungsmodelle (z. B. nutzungsbasiert, Abonnement) und Partnerabrechnung zu monetarisieren.
- Integration von KI und Analytik: Der Einsatz von KI/ML zur Vorhersage von Umsatzverlusten, zur Optimierung der Preisgestaltung, zur Erkennung von Anomalien und zur Personalisierung der Abrechnung kann zur Differenzierung beitragen.
- Schwellenländer: Wachstumsstarke Regionen (insbesondere im asiatisch-pazifischen Raum, im Nahen Osten und in Afrika) investieren angesichts der zunehmenden Telekommunikationsdurchdringung in moderne BRM-Systeme.
- Hybride Bereitstellungsmodelle: Telekommunikationsunternehmen setzen zunehmend auf hybride BRM-Architekturen (Cloud + On-Premise), um Kontrolle, Compliance und Flexibilität in Einklang zu bringen.
Marktbericht für Telekommunikationsabrechnung und Umsatzmanagement: Segmentierungsanalyse
Der Markt ist wie folgt segmentiert (entsprechend der Taxonomie im Bericht):
Nach Typ:
- Telekommunikationsabrechnung
- Cloud-Abrechnung
- IoT-Abrechnung
Nach Komponente:
- Lösung
- Dienstleistungen
Nach Bereitstellungstyp:
- Vor Ort
- Cloud-basiert
- Hybrid
Nach Geographie:
- Nordamerika
- Europa
- Asien-Pazifik
- Naher Osten und Afrika
- Süd- und Mittelamerika
Markt für Telekommunikationsabrechnung und Umsatzmanagement – Regionale Einblicke
Die regionalen Trends und Einflussfaktoren auf den Markt für Telekommunikationsabrechnung und Umsatzmanagement im gesamten Prognosezeitraum wurden von den Analysten von The Insight Partners eingehend erläutert. Dieser Abschnitt behandelt außerdem die Marktsegmente und die geografische Verteilung des Marktes für Telekommunikationsabrechnung und Umsatzmanagement in Nordamerika, Europa, Asien-Pazifik, dem Nahen Osten und Afrika sowie Süd- und Mittelamerika.
Umfang des Marktberichts zu Telekommunikationsabrechnung und Umsatzmanagement
| Berichtattribute | Details |
|---|---|
| Marktgröße im Jahr 2025 | 39,89 Milliarden US-Dollar |
| Marktgröße bis 2034 | 133,89 Milliarden US-Dollar |
| Globale durchschnittliche jährliche Wachstumsrate (2026 - 2034) | 14,4 % |
| Historische Daten | 2021-2024 |
| Prognosezeitraum | 2026–2034 |
| Abgedeckte Segmente |
Nach Typ
|
| Abgedeckte Regionen und Länder |
Nordamerika
|
| Marktführer und wichtige Unternehmensprofile |
|
Marktdichte der Akteure im Telekommunikationsabrechnungs- und Umsatzmanagement: Auswirkungen auf die Geschäftsdynamik verstehen
Der Markt für Telekommunikationsabrechnung und Umsatzmanagement wächst rasant, angetrieben durch die steigende Nachfrage der Endnutzer. Gründe hierfür sind unter anderem sich wandelnde Verbraucherpräferenzen, technologische Fortschritte und ein wachsendes Bewusstsein für die Vorteile des Produkts. Mit steigender Nachfrage erweitern Unternehmen ihr Angebot, entwickeln innovative Lösungen, um den Kundenbedürfnissen gerecht zu werden, und nutzen neue Trends, was das Marktwachstum zusätzlich beflügelt.
- Verschaffen Sie sich einen Überblick über die wichtigsten Akteure im Markt für Telekommunikationsabrechnung und Umsatzmanagement.
Marktanteilsanalyse für Telekommunikationsabrechnung und Umsatzmanagement nach Regionen
- Nordamerika: Starke Präsenz aufgrund ausgereifter Telekommunikationsinfrastruktur, hoher Akzeptanz von Umsatzsicherung und Konsolidierung der Serviceanbieter.
- Europa: Moderates Wachstum, getrieben durch die Einhaltung regulatorischer Vorgaben, die Modernisierung veralteter Systeme und den Ausbau von 5G.
- Asien-Pazifik: Es wird erwartet, dass es aufgrund der zunehmenden Verbreitung von Telekommunikationsdiensten, Initiativen zur digitalen Transformation und der hohen Akzeptanz von IoT zu einem rasanten Wachstum kommen wird.
- Naher Osten und Afrika: Neue Chancen durch die Modernisierung der Abrechnungsinfrastruktur von Telekommunikationsanbietern für eine bessere Monetarisierung und Effizienz.
- Süd- und Mittelamerika: Wachstumspotenzial durch steigende Mobilfunkteilnehmerzahlen, MVNOs und Investitionen in moderne Abrechnungssysteme.
Marktdichte der Akteure im Telekommunikationsabrechnungs- und Umsatzmanagement: Auswirkungen auf die Geschäftsdynamik verstehen
Der BRM-Markt ist mäßig konzentriert und besteht aus einer Mischung großer globaler BSS/OSS-Anbieter und Nischenanbietern. Die wichtigsten Anbieter konkurrieren über die Komplexität ihrer Lösungen (Echtzeitabrechnung, Betrugsmanagement), Cloud-native Architekturen und Managed Services.
Wettbewerbsdifferenzierung wird vorangetrieben durch:
- Unterstützung für konvergente Abrechnung und Echtzeit-Abrechnung
- Skalierbare Cloud-Bereitstellung
- KI-gestützte Umsatzsicherung und Anomalieerkennung
- Interconnect- und Partnerabrechnungsfunktionen
Zu den strategischen Zügen, die Spieler vornehmen oder vornehmen können, gehören:
- Partnerschaften mit CSPs für Initiativen zur digitalen Transformation
- Integration von KI/ML zur Reduzierung von Umsatzverlusten und zur Automatisierung der Betrugserkennung
- Verbesserung des Cloud-BRM-Angebots für kleinere Betreiber und aufstrebende Märkte
- Wir bieten hybride BRM-Implementierungen an, um bestehende Investitionen und Flexibilität in Einklang zu bringen.
Wichtige Unternehmen, die im Markt für Telekommunikationsabrechnung und Umsatzmanagement tätig sind
Zu den wichtigsten Akteuren in diesem Markt gehören (basierend auf der Analyse von The Insight Partners):
- Amdocs, Inc.
- CSG Systems International, Inc.
- Ericsson
- Hewlett-Packard Development Company, LP
- Huawei Technologies Co., Ltd.
- Accenture PLC
- Cerillion PLC
- goTransverse International, Inc.
- Alcatel-Lucent SA
Weitere namhafte Spieler, die analysiert wurden:
- Oracle Corporation
- Netcracker / BSS-Anbieter
- Optiva, Subex usw.
Neuigkeiten und aktuelle Entwicklungen im Markt für Telekommunikationsabrechnung und Umsatzmanagement
- Einführung von Cloud-BRM: Telekommunikationsbetreiber migrieren zunehmend zu Cloud-basierten Abrechnungslösungen, um dynamische Servicemodelle zu unterstützen und ihre Geschäftstätigkeit zu skalieren.
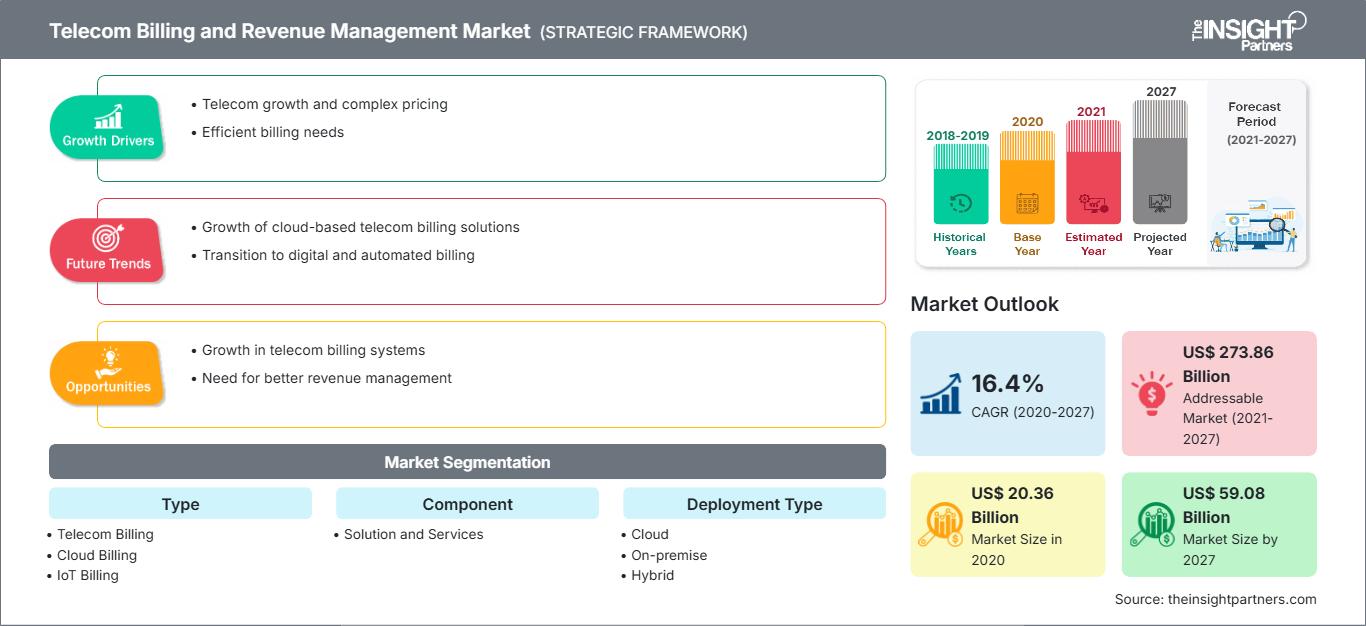
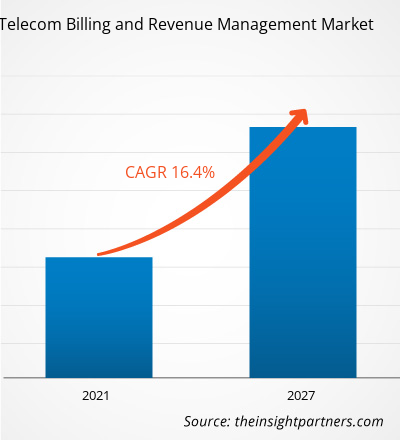
- Hohe Wachstumsprognosen: Laut The Insight Partners wird der BRM-Markt bis 2027 voraussichtlich ein Volumen von 59,08 Milliarden US-Dollar erreichen, was einem jährlichen Wachstum von 16,4 % entspricht.
- Zunehmender Fokus auf KI und Automatisierung: Um Betrug zu bekämpfen, Umsatzverluste zu reduzieren und Echtzeit-Abrechnung zu unterstützen, integrieren BRM-Anbieter KI-gestützte Analysen in ihre Plattformen.
- Expansion in aufstrebenden Regionen: Steigende Investitionen im Telekommunikationssektor in der APAC- und MEA-Region drängen BRM-Anbieter dazu, ihre Präsenz in diesen Märkten zu stärken.
Marktbericht zu Telekommunikationsabrechnung und Umsatzmanagement: Abdeckung und Ergebnisse
Der Bericht „Markt für Telekommunikationsabrechnung und Umsatzmanagement – Prognose bis 2027“ von The Insight Partners bietet Folgendes:
- Marktgröße und Prognose auf globaler, regionaler und Länderebene für alle wichtigen Segmente.
- Markttrends, Treiber, Hemmnisse und Chancen.
- Detaillierte PEST- und SWOT-Analyse des Marktes.
- Wettbewerbsumfeld: Konzentrationsanalyse, Anbieter-Heatmap, Hauptakteure und aktuelle Entwicklungen.
- Unternehmensprofile: Geschäftsüberblick, Produktportfolio, Finanzkennzahlen, Strategie.

Ankita ist eine dynamische Marktforschungs- und Beratungsexpertin mit über 8 Jahren Erfahrung in den Bereichen Technologie, Medien, IKT sowie Elektronik und Halbleiter. Sie hat über 100 Beratungs- und Forschungsaufträge für globale Kunden wie Microsoft, Oracle, NEC Corporation, SAP, KPMG und Expeditors International erfolgreich geleitet und durchgeführt. Zu ihren Kernkompetenzen gehören Marktbewertung, Datenanalyse, Prognose, Strategieformulierung, Wettbewerbsbeobachtung und das Verfassen von Berichten. Ankita ist versiert in der Abwicklung kompletter Projektzyklen – von der Angebotserstellung vor dem Verkauf und Kundengesprächen bis hin zur Bereitstellung umsetzbarer Erkenntnisse nach dem Verkauf. Sie ist versiert in der Leitung funktionsübergreifender Teams, der Strukturierung komplexer Forschungsmodule und der Ausrichtung von Lösungen an kundenspezifischen Geschäftszielen. Ihre ausgezeichneten Kommunikationsfähigkeiten, Führungsqualitäten und Präsentationsfähigkeiten haben es ihr ermöglicht, in einem schnelllebigen und sich entwickelnden Marktumfeld stets wertorientierte Ergebnisse zu liefern.
- Umfassende Analyse der Marktgröße und Prognosen
- Detaillierte Segmentierungsanalyse
- Tiefgehende Bewertung der Marktdynamik
- Einblicke auf regionaler und nationaler Ebene
- Wettbewerbslandschaft und Unternehmens-Benchmarking
- Strategische Business Intelligence
Erfahrungsberichte
Der SCADA-Systemmarktbericht von Insight Partners ist umfassend und bietet wertvolle Einblicke in aktuelle Trends und Zukunftsprognosen. Das Team war durchweg hochprofessionell, reaktionsschnell und hilfsbereit. Wir sind sehr zufrieden und können die Dienstleistungen wärmstens empfehlen.
RAN KEDEM Partner, Reali Technologies LTDsIch habe einen Bericht über einen sehr spezifischen Softwaremarkt angefordert, und das Team hat ihn innerhalb weniger Tage erstellt. Die Informationen waren sehr relevant und gut präsentiert. Anschließend habe ich einige Änderungen und Ergänzungen zum Bericht angefordert. Das Team reagierte erneut sehr schnell, und ich erhielt den Abschlussbericht in weniger als einer Woche.
JEAN-HERVE JENN Vorsitzende, Future AnalyticaWir haben mit The Insight Partners für eine wichtige Marktstudie und Prognose zusammengearbeitet. Sie gaben uns klare Einblicke in Chancen und Risiken, die uns bei der Gestaltung unserer Pläne halfen. Ihre Recherchen waren benutzerfreundlich und basierten auf soliden Daten. Sie halfen uns, kluge und sichere Entscheidungen zu treffen. Wir können sie wärmstens empfehlen.
PIYUSH NAGPAL Sr. Vizepräsident, Fernlicht GlobalDie Insight Partners lieferten aufschlussreiche, gut strukturierte Marktforschung mit fundierter Fachkompetenz. Ihr Team war durchweg professionell und reaktionsschnell. Die benutzerfreundliche Website ermöglichte den Zugriff auf Branchenberichte. Wir empfehlen sie wärmstens für zuverlässige und hochwertige Forschungsdienstleistungen.
YUKIHIKO ADACHI Geschäftsführer, Deep Blue, LLC.Dies ist das erste Mal, dass ich einen Marktbericht von The Insight Partners erworben habe. Obwohl ich zunächst unsicher war, besuchte ich die Website und fühlte mich dann sicherer, das Risiko einzugehen und einen Marktbericht zu kaufen. Ich bin mit der Qualität des Berichts und dem Kundenservice rundum zufrieden. Ich hatte einige Fragen und Anmerkungen zum ersten Bericht, aber nach einigen E-Mail-Gesprächen mit dem Analysten bin ich überzeugt, dass ich einen Bericht habe, den ich als Input für unseren strategischen Planungsprozess verwenden kann. Vielen Dank, dass Sie sich die Zeit genommen und dies zu einer positiven Erfahrung gemacht haben. Ich werde Ihren Service auf jeden Fall weiterempfehlen und Sie werden meine erste Anlaufstelle sein, wenn wir weitere Marktdaten benötigen.
JOHN SUZUKI Präsident und Chief Executive Officer, Vorstandsmitglied, BK TechnologiesIch möchte mich für Ihre Unterstützung und die Professionalität bedanken, die Sie bei der Bearbeitung meiner Informationsanfrage zum IVD-Markt für Infektionskrankheiten in Nigeria gezeigt haben. Ich schätze Ihre Geduld, Ihre Beratung und die Tatsache, dass Sie bereit waren, einen Rabatt anzubieten, der uns schließlich den Abschluss eines Geschäfts ermöglichte. Ich freue mich darauf, The Insight Partners in Zukunft wieder zu beauftragen, dank des Eindrucks, den Sie bei dieser ersten Begegnung bei mir hinterlassen haben.
DR. CHIJIOKE ONYIA GESCHÄFTSFÜHRERIN, PineCrest Healthcare Ltd.Grund zum Kauf
- Fundierte Entscheidungsfindung
- Marktdynamik verstehen
- Wettbewerbsanalyse
- Kundeneinblicke
- Marktprognosen
- Risikominimierung
- Strategische Planung
- Investitionsbegründung
- Identifizierung neuer Märkte
- Verbesserung von Marketingstrategien
- Steigerung der Betriebseffizienz
- Anpassung an regulatorische Trends


