
Tamaño del mercado de herramientas de detección de fraude publicitario y oportunidades clave para 2034
Tamaño y pronóstico del mercado de herramientas de detección de fraude publicitario (2021-2034), participación global y regional, tendencias y análisis de oportunidades de crecimiento. Cobertura del informe: por tipo (sitio web y móvil) y usuario final (comercio electrónico, viajes, finanzas, juegos, etc.).
- Estado : Datos publicados
- Código de informe : TIPRE00019813
- Categoría : Tecnología, medios y telecomunicaciones
- Número de páginas : 150
- Formatos de informe disponibles :


- Fecha de última actualización : December 11, 2025

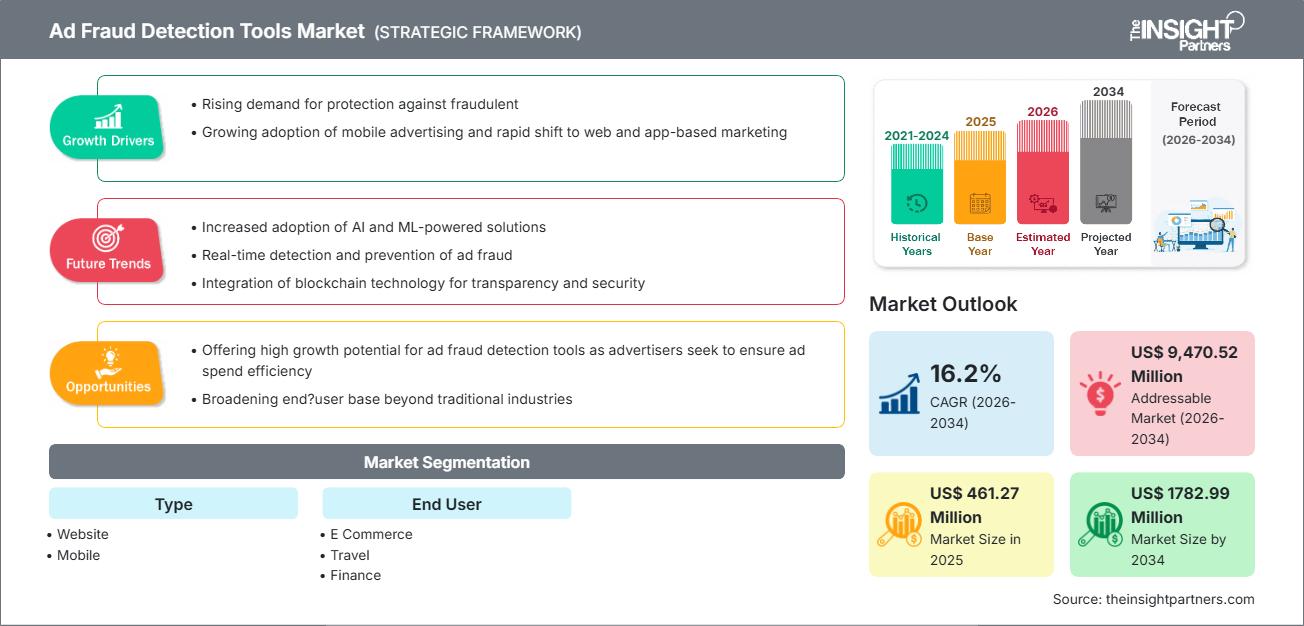
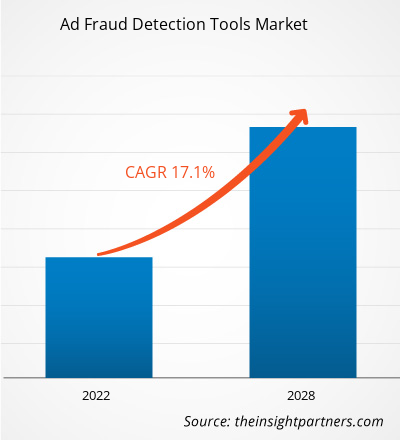
Se espera que el tamaño del mercado de herramientas de detección de fraude publicitario crezca de US$ 461,27 millones en 2025 a US$ 1782,99 millones en 2034. Se prevé que el mercado registre una tasa de crecimiento anual compuesta (TCAC) del 16,2 % entre 2026 y 2034.
Análisis del mercado de herramientas de detección de fraude publicitario
El pronóstico del mercado de herramientas de detección de fraude publicitario indica un fuerte crecimiento, impulsado por el creciente número de campañas publicitarias digitales, la creciente conciencia sobre el fraude publicitario y la necesidad de proteger el gasto publicitario del tráfico fraudulento y los clics no válidos.
La expansión se ve facilitada por el uso creciente de publicidad móvil y web, la proliferación de PYMES y empresas emergentes que utilizan el marketing digital y el aumento del gasto publicitario en el comercio electrónico, las finanzas, los juegos y otros sectores digitales.
Además, el cambio hacia la publicidad multidispositivo y multicanal y el aumento de la compra programática de anuncios hacen que las herramientas de detección de fraude publicitario sean esenciales para maximizar el ROI y prevenir la fuga de ingresos, lo que posiciona a dichas herramientas como críticas para los anunciantes de todos los tamaños.
Descripción general del mercado de herramientas de detección de fraude publicitario
Las herramientas de detección de fraude publicitario son soluciones especializadas diseñadas para identificar, prevenir y mitigar actividades fraudulentas en la publicidad online, como el fraude de clics, el fraude de impresiones, el fraude de instalaciones y otro tráfico no válido (IVT) o tráfico no humano. Estas herramientas ayudan a los anunciantes a garantizar que su inversión publicitaria genere una interacción genuina con el usuario, métricas precisas y conversiones legítimas.
Al automatizar la detección de tráfico sospechoso, supervisar campañas en tiempo real y proporcionar análisis e informes, estas herramientas permiten a los anunciantes optimizar el rendimiento de sus anuncios, reducir las pérdidas financieras y proteger la reputación de la marca. A medida que la publicidad digital crece en complejidad y escala, las herramientas de detección de fraude publicitario actúan como un pilar fundamental para la seguridad e integridad de la publicidad digital en sectores como el comercio electrónico, las finanzas, los videojuegos, los viajes y otros.
Personalice este informe según sus necesidades
Obtendrá personalización en cualquier informe, sin cargo, incluidas partes de este informe o análisis a nivel de país, paquete de datos de Excel, así como también grandes ofertas y descuentos para empresas emergentes y universidades.
Mercado de herramientas de detección de fraude publicitario: Perspectivas estratégicas
-
Obtenga las principales tendencias clave del mercado de este informe.Esta muestra GRATUITA incluirá análisis de datos, desde tendencias del mercado hasta estimaciones y pronósticos.
Impulsores y oportunidades del mercado de herramientas de detección de fraude publicitario
Factores impulsores del mercado:
- Crece la demanda de protección contra el tráfico publicitario fraudulento a medida que la publicidad digital y la compra programática de anuncios se expanden globalmente.
- La creciente adopción de publicidad móvil y el rápido cambio hacia el marketing basado en la web y en aplicaciones; el crecimiento del gasto en publicidad impulsado por los dispositivos móviles alimenta la necesidad de detección de fraudes.
- Un número cada vez mayor de pymes y empresas emergentes utilizan el marketing digital, lo que genera una adopción más amplia de herramientas de detección de fraude publicitario para salvaguardar sus presupuestos publicitarios.
Oportunidades de mercado:
- La expansión a través de mercados emergentes, regiones donde la publicidad digital está creciendo rápidamente (por ejemplo, Asia-Pacífico, otras regiones en desarrollo), ofrece un alto potencial de crecimiento para las herramientas de detección de fraude publicitario a medida que los anunciantes buscan garantizar la eficiencia del gasto publicitario.
- Al ampliar la base de usuarios finales más allá de las industrias tradicionales: comercio electrónico, juegos, finanzas, viajes, a medida que más sectores dependen de la publicidad digital, aumenta la demanda de una detección robusta de fraude.
- La creciente sofisticación de los esquemas fraudulentos (bots, granjas de clics, fraude de instalación, fraude de impresiones) impulsa la demanda de herramientas avanzadas de detección y análisis en tiempo real, posiblemente aprovechando ML/AI y análisis de big data para mantenerse por delante de los estafadores.
Análisis de segmentación del mercado de herramientas de detección de fraude publicitario
Por tipo:
- Sitio web
- Móvil
Por usuario final:
- Comercio electrónico
- Viajar
- Finanzas
- Juego de azar
Por geografía:
- América del norte
- Europa
- Asia-Pacífico (APAC)
- América del Sur y Central (SAM)
- Oriente Medio y África (MEA)
Perspectivas regionales del mercado de herramientas de detección de fraude publicitario
Los analistas de The Insight Partners han explicado detalladamente las tendencias regionales y los factores que influyen en el mercado de herramientas de detección de fraude publicitario durante el período de pronóstico. Esta sección también analiza los segmentos y la geografía del mercado de herramientas de detección de fraude publicitario en América del Norte, Europa, Asia Pacífico, Oriente Medio y África, y América del Sur y Central.
Alcance del informe de mercado sobre herramientas de detección de fraude publicitario
| Atributo del informe | Detalles |
|---|---|
| Tamaño del mercado en 2025 | US$ 461,27 millones |
| Tamaño del mercado en 2034 | US$ 1782,99 millones |
| CAGR global (2026-2034) | 16,2% |
| Datos históricos | 2021-2024 |
| Período de pronóstico | 2026-2034 |
| Segmentos cubiertos |
Por tipo
|
| Regiones y países cubiertos |
América del norte
|
| Líderes del mercado y perfiles de empresas clave |
|
Densidad de actores del mercado de herramientas de detección de fraude publicitario: comprensión de su impacto en la dinámica empresarial
El mercado de herramientas de detección de fraude publicitario está creciendo rápidamente, impulsado por la creciente demanda de los usuarios finales debido a factores como la evolución de las preferencias de los consumidores, los avances tecnológicos y una mayor conciencia de los beneficios del producto. A medida que aumenta la demanda, las empresas amplían su oferta, innovan para satisfacer las necesidades de los consumidores y aprovechan las tendencias emergentes, lo que impulsa aún más el crecimiento del mercado.
- Obtenga una descripción general de los principales actores clave del mercado de herramientas de detección de fraude publicitario
Análisis de la participación geográfica del mercado de herramientas de detección de fraude publicitario por región
- América del Norte: a partir de 2021, América del Norte tenía una participación significativa del mercado global de herramientas de detección de fraude publicitario, beneficiándose de un alto gasto en publicidad digital, la adopción de tecnología avanzada y una fuerte demanda de prevención del fraude.
- Europa: La presencia de mercados publicitarios digitales maduros y el creciente escrutinio regulatorio sobre la transparencia publicitaria y la prevención del fraude contribuyen a una demanda constante de herramientas de detección de fraude publicitario.
- Asia-Pacífico (APAC): La región representa una oportunidad de alto crecimiento, impulsada por la rápida expansión de la publicidad digital, un número creciente de PYMES y plataformas de comercio electrónico, y una creciente conciencia sobre el fraude publicitario entre los anunciantes.
- Sudamérica y Centroamérica (SAM) y Oriente Medio y África (MEA): Estos son mercados emergentes con una creciente penetración digital y una inversión publicitaria en aumento gradual. A medida que la publicidad digital se expande en estas regiones, se prevé un aumento en la demanda de herramientas de detección de fraude publicitario.
En general, si bien América del Norte sigue siendo la región dominante en la actualidad, se anticipa que el crecimiento más rápido se dará en Asia-Pacífico y otras regiones emergentes debido a la creciente adopción de publicidad digital y las crecientes preocupaciones sobre el fraude publicitario.
Densidad y competencia de los actores del mercado de herramientas de detección de fraude publicitario
Este entorno competitivo impulsa a los proveedores a diferenciarse mediante:
- Capacidades avanzadas de detección de fraude (móvil + web, seguimiento entre dispositivos, análisis en tiempo real)
- Escalabilidad para servir tanto a PYMES como a grandes empresas
- Integración con plataformas publicitarias, herramientas de análisis y pilas de marketing
- Flexibilidad para adaptarse a patrones de fraude cambiantes y formatos de anuncios (video, móvil, programático, etc.)
Aún existen oportunidades para los actores emergentes, especialmente aquellos que se centran en soluciones personalizadas para geografías específicas (por ejemplo, APAC, MEA) o verticales de la industria (juegos, finanzas, comercio electrónico), donde el gasto en publicidad digital está aumentando rápidamente y el riesgo de fraude es alto.
El mercado global de herramientas de detección de fraude publicitario cuenta con varios proveedores destacados, entre ellos:
- AppsFlyer Ltd.
- Adjust GmbH
- Métricas de sucursales, Inc.
- Puntuación de fraude
- Interceptado (App Samurai Inc.)
- Publicidad de máquinas limitada
- Perform[cb], LLC
- Scalarr Inc.
- Laboratorios Singular, Inc.
Otros actores analizados durante el curso de la investigación son:
- Ciencia de la Publicidad Integral (IAS)
- Doble verificación
- Foso
- HUMANO (anteriormente White Ops)
- Fraudlogix
- Pixalate
- Forensiq (por Impact)
- CHEQ AI Technologies Ltd. (CHEQ)
Oportunidades y movimientos estratégicos
- Colabore con plataformas de publicidad digital, redes de publicidad móvil y editores para integrar la detección de fraude como parte de la entrega y el análisis de anuncios, lo que garantiza una protección en tiempo real y una mejor integración.
- Amplíe su alcance en mercados de alto crecimiento (Asia-Pacífico, América Latina, Medio Oriente) ofreciendo soluciones escalables y rentables diseñadas para pymes y anunciantes emergentes.
- Invierta en análisis avanzados, aprendizaje automático/IA y capacidades de big data para detectar fraudes sofisticados (bots, granjas de clics, fraudes de instalación, fraudes entre dispositivos) y adaptarse a las amenazas cambiantes.
- Ofrecer soluciones integrales que combinen detección de fraude, análisis del rendimiento de los anuncios y optimización de campañas para brindar el máximo valor a los anunciantes, mejorando el ROI y mitigando el riesgo.
Mercado de herramientas de detección de fraude publicitario, noticias y novedades
- El rápido cambio hacia la publicidad móvil y el uso creciente de compras programáticas de anuncios han acentuado la demanda de herramientas de detección de fraude, ya que los dispositivos móviles comprenden una parte sustancial del gasto en publicidad digital y el fraude publicitario basado en dispositivos móviles es uno de los más desafiantes.
- Las PYMES y las empresas emergentes están adoptando cada vez más herramientas de detección de fraude publicitario a medida que más pequeñas y medianas empresas trasladan sus esfuerzos de marketing en línea, creando una base de clientes más amplia y creciente más allá de las grandes empresas.
- A medida que los presupuestos publicitarios siguen aumentando a nivel mundial (en comercio electrónico, videojuegos, finanzas, etc.), la necesidad de transparencia, integridad de las campañas y protección del ROI impulsa la adopción de servicios de detección avanzados. Esta tendencia se ha acelerado desde que la pandemia de COVID-19 desencadenó un aumento repentino de la publicidad digital y la actividad en línea.
Informe de mercado sobre herramientas de detección de fraude publicitario: cobertura y resultados
El informe "Pronóstico del mercado de herramientas de detección de fraude publicitario (2021-2034): impacto de la COVID-19 y análisis global" de The Insight Partners ofrece:
- Tamaño del mercado y pronóstico (global, por región) para 2021-2034
- Tendencias del mercado, impulsores, limitaciones y oportunidades clave de crecimiento
- Segmentación detallada por tipo (sitio web, móvil), usuario final (comercio electrónico, viajes, finanzas, juegos, otros) y geografía
- Información regional sobre América del Norte, Europa, Asia-Pacífico, América del Sur y Central, y Oriente Medio y África, incluidos los principales países.
- Panorama competitivo que abarca los principales actores y sus perfiles, estrategias y posicionamiento en el mercado

Ankita es una profesional dinámica en investigación de mercados y consultoría con más de 8 años de experiencia en los sectores de tecnología, medios de comunicación, TIC, electrónica y semiconductores. Ha liderado y ejecutado con éxito más de 100 proyectos de consultoría e investigación para clientes globales como Microsoft, Oracle, NEC Corporation, SAP, KPMG y Expeditors International. Sus principales competencias incluyen la evaluación de mercado, el análisis de datos, la previsión, la formulación de estrategias, la inteligencia competitiva y la redacción de informes.
Ankita es experta en la gestión de ciclos completos de proyecto, desde el diseño de propuestas de preventa y las conversaciones con los clientes hasta la entrega de información práctica posventa. Es experta en la gestión de equipos multifuncionales, la estructuración de módulos de investigación complejos y la alineación de soluciones con los objetivos de negocio específicos del cliente. Sus excelentes habilidades de comunicación, liderazgo y presentación le han permitido obtener constantemente resultados orientados al valor en entornos de mercado dinámicos y en constante evolución.
- Análisis exhaustivo del tamaño del mercado y previsiones
- Análisis detallado de la segmentación
- Evaluación en profundidad de la dinámica del mercado
- Información a nivel regional y nacional
- Panorama competitivo y análisis comparativo de empresas
- Inteligencia empresarial estratégica
Testimonios
El informe de mercado de sistemas SCADA de Insight Partners es completo y ofrece información valiosa sobre las tendencias actuales y las previsiones futuras. El equipo fue altamente profesional, receptivo y me brindó un gran apoyo en todo momento. Estamos muy satisfechos y recomendamos ampliamente sus servicios.
RAN KEDEM Socio, Reali Technologies LTDsSolicité un informe sobre un mercado de software muy específico y el equipo lo elaboró en pocos días. La información era muy relevante y estaba bien presentada. Posteriormente, solicité algunos cambios y adiciones al informe. El equipo fue muy receptivo y recibí el informe final en menos de una semana.
JEAN-HERVE JENN Presidente, Future AnalyticaTrabajamos con The Insight Partners para un importante estudio y pronóstico de mercado. Nos brindaron una visión clara de las oportunidades y los riesgos, lo que nos ayudó a definir nuestros planes. Su investigación fue fácil de usar y se basó en datos sólidos. Nos ayudó a tomar decisiones inteligentes y seguras. Los recomendamos ampliamente.
PIYUSH NAGPAL Vicepresidente Sénior, , High Beam GlobalThe Insight Partners realizó una investigación de mercado profunda y bien estructurada con una sólida experiencia en el sector. Su equipo fue profesional y receptivo en todo momento. El sitio web, fácil de usar, facilitó el acceso a los informes del sector. Los recomendamos ampliamente por sus servicios de investigación confiables y de alta calidad.
YUKIHIKO ADACHI Director Ejecutivo, , Deep Blue, LLCEsta es la primera vez que compro un informe de mercado de The Insight Partners. Aunque al principio tenía dudas, visité su sitio web y me sentí más cómodo al arriesgarme y comprarlo. Estoy completamente satisfecho con la calidad del informe y el servicio al cliente. Tenía varias preguntas y comentarios sobre el informe inicial, pero después de un par de conversaciones por correo electrónico con su analista, creo que tengo un informe que puedo usar como base para nuestro proceso de planificación estratégica. Muchas gracias por tomarse el tiempo y hacer de esta una experiencia positiva. Sin duda, recomendaré sus servicios y serán mi primera opción cuando necesitemos más datos de mercado.
JOHN SUZUKI Presidente y Director Ejecutivo, Director de la Junta Directiva, BK TechnologiesAgradezco su apoyo y la profesionalidad que demostraron al atender mi solicitud de información sobre el mercado de diagnóstico in vitro (IVD) para enfermedades infecciosas en Nigeria. Agradezco su paciencia, su orientación y su disposición a ofrecerme un descuento, lo que finalmente nos permitió cerrar un trato. Espero poder colaborar con The Insight Partners en el futuro, gracias a la impresión que me causó este primer encuentro.
DRA. CHIJIOKE ONYIA, DIRECTORA GENERAL, PineCrest Healthcare Ltd.Razón para comprar
- Toma de decisiones informada
- Comprensión de la dinámica del mercado
- Análisis competitivo
- Información sobre clientes
- Pronósticos del mercado
- Mitigación de riesgos
- Planificación estratégica
- Justificación de la inversión
- Identificación de mercados emergentes
- Mejora de las estrategias de marketing
- Impulso de la eficiencia operativa
- Alineación con las tendencias regulatorias


