
Ad Fraud Detection Tools Market Size & Key Opportunities 2034
Coverage: By Type (Website and Mobile) and End User (E Commerce, Travel, Finance, Gaming, and Others)
- Status : Data Released
- Report Code : TIPRE00019813
- Category : Technology, Media and Telecommunications
- No. of Pages : 150
- Available Report Formats :


- Last update date : December 11, 2025

2025 Market Size
US$ 461.27 Mn
Base year value
2034 Forecast
US$ 1782.99 Mn
Projected by 2034
CAGR 2026-2034
16.2 %
Growth rate
Addressable Market
US$ 9,470.52 Mn
(2026-2034)
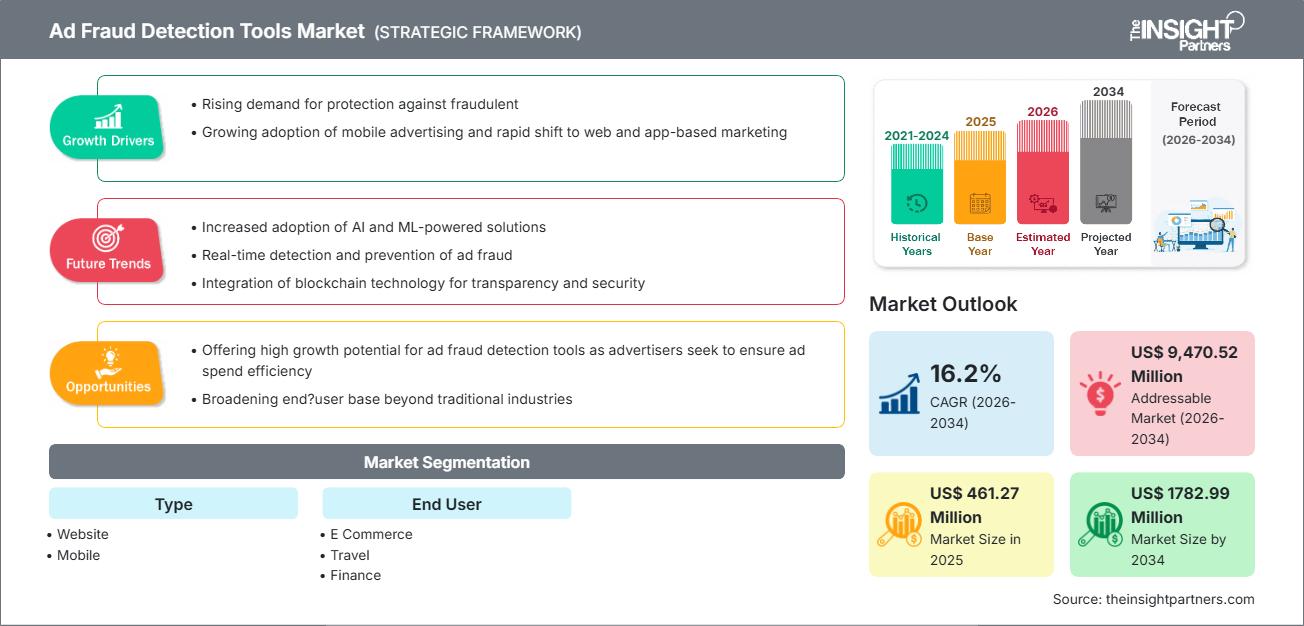
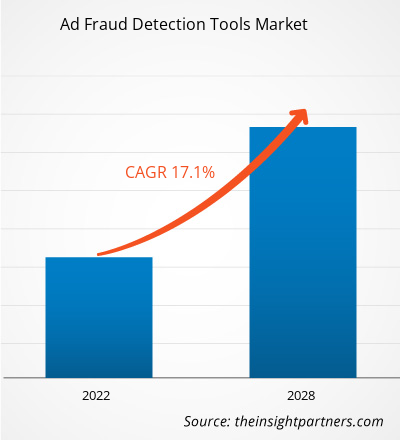
The ad fraud detection tools market size is expected to grow from US$ 461.27 million in 2025 to US$ 1782.99 million by 2034. The market is anticipated to register a CAGR of 16.2% during 2026–2034.
Ad Fraud Detection Tools Market Analysis
The ad fraud detection tools market forecast indicates strong growth, driven by the rising number of digital advertising campaigns, increasing awareness of ad fraud, and the need to protect advertising spend from fraudulent traffic and invalid clicks.
The expansion is facilitated by the growing use of mobile and web advertising, the proliferation of SMEs and start-ups using digital marketing, and rising ad spend across e‑commerce, finance, gaming, and other digital‑first sectors.
Additionally, the shift toward multi-device, multi‑channel advertising and increased programmatic ad buying makes ad fraud detection tools essential for maximizing ROI and preventing revenue leakage, positioning such tools as critical for advertisers of all sizes.
Ad Fraud Detection Tools Market Overview
Ad fraud detection tools are specialized solutions designed to identify, prevent, and mitigate fraudulent activities in online advertising, including click fraud, impression fraud, install fraud, and other invalid traffic (IVT) or non‑human traffic. These tools help advertisers ensure that their ad spend results in genuine user engagement, accurate metrics, and legitimate conversions.
By automating the detection of suspicious traffic, monitoring campaigns in real-time, and providing analytics and reporting, these tools enable advertisers to optimize ad performance, reduce financial losses, and protect brand reputation. As digital advertising continues to grow in complexity and scale, ad fraud detection tools act as a backbone for digital‑advertising security and integrity across sectors such as e-commerce, finance, gaming, travel, and more.
Market Assessment and Insights
- Global market for Ad Fraud Detection Tools was valued at US$ 461.27 Million in 2025
- Annual market size is expected to reach US$ 1,782.99 Million by 2034
- Total addressable market (TAM) during 2026-2034 is projected to reach approximately US$ 9,470.52 Million
- Market is anticipated to register a CAGR of 16.2% during the forecast period
- The United States represents a key market, supported by Rising demand for protection against fraudulent, Growing adoption of mobile advertising and rapid shift to web and app-based marketing, as well as evolving industry dynamics
- Market analysis covers North America, Europe, Asia-Pacific, South and Central America, Middle East and Africa, with growth evaluated across the forecast period
- Market opportunities such as Offering high growth potential for ad fraud detection tools as advertisers seek to ensure ad spend efficiency, Broadening end?user base beyond traditional industries are expected to influence market dynamics and addressable market
- Report profiles industry participants, including AppsFlyer Ltd., Adjust GmbH, Branch Metrics, Inc., FraudScore, Interceptd (App Samurai Inc.), Machine Advertising Limited, Perform(cb), LLC, Scalarr Inc., Singular Labs, Inc., TrafficGuard Pty Ltd, ADEX (Samoukale Enterprises Limited), while analyzing competitive strategies and innovation developments
-
Source: The Insight Partners' analysis based on proprietary research, government publications, company annual reports, investor presentations, industry databases, and expert interviews.
● REPORT CUSTOMIZATION
Tailor This Report To Align With Your Specific Business Requirements
This report can be customized to align precisely with your business objectives, scope, and target markets. Customization options include tailored segmentation, geography, competitive analysis, and strategic insights to support informed decision-making.
Customize This Report →WHAT YOU CAN ADJUST
- ● Segmentations
- ● Geography
- ● Competitive Analysis
- ● Language Preferences
Ad Fraud Detection Tools Market: Strategic Insights
-
Get Top Key Market Trends of this report.This FREE sample will include data analysis, ranging from market trends to estimates and forecasts.
Ad Fraud Detection Tools Market Drivers and Opportunities
Market Drivers:
- Rising demand for protection against fraudulent ad traffic as digital advertising and programmatic ad buying expand globally.
- Growing adoption of mobile advertising and rapid shift to web and app‑based marketing; mobile‑driven ad spend growth fuels the need for fraud detection.
- An increasing number of SMEs and start-ups are using digital marketing, leading to wider adoption of ad fraud detection tools to safeguard their ad budgets.
Market Opportunities:
- Expansion across emerging markets, regions where digital advertising is growing rapidly (e.g., Asia‑Pacific, other developing regions), offering high growth potential for ad fraud detection tools as advertisers seek to ensure ad spend efficiency.
- Broadening end‑user base beyond traditional industries: e‑commerce, gaming, finance, travel, as more sectors rely on digital advertising, demand for robust fraud detection increases.
- Increasing sophistication of fraudulent schemes (bots, click farms, install fraud, impression fraud), driving demand for advanced, real-time detection and analytics tools, possibly leveraging ML/AI and big‑data analytics to stay ahead of fraudsters.
Ad Fraud Detection Tools Market Segmentation Analysis
By Type:
- Website
- Mobile
By End User:
- E‑commerce
- Travel
- Finance
- Gaming
By Geography:
- North America
- Europe
- Asia-Pacific (APAC)
- South & Central America (SAM)
- Middle East & Africa (MEA)
Ad Fraud Detection Tools Market Report Scope
| Report Attribute | Details |
|---|---|
| Market size in 2025 | US$ 461.27 Million |
| Market Size by 2034 | US$ 1782.99 Million |
| Global CAGR (2026 - 2034) | 16.2% |
| Historical Data | 2021-2024 |
| Forecast period | 2026-2034 |
| Segments Covered |
By Type
|
| Regions and Countries Covered |
North America
|
| Market leaders and key company profiles |
|
Ad Fraud Detection Tools Market Players Density: Understanding Its Impact on Business Dynamics
The Ad Fraud Detection Tools Market is growing rapidly, driven by increasing end-user demand due to factors such as evolving consumer preferences, technological advancements, and greater awareness of the product's benefits. As demand rises, businesses are expanding their offerings, innovating to meet consumer needs, and capitalizing on emerging trends, which further fuels market growth.
Ad Fraud Detection Tools Market Geographic Share Analysis by Region
- North America: As of 2021, North America held a significant share of the global ad fraud detection tools market, benefiting from high digital advertising spend, advanced technology adoption, and strong demand for fraud prevention.
- Europe: The Presence of mature digital advertising markets and increasing regulatory scrutiny on ad transparency and fraud prevention contribute to steady demand for ad fraud detection tools.
- Asia-Pacific (APAC): The region represents a high-growth opportunity, driven by rapidly expanding digital advertising, a growing number of SMEs and e‑commerce platforms, and increasing awareness about ad fraud among advertisers.
- South & Central America (SAM) and Middle East & Africa (MEA): These are emerging markets with growing digital penetration and gradually increasing ad spend. As digital advertising expands in these regions, demand for ad fraud detection tools is expected to rise.
Overall, while North America remains the dominant region currently, the fastest growth is anticipated in Asia‑Pacific and other emerging regions owing to increasing digital ad adoption and growing concerns over ad fraud.
Ad Fraud Detection Tools Market Players Density & Competition
This competitive environment pushes vendors to differentiate through:
- Advanced fraud detection capabilities (mobile + web, cross‑device tracking, real‑time analytics)
- Scalability to serve SMEs as well as large enterprises
- Integration with ad platforms, analytics tools, and marketing stacks
- Flexibility to adapt to evolving fraud patterns and ad formats (video, mobile, programmatic, etc.)
Opportunity remains for emerging players, especially those focusing on tailored solutions for specific geographies (e.g, APAC, MEA) or industry verticals (gaming, finance, e‑commerce), where digital ad spend is rising rapid, ly and fraud risk is high.
The global ad fraud detection tools market features several prominent vendors, including:
- AppsFlyer Ltd.
- Adjust GmbH
- Branch Metrics, Inc.
- FraudScore
- Intercepted (App Samurai Inc.)
- Machine Advertising Limited
- Perform[cb], LLC
- Scalarr Inc.
- Singular Labs, Inc.
Other players analyzed during the course of research are:
- Integral Ad Science (IAS)
- DoubleVerify
- Moat
- HUMAN (formerly White Ops)
- Fraudlogix
- Pixalate
- Forensiq (by Impact)
- CHEQ AI Technologies Ltd. (CHEQ)
Opportunities and Strategic Moves
- Collaborate with digital ad platforms, mobile ad networks, and publishers to embed fraud detection as part of ad delivery and analytics, ensuring real‑time protection and better integration.
- Expand reach in high‑growth markets (Asia-Pacific, Latin America, Middle East) by offering cost-effective, scalable solutions tailored for SMEs and emerging advertisers.
- Invest in advanced analytics, machine learning/AI, and big‑data capabilities to detect sophisticated fraud (bots, click farms, install fraud, cross-device fraud) and adapt to evolving threats.
- Offer bundled solutions combining fraud detection, ad performance analytics, and campaign optimization to provide maximum value to advertisers, improving ROI while mitigating risk.
Ad Fraud Detection Tools Market, News, and Recent Developments
- The rapid shift toward mobile advertising and increasing use of programmatic ad buys have accentuated the demand for fraud‑detection tools, since mobile comprises a substantial portion of digital ad spend, and mobile-based ad fraud is among the most challenging.
- SMEs and start-ups are increasingly adopting ad fraud detection tools as more small-to-medium businesses shift their marketing efforts online, creating a broader and growing customer base beyond large enterprises.
- As advertising budgets continue to rise globally (across e‑commerce, gaming, finance, and more), the need for transparency, campaign integrity, and ROI protection drives the adoption of advanced detection services. This trend has been accelerating since the COVID‑19 pandemic triggered a surge in digital advertising and online activity.
Ad Fraud Detection Tools Market Report Coverage and Deliverables
The "Ad Fraud Detection Tools Market Forecast (2021-2034) – COVID‑19 Impact and Global Analysis" report by The Insight Partners provides:
- Market size and forecast (global, by region) for 2021–2034
- Market trends, drivers, constraints, and key growth opportunities
- Detailed segmentation by Type (Website, Mobile), End User (E‑commerce, Travel, Finance, Gaming, Others), and Geography
- Regional insights across North America, Europe, Asia-Pacific, South & Central America, and the Middle East & Africa, including major countries
- Competitive landscape covering major players and their profiles, strategies, and market positioning
Frequently Asked Questions
2. By End User: E‑commerce, Travel, Finance, Gaming, Others.
Fastest Growing Region(s): Asia‑Pacific and other emerging regions, driven by rapid digital ad growth, increasing SMEs, and rising awareness about ad fraud.
2. Rising awareness of ad fraud and the need to protect ad budgets across SMEs and large enterprises.
3. Increasing complexity and scale of online ad campaigns (multi‑channel, multi‑device, programmatic), which increases the risk of fraudulent traffic.

- Comprehensive Market Sizing and Forecast Analysis
- Detailed Segmentation Analysis
- In-Depth Market Dynamics Assessment
- Regional and Country-Level Insights
- Competitive Landscape and Company Benchmarking
- Strategic Business Intelligence
Recent Reports
Testimonials
The Insight Partners' SCADA System Market report is comprehensive, with valuable insights on current trends and future forecasts. The team was highly professional, responsive, and supportive throughout. We are very satisfied and highly recommend their services.
RAN KEDEM Partner, Reali Technologies LTDsI requested a report on a very specific software market and the team produced the report in a few days. The information was very relevant and well presented. I then requested some changes and additions to the report. The team was again very responsive and I got the final report in less than a week.
JEAN-HERVE JENN Chairman, Future AnalyticaWe worked with The Insight Partners for an important market study and forecast. They gave us clear insights into opportunities and risks, which helped shape our plans. Their research was easy to use and based on solid data. It helped us make smart, confident decisions. We highly recommend them.
PIYUSH NAGPAL Sr. Vice President, High Beam GlobalThe Insight Partners delivered insightful, well-structured market research with strong domain expertise. Their team was professional and responsive throughout. The user-friendly website made accessing industry reports seamless. We highly recommend them for reliable, high-quality research services
YUKIHIKO ADACHI CEO, Deep Blue, LLC.This is the first time I have purchased a market report from The Insight Partners.While I was unsure at first, I visited their web site and felt more comfortable to take the risk and purchase a market report.I am completely satisfied with the quality of the report and customer service. I had several questions and comments with the initial report, but after a couple of dialogs over email with their analyst I believe I have a report that I can use as input to our strategic planning process.Thank you so much for taking the extra time and making this a positive experience.I will definitely recommend your service to others and you will be my first call when we need further market data.
JOHN SUZUKI President and Chief Executive Officer, Board Director, BK TechnologiesI wish to appreciate your support and the professionalism you displayed in the course of attending to my request for information regarding to infectious disease IVD market in Nigeria. I appreciate your patience, your guidance, and the fact that you were willing to offer a discount, which eventually made it possible for us to close a deal. I look forward to engaging The Insight Partners in the future, all thanks to the impression you have created in me as a result of this first encounter.
DR CHIJIOKE ONYIA MANAGING DIRECTOR, PineCrest Healthcare Ltd.Reason to Buy
- Informed Decision-Making
- Understanding Market Dynamics
- Competitive Analysis
- Identifying Emerging Markets
- Customer Insights
- Market Forecasts
- Risk Mitigation
- Boosting Operational Efficiency
- Strategic Planning
- Investment Justification
- Tracking Industry Innovations
- Aligning with Regulatory Trends


