
Strategie di mercato dei materiali per la bonifica dell’inquinamento petrolifero, principali attori, opportunità di crescita, analisi e previsioni entro il 2030
Dimensioni e previsioni del mercato dei materiali per la bonifica dell'inquinamento da petrolio (2020-2030), quota globale e regionale, trend e opportunità di crescita. Copertura del rapporto di analisi: per tipo [bonifica fisica (barriere, skimmer e materiali adsorbenti), bonifica chimica (disperdenti e solidificanti), bonifica termica e biobonifica]
- Stato : Edito
- Codice del report : TIPRE00038943
- Categoria : Prodotti chimici e materiali
- Numero di pagine : 195
- Formati di report disponibili :


- Data dell'ultimo aggiornamento : April 07, 2025

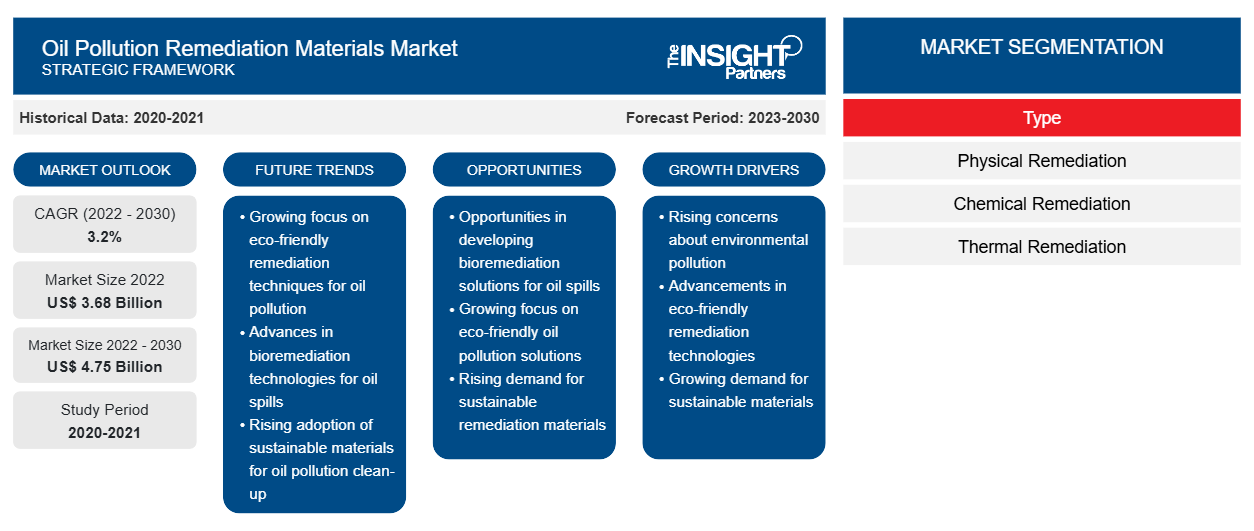
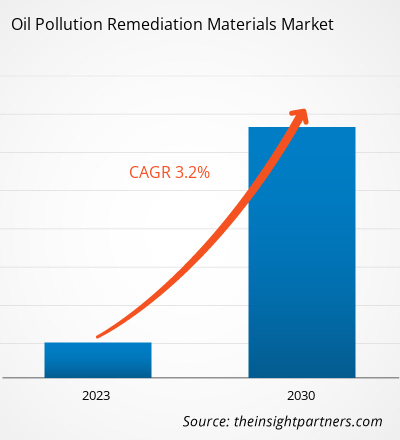
[Rapporto di ricerca] L'analisi del mercato dei materiali per la bonifica dell'inquinamento da petrolio è stata valutata a 3.684,36 milioni di dollari nel 2022 e si prevede che raggiungerà i 4.749,56 milioni di dollari entro il 2030; si stima che registrerà un CAGR del 3,2% dal 2022 al 2030.
Analisi di mercato
I materiali di bonifica dell'inquinamento da petrolio vengono utilizzati per ridurre l'elevato rischio di contaminazione dei corpi idrici dovuto a varie attività di esplorazione petrolifera, trasporto e operazioni industriali che si svolgono in tutto il mondo. Le tecniche di bonifica sono principalmente classificate in bonifica fisica, bonifica chimica, bonifica termica e biobonifica. Sono considerate estremamente importanti per affrontare i problemi delle fuoriuscite di petrolio in mare. La bonifica fisica consiste in materiali quali barriere, skimmer e materiali assorbenti. I materiali di bonifica chimica includono disperdenti e solidificanti.
I principali fattori che guidano la crescita del mercato dei materiali per la bonifica dell'inquinamento da petrolio sono le crescenti attività di esplorazione e trasporto di petrolio offshore e le normative governative relative alla preparazione e alle risposte alle fuoriuscite di petrolio. Negli ultimi anni, i governi di vari paesi hanno elaborato normative per la bonifica delle fuoriuscite di petrolio per garantire una risposta rapida ed efficace alle emergenze ambientali. Tali normative in genere delineano procedure, tecnologie e standard che le aziende devono seguire per contenere, controllare e bonificare le fuoriuscite di petrolio. Le normative spesso stabiliscono il tipo di materiali di bonifica che devono essere impiegati per ridurre al minimo l'impatto ambientale e garantire una bonifica efficace. La crescente necessità di una bonifica efficace delle fuoriuscite di petrolio spinge la domanda di materiali di bonifica.
Con l'intensificarsi delle preoccupazioni e delle normative ambientali, si sta ponendo sempre più l'accento sull'uso di materiali avanzati ed ecocompatibili per la bonifica. Alcuni assorbenti, disperdenti e barriere possono essere obbligatori per soddisfare gli standard di sicurezza ed efficacia, promuovendo l'uso di materiali ecocompatibili ed efficienti negli sforzi di risposta alle fuoriuscite di petrolio. I governi e l'industria petrolifera hanno piani di preparazione per condurre una regolare risposta alle fuoriuscite di petrolio. Gli obblighi governativi di affrontare tempestivamente le fuoriuscite di petrolio e la riduzione al minimo dell'impatto ecologico hanno spinto la domanda di assorbenti, disperdenti e altri materiali di bonifica. Nel 2023, l'Agenzia per la protezione ambientale degli Stati Uniti ha rafforzato gli standard per migliorare le risposte alle fuoriuscite di petrolio nelle acque statunitensi e nelle coste adiacenti nell'ambito del National Contingency Plan (NCP) del governo federale. Gli standard includono lo sviluppo di prodotti efficaci per la bonifica delle fuoriuscite di petrolio, come agenti chimici e biologici, e la fornitura di trasparenza e informazioni relative all'uso di questi prodotti.
L'aumento delle attività di esplorazione e perforazione offshore, il trasporto di petrolio tramite oleodotti o petroliere e gli errori umani durante l'estrazione e lo stoccaggio del petrolio aumentano le possibilità di incidenti di fuoriuscita di petrolio. Secondo l'Agenzia internazionale per l'energia, la domanda globale di petrolio è rimbalzata nel 2021 e si prevede che l'Asia rappresenterà il 77% della domanda di petrolio entro il 2025. Si prevede che il fabbisogno di importazione di petrolio dell'Asia supererà i 31 milioni di barili al giorno entro il 2025. I governi di vari paesi dell'Asia Pacifica hanno avviato progetti petroliferi per soddisfare la crescente domanda di petrolio nella regione. Nel 2023, PETRONAS e i suoi Petroleum Arrangement Contractors hanno segnalato 19 scoperte di esplorazione di petrolio e gas e due successi di valutazione dell'esplorazione, contribuendo a oltre 1 miliardo di barili di petrolio equivalente di nuove risorse per la Malesia. Questo è il risultato di un programma di esplorazione intensificato perseguito negli ultimi anni, che ha visto la perforazione di 25 pozzi. Dal 2015, è il numero più alto di pozzi esplorativi perforati in un singolo anno.
Fattori di crescita e sfide
Secondo un rapporto pubblicato dalla US Energy Information Administration a gennaio 2024, la produzione di petrolio greggio è aumentata dalla pandemia di COVID-19 a partire dal 9 gennaio 2024, invertendo un calo durato due anni. La produzione di petrolio greggio degli Stati Uniti è aumentata da 11,27 milioni di barili al giorno nel 2021 a 13,21 milioni di barili al giorno nel 2023 e si prevede che raggiungerà i 13,44 milioni di barili al giorno entro il 2024. Secondo il Canada Energy Regulator, la maggior parte del petrolio greggio prodotto in Canada viene trasportato tramite oleodotti dalle province occidentali alle raffinerie negli Stati Uniti, in Ontario e nel Quebec. Secondo il rapporto pubblicato da Bruegel AISBL nel 2023, la Russia è stata tra i primi cinque maggiori produttori e consumatori di energia al mondo nel 2021. Nello stesso anno, ha prodotto 595,2 milioni di tonnellate metriche di petrolio greggio, di cui 286,6 milioni di tonnellate metriche sono state esportate. Pertanto, le crescenti attività di esplorazione e trasporto di petrolio offshore stimolano il mercato dei materiali per la bonifica dell'inquinamento da petrolio.
Personalizza questo report in base alle tue esigenze
Riceverai la personalizzazione gratuita di qualsiasi report, comprese parti di questo report, o analisi a livello nazionale, pacchetto dati Excel, oltre a usufruire di grandi offerte e sconti per start-up e università
Mercato dei materiali per la bonifica dell'inquinamento da petrolio: approfondimenti strategici
-
Scopri le principali tendenze di mercato in questo rapporto.Questo campione GRATUITO includerà analisi di dati che spaziano dalle tendenze di mercato alle stime e alle previsioni.
Approfondimenti regionali sul mercato dei materiali per la bonifica dell'inquinamento da petrolio
Le tendenze regionali e i fattori che influenzano il mercato dei materiali per la bonifica dell'inquinamento da petrolio durante il periodo di previsione sono stati ampiamente spiegati dagli analisti di Insight Partners. Questa sezione discute anche i segmenti e la geografia del mercato dei materiali per la bonifica dell'inquinamento da petrolio in Nord America, Europa, Asia Pacifico, Medio Oriente e Africa e America centrale e meridionale.
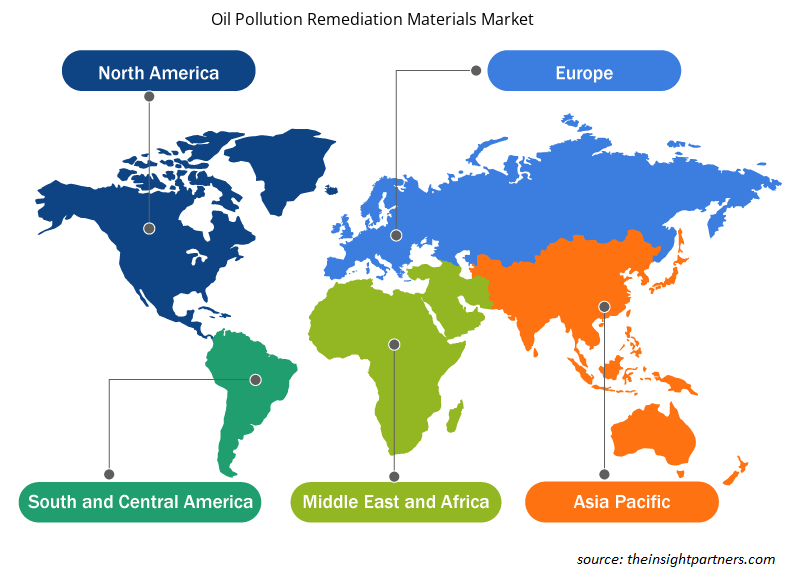
- Ottieni i dati specifici regionali per il mercato dei materiali per la bonifica dell'inquinamento da petrolio
Ambito del rapporto di mercato sui materiali per la bonifica dell'inquinamento da petrolio
| Attributo del report | Dettagli |
|---|---|
| Dimensioni del mercato nel 2022 | 3,68 miliardi di dollari USA |
| Dimensioni del mercato entro il 2030 | 4,75 miliardi di dollari USA |
| CAGR globale (2022-2030) | 3,2% |
| Dati storici | 2020-2021 |
| Periodo di previsione | 2023-2030 |
| Segmenti coperti |
Per tipo
|
| Regioni e Paesi coperti |
America del Nord
|
| Leader di mercato e profili aziendali chiave |
|
Densità dei player del mercato dei materiali per la bonifica dell'inquinamento da petrolio: comprendere il suo impatto sulle dinamiche aziendali
Il mercato dei materiali per la bonifica dell'inquinamento da petrolio sta crescendo rapidamente, spinto dalla crescente domanda degli utenti finali dovuta a fattori quali l'evoluzione delle preferenze dei consumatori, i progressi tecnologici e una maggiore consapevolezza dei benefici del prodotto. Con l'aumento della domanda, le aziende stanno ampliando le loro offerte, innovando per soddisfare le esigenze dei consumatori e capitalizzando sulle tendenze emergenti, il che alimenta ulteriormente la crescita del mercato.
La densità degli operatori di mercato si riferisce alla distribuzione di aziende o società che operano in un particolare mercato o settore. Indica quanti concorrenti (operatori di mercato) sono presenti in un dato spazio di mercato in relazione alle sue dimensioni o al valore di mercato totale.
Le principali aziende che operano nel mercato dei materiali per la bonifica dell'inquinamento da petrolio sono:
- Sarva Bio Remed LLC
- Tecniche dell'olio Ltd
Disclaimer : le aziende elencate sopra non sono classificate secondo un ordine particolare.
- Ottieni una panoramica dei principali attori del mercato dei materiali per la bonifica dell'inquinamento da petrolio
Panorama competitivo e aziende chiave
Sarva Bio Remed LLC, Oil Technics Ltd, Ansell Ltd, Oil-Dri Corp of America, Verde Environmental Group Ltd, Ecolab Inc, Cosco Shipping Heavy Industry Co Ltd, Regenesis, TOLSA SA e CL Solutions LLC sono tra i principali attori profilati nel rapporto di mercato sui materiali per la bonifica dell'inquinamento da petrolio. Inoltre, diversi altri attori sono stati studiati e analizzati durante lo studio per ottenere una visione olistica del mercato e del suo ecosistema. Il rapporto di mercato sui materiali per la bonifica dell'inquinamento da petrolio include anche il posizionamento e la concentrazione dell'azienda per valutare le prestazioni dei concorrenti/attori nel mercato.
Sviluppi del settore e opportunità future
Di seguito sono elencate le iniziative intraprese dai principali attori che operano nel mercato dei materiali per la bonifica dell'inquinamento da petrolio:
Nel novembre 2022, Ansell Ltd ha investito circa 80 milioni di dollari nello stabilimento produttivo greenfield in India.

- Analisi completa delle dimensioni e delle previsioni di mercato
- Analisi dettagliata della segmentazione
- Valutazione approfondita delle dinamiche di mercato
- Approfondimenti a livello regionale e nazionale
- Analisi del panorama competitivo e benchmarking aziendale
- Business intelligence strategica
Testimonianze
Il report di mercato sui sistemi SCADA di Insight Partners è completo, con preziosi spunti sulle tendenze attuali e sulle previsioni future. Il team si è dimostrato altamente professionale, reattivo e disponibile in ogni fase del progetto. Siamo molto soddisfatti e consigliamo vivamente i loro servizi.
RAN KEDEM Partner, Reali Technologies LTDsHo richiesto un report su un mercato software molto specifico e il team lo ha prodotto in pochi giorni. Le informazioni erano molto pertinenti e ben presentate. Ho quindi richiesto alcune modifiche e aggiunte al report. Il team è stato ancora una volta molto reattivo e ho ricevuto il report finale in meno di una settimana.
JEAN-HERVE JENN Presidente, Future AnalyticaAbbiamo collaborato con The Insight Partners per un importante studio di mercato e una previsione. Ci hanno fornito informazioni chiare su opportunità e rischi, che ci hanno aiutato a definire i nostri piani. La loro ricerca è stata facile da usare e basata su dati solidi. Ci ha aiutato a prendere decisioni intelligenti e consapevoli. Li consigliamo vivamente.
PIYUSH NAGPAL Vicepresidente senior, Abbaglianti globaliInsight Partners ha fornito ricerche di mercato approfondite e ben strutturate, con una solida competenza nel settore. Il loro team si è dimostrato professionale e reattivo in ogni fase. Il sito web intuitivo ha reso l'accesso ai report di settore semplice e immediato. Li consigliamo vivamente per servizi di ricerca affidabili e di alta qualità.
YUKIHIKO ADACHI Amministratore delegato, Deep Blue, LLC.Questa è la prima volta che acquisto un report di mercato da The Insight Partners. Sebbene inizialmente fossi indeciso, ho visitato il loro sito web e mi sono sentito più a mio agio nell'acquistare un report di mercato. Sono completamente soddisfatto della qualità del report e del servizio clienti. Avevo diverse domande e commenti sul report iniziale, ma dopo un paio di conversazioni via email con il loro analista credo di avere un report che posso utilizzare come input per il nostro processo di pianificazione strategica. Grazie mille per aver dedicato del tempo extra e aver reso questa esperienza positiva. Consiglierò sicuramente il vostro servizio ad altri e sarete la mia prima persona a cui rivolgermi quando avremo bisogno di ulteriori dati di mercato.
GIOVANNI SUZUKI Presidente e Amministratore Delegato, Consigliere di Amministrazione, Tecnologie BKDesidero esprimere la mia gratitudine per il supporto e la professionalità dimostrati nel rispondere alla mia richiesta di informazioni sul mercato dei dispositivi medici in vitro per malattie infettive in Nigeria. Apprezzo la vostra pazienza, la vostra guida e la vostra disponibilità a offrirmi uno sconto, che alla fine ci ha permesso di concludere l'affare. Non vedo l'ora di collaborare con The Insight Partners in futuro, grazie anche all'impressione che mi avete lasciato dopo questo primo incontro.
Dott. Chijioke AMMINISTRATORE DELEGATO DI ONYIA, PineCrest Healthcare Ltd.Motivo dell'acquisto
- Processo decisionale informato
- Comprensione delle dinamiche di mercato
- Analisi competitiva
- Analisi dei clienti
- Previsioni di mercato
- Mitigazione del rischio
- Pianificazione strategica
- Giustificazione degli investimenti
- Identificazione dei mercati emergenti
- Miglioramento delle strategie di marketing
- Aumento dell'efficienza operativa
- Allineamento alle tendenze normative


