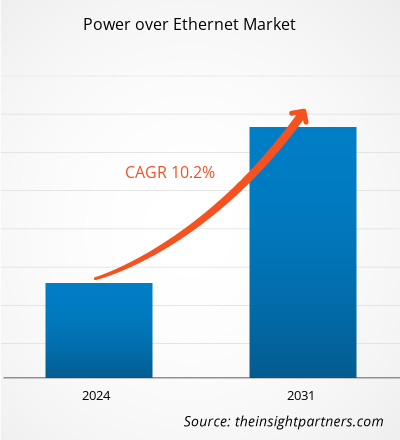
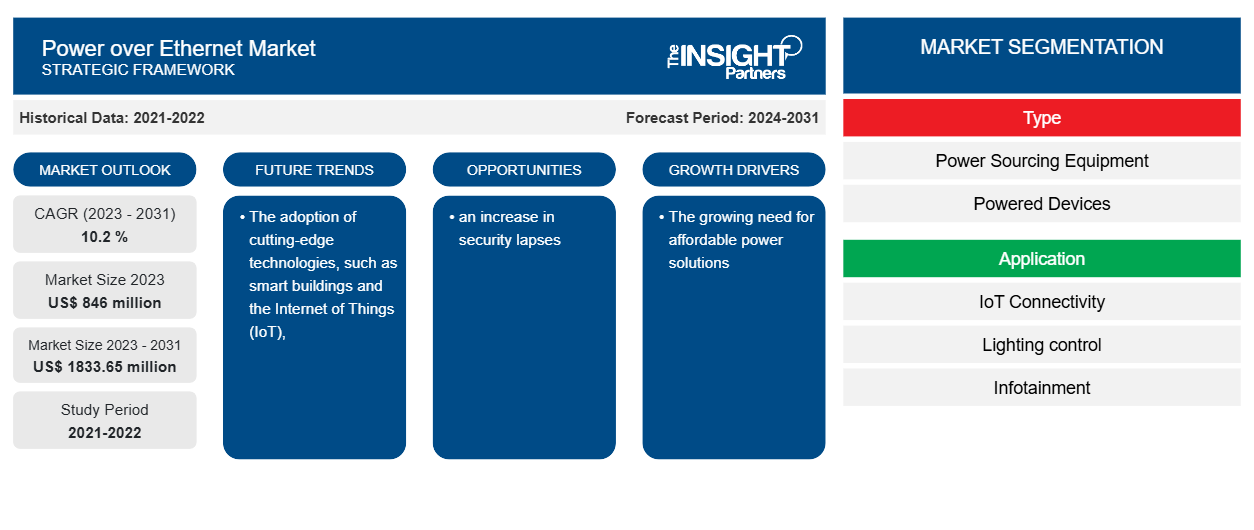
Si prevede che la dimensione del mercato Power over Ethernet raggiungerà 1833,65 milioni di dollari entro il 2031, rispetto agli 846 milioni di dollari del 2023. Si prevede che il mercato registrerà un CAGR del 10,2% nel 2023-2031.È probabile che l'adozione di tecnologie all'avanguardia, come gli edifici intelligenti e l'Internet delle cose (IoT), continui a svolgere un ruolo chiave nelle tendenze del mercato Ethernet.
Analisi di mercato Power over Ethernet
A causa di molti fattori, come la crescente tendenza a trasmettere energia e dati su lunghe distanze tramite switch e iniettori POE, nonché il crescente utilizzo delle tecnologie Internet Protocol ('IP'), si prevede che il mercato si svilupperà in modo significativo nel periodo di previsione. Una spinta al mercato è probabilmente in serbo per i cavi in fibra ottica man mano che diventano più ampiamente utilizzati e adottati per la comunicazione. Un numero crescente di dispositivi che possono essere alimentati e controllati da remoto è necessario come risultato dello sviluppo di tecnologie di smart building e dell'Internet of Things. Per queste applicazioni, la tecnologia Power over Ethernet (POE) è l'opzione migliore poiché consente la gestione e il controllo centralizzati dell'alimentazione. Le applicazioni di smart building e Internet of Things (IoT) sono rese possibili dall'uso di illuminazione POE e LED. Poiché l'illuminazione LED POE è ancora agli inizi, non è molto presente nelle strutture commerciali. Tuttavia, a causa dei suoi vantaggi rispetto ad altre tecnologie di illuminazione in termini di costi, si prevede che l'illuminazione POE diventerà più ampiamente utilizzata nel prossimo futuro, il che aiuterà l'espansione del mercato.
Panoramica del mercato Power over Ethernet
Le apparecchiature di rete utilizzano una tecnica chiamata Power over Ethernet, o PoE, che consente il trasferimento di dati e alimentazione tramite un collegamento Ethernet. Offre facilità e versatilità in termini di posizionamento del dispositivo ed elimina la necessità di cavi di alimentazione separati. Telefoni IP, webcam e punti di accesso wireless sono esempi di dispositivi alimentati (PD) che possono ricevere alimentazione da uno switch PoE. La tecnologia Power over Ethernet è emersa come una tecnologia di rete cruciale e sta diventando sempre più popolare nel settore a seguito del crescente utilizzo di dispositivi IoT.
Personalizza questo report in base alle tue esigenze
Riceverai la personalizzazione gratuita di qualsiasi report, comprese parti di questo report, o analisi a livello nazionale, pacchetto dati Excel, oltre a usufruire di grandi offerte e sconti per start-up e università
-
Scopri le principali tendenze di mercato in questo rapporto.Questo campione GRATUITO includerà analisi di dati che spaziano dalle tendenze di mercato alle stime e alle previsioni.
Driver e opportunità del mercato Power over Ethernet
Crescente necessità di soluzioni energetiche accessibili
Poiché Power over Ethernet (PoE) è così conveniente, sia i consumatori che le aziende lo trovano sempre più interessante. Ci sono enormi risparmi sui costi perché non c'è più bisogno di costosi convertitori di potenza quando l'alimentazione viene fornita direttamente tramite il cavo Ethernet. Inoltre, PoE sta diventando sempre più popolare nelle applicazioni industriali grazie alla sua capacità di fornire energia sicura e affidabile semplificando al contempo il cablaggio.PoE) is so affordable, both consumers and enterprises are finding it more and more appealing. There are huge cost savings because there is no longer a need for pricey power converters when power is supplied straight through the Ethernet wire. Furthermore, PoE is growing in popularity in industrial applications due to its capacity to deliver safe and dependable power while simplifying wiring.
Aumento delle violazioni della sicurezza
Molte aziende hanno iniziato a installare telecamere IP per monitorare il numero di persone che entrano ed escono regolarmente dai loro locali a causa dell'aumento delle violazioni della sicurezza. Inoltre, le soluzioni POE sono l'opzione migliore per le aziende che distribuiscono diverse telecamere di sicurezza poiché richiedono un cavo per fornire sia la connettività di rete che l'elettricità. Pertanto, si prevede che l'aumento delle falle nella sicurezza presenterà nuove opportunità per gli operatori del mercato Power over Ethernet durante il periodo di previsione.
Analisi della segmentazione del rapporto di mercato Power over Ethernet
I segmenti chiave che hanno contribuito alla derivazione dell'analisi del mercato Power over Ethernet sono tipologia e applicazione.
- In base al tipo, il mercato Power over the Ethernet è segmentato in Power Sourcing Equipment (PSE) e Powered Devices (PD). Il segmento single core ha detenuto una quota di mercato maggiore nel 2023.
- In base all'applicazione, il mercato è segmentato in connettività IoT, controllo dell'illuminazione, infotainment, controllo degli accessi e sicurezza, applicazioni di comunicazione e altro.
Analisi della quota di mercato di Power over Ethernet per area geografica
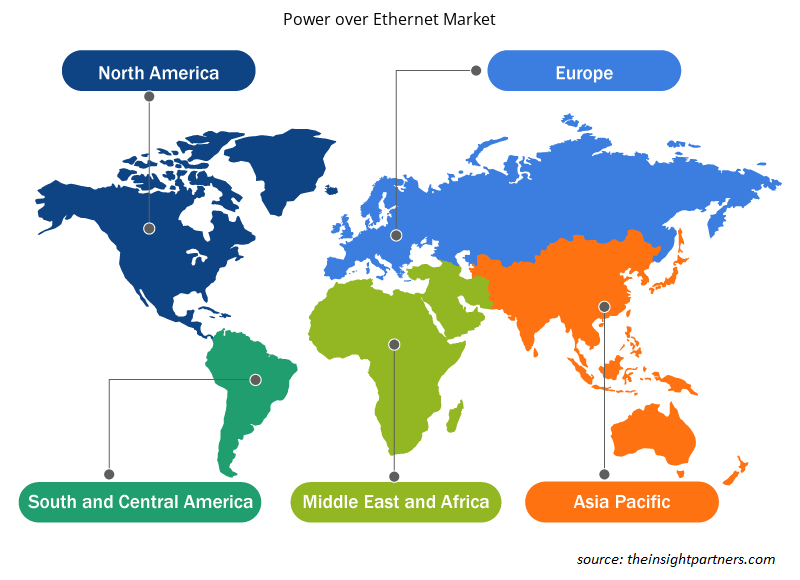
L'ambito geografico del rapporto di mercato Power over Ethernet è suddiviso principalmente in cinque regioni: Nord America, Asia Pacifico, Europa, Medio Oriente e Africa e Sud America/Sud e Centro America. In termini di fatturato, l'APAC ha rappresentato la quota di mercato Power over Ethernet più grande. Si prevede che il mercato delle soluzioni Power over Ethernet nell'APAC si svilupperà in modo significativo nel prossimo futuro. La crescente domanda di Internet ad alta velocità sta guidando l'ascesa di questo mercato nell'area. Inoltre, poiché la sicurezza della rete sta diventando sempre più importante, il mercato cinese è in continua evoluzione.
Approfondimenti regionali sul mercato Power over Ethernet
Le tendenze regionali e i fattori che influenzano il mercato Power over Ethernet durante il periodo di previsione sono stati ampiamente spiegati dagli analisti di Insight Partners. Questa sezione discute anche i segmenti e la geografia del mercato Power over Ethernet in Nord America, Europa, Asia Pacifico, Medio Oriente e Africa e America centrale e meridionale.

- Ottieni i dati specifici regionali per il mercato Power over Ethernet
Ambito del rapporto di mercato Power over Ethernet
| Attributo del report | Dettagli |
|---|---|
| Dimensioni del mercato nel 2023 | 846 milioni di dollari USA |
| Dimensioni del mercato entro il 2031 | 1833,65 milioni di dollari USA |
| CAGR globale (2023-2031) | 10,2% |
| Dati storici | 2021-2022 |
| Periodo di previsione | 2024-2031 |
| Segmenti coperti |
Per tipo
|
| Regioni e Paesi coperti |
America del Nord
|
| Leader di mercato e profili aziendali chiave |
|
Densità degli attori del mercato: comprendere il suo impatto sulle dinamiche aziendali
Il mercato Power over Ethernet sta crescendo rapidamente, spinto dalla crescente domanda degli utenti finali dovuta a fattori quali l'evoluzione delle preferenze dei consumatori, i progressi tecnologici e una maggiore consapevolezza dei vantaggi del prodotto. Con l'aumento della domanda, le aziende stanno ampliando le loro offerte, innovando per soddisfare le esigenze dei consumatori e capitalizzando sulle tendenze emergenti, il che alimenta ulteriormente la crescita del mercato.
La densità degli operatori di mercato si riferisce alla distribuzione di aziende o società che operano in un particolare mercato o settore. Indica quanti concorrenti (operatori di mercato) sono presenti in un dato spazio di mercato in relazione alle sue dimensioni o al valore di mercato totale.
Le principali aziende che operano nel mercato Power over Ethernet sono:
- STMicroelettronica
- Sistemi Cisco Inc.
- Dell Technologies Inc
- Dispositivi analogici Inc.
- Texas Instruments Inc
- Laboratori di silicio, Inc.
Disclaimer : le aziende elencate sopra non sono classificate secondo un ordine particolare.

- Ottieni una panoramica dei principali attori del mercato Power over Ethernet
Notizie di mercato e sviluppi recenti di Power over Ethernet
Il potere sul mercato ethernet viene valutato raccogliendo dati qualitativi e quantitativi post-ricerca primaria e secondaria, che includono importanti pubblicazioni aziendali, dati di associazioni e database. Di seguito è riportato un elenco di sviluppi nel mercato dei disturbi del linguaggio e della parola e delle strategie:
- Ad aprile 2023, Broadcom Inc. ha annunciato il rilascio di Jericho3-AI, che offre il più potente fabric di rete di intelligenza artificiale del settore. Un cluster da 32.000 GPU può accedere a Ethernet ad alte prestazioni grazie al nuovo Jericho3-AI connesso da Broadcom.
(Fonte: Broadcom, Comunicato stampa)
- A novembre 2022, Analog Devices ha presentato le prime soluzioni Single-pair Power over Ethernet al mondo. Questi prodotti sono pensati per aiutare i clienti a integrare sistemi di automazione di edifici e fabbriche più intelligenti. Come parte del suo portafoglio, l'azienda ha anche introdotto soluzioni Power Device (PD) e Power Sourcing Equipment (PSE).
(Fonte: Analog Devices, Comunicato stampa)
Copertura e risultati del rapporto di mercato Power over Ethernet
Il rapporto "Dimensioni e previsioni del mercato Power over Ethernet (2021-2031)" fornisce un'analisi dettagliata del mercato che copre le seguenti aree:
- Dimensioni e previsioni del mercato a livello globale, regionale e nazionale per tutti i segmenti di mercato chiave coperti dall'ambito
- Dinamiche di mercato come fattori trainanti, vincoli e opportunità chiave
- Principali tendenze future
- Analisi dettagliata delle cinque forze PEST/Porter e SWOT
- Analisi di mercato globale e regionale che copre le principali tendenze di mercato, i principali attori, le normative e gli sviluppi recenti del mercato
- Analisi del panorama industriale e della concorrenza che copre la concentrazione del mercato, l'analisi della mappa di calore, i principali attori e gli sviluppi recenti
- Profili aziendali dettagliati
- Analisi storica (2 anni), anno base, previsione (7 anni) con CAGR
- Analisi PEST e SWOT
- Valore/volume delle dimensioni del mercato - Globale, Regionale, Nazionale
- Industria e panorama competitivo
- Set di dati Excel
Report recenti
Rapporti correlati
Testimonianze
Motivo dell'acquisto
- Processo decisionale informato
- Comprensione delle dinamiche di mercato
- Analisi competitiva
- Analisi dei clienti
- Previsioni di mercato
- Mitigazione del rischio
- Pianificazione strategica
- Giustificazione degli investimenti
- Identificazione dei mercati emergenti
- Miglioramento delle strategie di marketing
- Aumento dell'efficienza operativa
- Allineamento alle tendenze normative


 Ottieni un campione gratuito per - Mercato Power over Ethernet