Crescita, dimensione, quota, tendenze, analisi dei principali attori e previsioni del mercato del software di visualizzazione e rendering 3D fino al 2030
Dimensioni e previsioni del mercato del software di visualizzazione e rendering 3D (2020-2030), quota globale e regionale, tendenze e opportunità di crescita. Copertura del rapporto di analisi: per applicazione (simulazione di formazione, marketing e pubblicità, videogiochi, visualizzazione di prodotti e visualizzazione architettonica), distribuzione (on-premise e cloud) e utente finale (media e intrattenimento, architettura e costruzione, progettazione e ingegneria, assistenza sanitaria e altri).
- Stato : Edito
- Codice del report : TIPTE100000188
- Categoria : Tecnologia, media e telecomunicazioni
- Numero di pagine : 191
- Formati di report disponibili :


- Data dell'ultimo aggiornamento : June 12, 2024


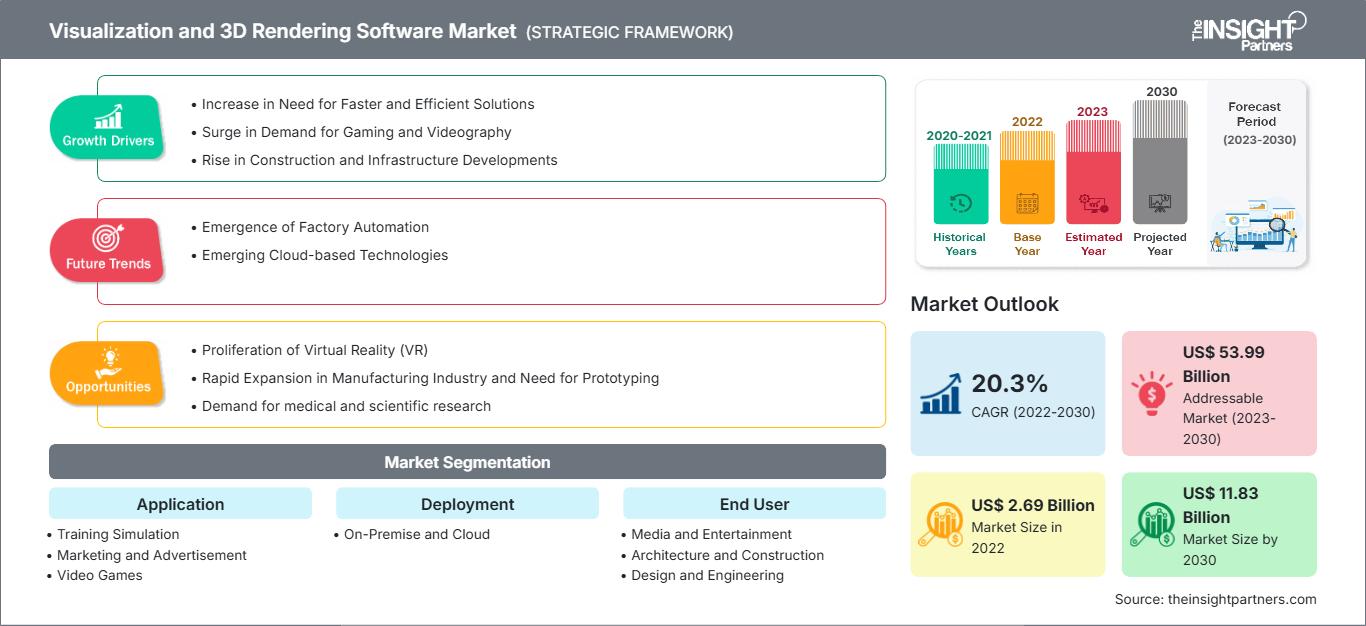
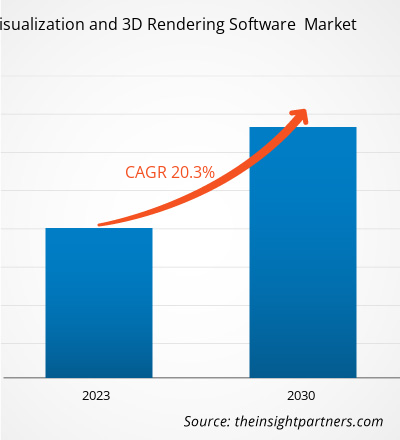
[Rapporto di ricerca] Si prevede che il mercato dei software di visualizzazione e rendering 3D crescerà da 2,69 miliardi di dollari nel 2022 a 11,83 miliardi di dollari entro il 2030. Si stima che il mercato dei software di visualizzazione e rendering 3D registrerà un CAGR del 20,3% dal 2022 al 2030.
Prospettiva degli analisti di mercato dei software di visualizzazione e rendering 3D:
Il mercato dei software di visualizzazione e rendering 3D comprende un'ampia gamma di settori e applicazioni in cui rappresentazioni visive realistiche sono essenziali. Questo mercato ha registrato una crescita costante grazie ai progressi tecnologici, alla crescente domanda di esperienze immersive e all'espansione dei settori che si basano sulla comunicazione visiva. Architetti, interior designer e urbanisti utilizzano software di rendering 3D per creare visualizzazioni realistiche di edifici, interni e spazi urbani. Questo aiuta i clienti a comprendere i concetti di progettazione e a prendere decisioni informate. Ad esempio, software come 3ds Max di Autodesk e SketchUp di Trimble sono ampiamente utilizzati nella visualizzazione architettonica. I settori del cinema, dell'animazione e dei videogiochi si affidano ampiamente ai software di rendering 3D per creare immagini straordinarie. Tra gli esempi figurano RenderMan di Pixar per il rendering cinematografico e Unreal Engine di Epic Games per la grafica di gioco in tempo reale. Inoltre, gli agenti immobiliari utilizzano software di rendering 3D per creare tour virtuali delle proprietà, consentendo ai potenziali acquirenti di esplorare le proprietà da remoto. Matterport è una piattaforma popolare per la creazione di tour immobiliari in 3D.
L'aumento della domanda di animazione 3D, i progressi tecnologici in AR e VR, l'aumento della domanda di contenuti 3D e la crescita dei dispositivi di visualizzazione 3D stanno trainando il mercato globale dei software di visualizzazione e rendering 3D. Inoltre, la crescente adozione e integrazione di tecnologie come l'intelligenza artificiale e l'apprendimento automatico nei software di visualizzazione e rendering 3D per aumentare la precisione dei contenuti 3D sta integrando la crescita del mercato. Si prevede che tutti questi fattori offriranno ampie opportunità di crescita per gli operatori di mercato nel periodo di previsione.
Panoramica del mercato dei software di visualizzazione e rendering 3D:
Gli strumenti software di visualizzazione e rendering 3D aiutano gli utenti a progettare modelli tridimensionali di base di oggetti. La tecnologia di rendering 3D supporta la progettazione di prodotti, il marketing in tempo reale, la formazione e molte altre funzionalità. Aziende e singoli utenti in tutto il mondo utilizzano strumenti software di visualizzazione e rendering 3D per migliorare le operazioni, aumentare la produttività e ottimizzare l'utilizzo delle risorse identificando aree problematiche e aspetti che necessitano di miglioramento. Questi strumenti sono ampiamente utilizzati in settori incentrati sul territorio come ingegneria e costruzioni, produzione, trasporti e logistica, e in altri settori come media e intrattenimento, sanità e istruzione.
Personalizza questo rapporto in base alle tue esigenze
Potrai personalizzare gratuitamente qualsiasi rapporto, comprese parti di questo rapporto, o analisi a livello di paese, pacchetto dati Excel, oltre a usufruire di grandi offerte e sconti per start-up e università
Mercato del software di visualizzazione e rendering 3D: Approfondimenti strategici
-
Ottieni le principali tendenze chiave del mercato di questo rapporto.Questo campione GRATUITO includerà l'analisi dei dati, che vanno dalle tendenze di mercato alle stime e alle previsioni.
Driver del mercato dei software di visualizzazione e rendering 3D:
L'aumento della necessità di soluzioni più rapide ed efficienti alimenta la crescita del mercato dei software di visualizzazione e rendering 3D
Il metodo convenzionale di progettazione di modelli 3D è dispendioso in termini di tempo e denaro. Pertanto, la visualizzazione e la simulazione sono diventate i fattori chiave per le aziende che desiderano lanciare un nuovo prodotto.
Gli strumenti di rendering 3D stanno riscontrando un'ampia adozione in diversi settori verticali. Consentono agli utenti di creare immagini rapide e realistiche, progettare prototipi e fornire una visualizzazione completa dello spazio e una comprensione approfondita prima di costruire qualsiasi cosa. Aiutano inoltre le aziende a ottimizzare lo spazio e le risorse disponibili. Inoltre, aiutano le aziende a evitare proattivamente gli errori e a garantire una progettazione migliore prima di creare prodotti reali. I software di rendering 3D rappresentano efficaci strumenti di marketing per le aziende, poiché consentono loro di visualizzare meglio lo spazio disponibile per le presentazioni ai clienti e altre attività.
I modelli 3D aiutano a creare siti o strutture virtuali più rapidamente rispetto ai modelli 2D o di altro tipo ed eliminano molti errori, risparmiando tempo. Ingegneri e architetti possono dedicare meno tempo alla progettazione dei loro progetti e avere più tempo per completare altre attività di visualizzazione e progettazione del prodotto. Inoltre, i professionisti possono identificare eventuali problemi in anticipo, evitando di dover riprogrammare i programmi o aumentare i budget.
Attualmente, sul mercato sono disponibili numerosi software di visualizzazione 3D, progettati specificamente in base alle esigenze di vari settori verticali e domini. Si integrano facilmente nel flusso di lavoro esistente delle aziende e offrono una visualizzazione altamente realistica con interazione in tempo reale e capacità di ottimizzazione. Aiutano inoltre le aziende a migliorare la progettazione dell'intero processo di ingegneria del prodotto e a migliorare le capacità decisionali.
Consentendo lo sviluppo di animazioni e la visualizzazione rapida, il software contribuisce ad accelerare l'intero processo di animazione, elaborazione delle immagini e progettazione grafica. Inoltre, elimina la necessità di modelli aggiuntivi. Tutti questi fattori stanno guidando il mercato dei software di visualizzazione e rendering 3D.
Segmentazione e ambito del report:
Il mercato dei software di visualizzazione e rendering 3D è segmentato in base all'applicazione, all'implementazione, all'utente finale e all'area geografica. In base all'applicazione, il mercato dei software di visualizzazione e rendering 3D è segmentato in simulazione di formazione, marketing e pubblicità, videogiochi, visualizzazione di prodotti e visualizzazione architettonica. In base all'implementazione, il mercato dei software di visualizzazione e rendering 3D è segmentato in on-premise e cloud. In base all'utente finale, il mercato dei software di visualizzazione e rendering 3D è segmentato in media e intrattenimento, architettura e costruzioni, progettazione e ingegneria, assistenza sanitaria e altri. Il mercato dei software di visualizzazione e rendering 3D, in base all'area geografica, è segmentato in Nord America, Europa, Asia-Pacifico, Medio Oriente e Asia-Pacifico. Africa e Sud America.
Analisi segmentale:
In base all'implementazione, il mercato dei software di visualizzazione e rendering 3D è suddiviso in:
- On-Premise
- Cloud
Il segmento on-premise ha detenuto una quota di mercato maggiore nel 2022 e si prevede che registrerà un CAGR più elevato nel mercato tra il 2022 e il 2030. Nell'implementazione on-premise, hardware e software vengono installati e gestiti presso la sede aziendale. La soluzione on-premise offre un notevole vantaggio alle organizzazioni consentendo loro di preservare tutti i processi aziendali e i sistemi interni attuali, come i metodi di produzione e la tecnologia utilizzata, e di implementare gli standard di sicurezza dei dati e controllare un intero processo ospitato entro i propri limiti. Pertanto, queste aziende preferiscono che la visualizzazione e il rendering 3D vengano implementati e gestiti sotto la propria supervisione. Inoltre, l'implementazione on-premise è ampiamente adottata da aziende grandi e consolidate in grado di investire ingenti capitali nella manutenzione di questi sistemi.
Analisi regionale:
Il mercato dei software di visualizzazione e rendering 3D è ampiamente segmentato in cinque regioni principali: Nord America, Europa, Asia Pacifico (APAC), Medio Oriente e Africa (MEA) e Sud America. Il Nord America ha detenuto la maggiore quota di mercato dei software di visualizzazione e rendering 3D nel 2022. La crescita del mercato in questa regione è attribuita a fattori quali politiche governative favorevoli e una prospettiva positiva verso l'adozione di nuove tecnologie. Inoltre, la presenza di una solida infrastruttura digitale e di importanti operatori di mercato ha aperto la strada alla prosperità del mercato dei software di visualizzazione e rendering 3D in Nord America. Inoltre, la regione ospita il più grande settore media e intrattenimento al mondo, che sfrutta i più recenti strumenti di progettazione e animazione per la produzione di contenuti grafici avanzati. La maggior parte delle aziende Fortune 500 al mondo, compresi ampi centri di progettazione e ricerca e sviluppo, sono presenti nella regione. Le aziende manifatturiere investono ingenti somme in strumenti di progettazione come strumenti di visualizzazione e rendering 3D per offrire prodotti competitivi sul mercato. Inoltre, la presenza di un vasto settore manifatturiero integra ulteriormente il settore logistico in Nord America. Con l'obiettivo di ottimizzare le risorse, i settori della logistica stanno ora investendo attivamente in tecnologie avanzate, inclusi strumenti di visualizzazione e rendering 3D, per massimizzare l'utilizzo dei loro magazzini.
Analisi dei principali attori:
I principali attori del mercato dei software di visualizzazione e rendering 3D descritti nel rapporto sono Autodesk Inc, Christie Digital Systems Inc, Dassault Systèmes SE, NVIDIA Corp, Chaos Group, Luxion Inc, OTOY Inc, Next Limit, Act-3D e Thea Render di Altair.
Approfondimenti regionali sul mercato dei software di visualizzazione e rendering 3D
Le tendenze e i fattori regionali che influenzano il mercato dei software di visualizzazione e rendering 3D durante il periodo di previsione sono stati ampiamente spiegati dagli analisti di The Insight Partners. Questa sezione illustra anche i segmenti e la distribuzione geografica del mercato dei software di visualizzazione e rendering 3D in Nord America, Europa, Asia-Pacifico, Medio Oriente e Africa, America meridionale e centrale.
Ambito del rapporto di mercato sul software di visualizzazione e rendering 3D
| Attributo del rapporto | Dettagli |
|---|---|
| Dimensioni del mercato in 2022 | US$ 2.69 Billion |
| Dimensioni del mercato per 2030 | US$ 11.83 Billion |
| CAGR globale (2022 - 2030) | 20.3% |
| Dati storici | 2020-2021 |
| Periodo di previsione | 2023-2030 |
| Segmenti coperti |
By Applicazione
|
| Regioni e paesi coperti |
Nord America
|
| Leader di mercato e profili aziendali chiave |
|
Densità degli operatori del mercato dei software di visualizzazione e rendering 3D: comprendere il suo impatto sulle dinamiche aziendali
Il mercato dei software di visualizzazione e rendering 3D è in rapida crescita, trainato dalla crescente domanda degli utenti finali, dovuta a fattori quali l'evoluzione delle preferenze dei consumatori, i progressi tecnologici e una maggiore consapevolezza dei vantaggi del prodotto. Con l'aumento della domanda, le aziende stanno ampliando la propria offerta, innovando per soddisfare le esigenze dei consumatori e sfruttando le tendenze emergenti, alimentando ulteriormente la crescita del mercato.
- Ottieni il Mercato del software di visualizzazione e rendering 3D Panoramica dei principali attori chiave
Sviluppi recenti:
I player del mercato dei software di visualizzazione e rendering 3D adottano ampiamente strategie sia organiche che inorganiche. Di seguito sono elencati alcuni recenti sviluppi chiave del mercato:
- Nel 2022, Autodesk ha annunciato l'acquisizione di Moxion, lo sviluppatore neozelandese di una potente piattaforma basata su cloud per i quotidiani digitali utilizzati dal famoso regista.
- Nel 2022, Jaguar Land Rover e NVIDIA stanno ridefinendo il lusso moderno, infondendo intelligenza nell'esperienza del cliente. Offriranno inoltre funzionalità di intelligenza artificiale all'interno del veicolo, tra cui il monitoraggio del conducente e degli occupanti e la visualizzazione avanzata, sfruttando lo stack software DRIVE IX.
- Nel 2022, Chaos ed Enscape si fonderanno per essere supportate da TA Associates e LEA Partners. Una società di private equity focalizzata sulla tecnologia fonderà Enscape, leader nello sviluppo di tecnologie di rendering in tempo reale e workflow di progettazione per architettura, ingegneria ed edilizia.

Ankita è una dinamica professionista della ricerca di mercato e della consulenza con oltre 8 anni di esperienza nei settori della tecnologia, dei media, dell'ICT, dell'elettronica e dei semiconduttori. Ha guidato e portato a termine con successo oltre 100 incarichi di consulenza e ricerca per clienti globali come Microsoft, Oracle, NEC Corporation, SAP, KPMG ed Expeditors International. Le sue competenze principali includono la valutazione del mercato, l'analisi dei dati, le previsioni, la formulazione di strategie, l'intelligence competitiva e la redazione di report.
Ankita è esperta nella gestione di cicli di progetto completi, dalla progettazione di proposte pre-vendita e discussioni con i clienti fino alla fornitura di insight fruibili post-vendita. È esperta nella gestione di team interfunzionali, nella strutturazione di moduli di ricerca complessi e nell'allineamento delle soluzioni agli obiettivi aziendali specifici del cliente. Le sue eccellenti capacità di comunicazione, leadership e presentazione le hanno permesso di fornire costantemente risultati orientati al valore in contesti di mercato in rapida evoluzione.
- Analisi completa delle dimensioni e delle previsioni di mercato
- Analisi dettagliata della segmentazione
- Valutazione approfondita delle dinamiche di mercato
- Approfondimenti a livello regionale e nazionale
- Analisi del panorama competitivo e benchmarking aziendale
- Business intelligence strategica
Testimonianze
Il report di mercato sui sistemi SCADA di Insight Partners è completo, con preziosi spunti sulle tendenze attuali e sulle previsioni future. Il team si è dimostrato altamente professionale, reattivo e disponibile in ogni fase del progetto. Siamo molto soddisfatti e consigliamo vivamente i loro servizi.
RAN KEDEM Partner, Reali Technologies LTDsHo richiesto un report su un mercato software molto specifico e il team lo ha prodotto in pochi giorni. Le informazioni erano molto pertinenti e ben presentate. Ho quindi richiesto alcune modifiche e aggiunte al report. Il team è stato ancora una volta molto reattivo e ho ricevuto il report finale in meno di una settimana.
JEAN-HERVE JENN Presidente, Future AnalyticaAbbiamo collaborato con The Insight Partners per un importante studio di mercato e una previsione. Ci hanno fornito informazioni chiare su opportunità e rischi, che ci hanno aiutato a definire i nostri piani. La loro ricerca è stata facile da usare e basata su dati solidi. Ci ha aiutato a prendere decisioni intelligenti e consapevoli. Li consigliamo vivamente.
PIYUSH NAGPAL Vicepresidente senior, Abbaglianti globaliInsight Partners ha fornito ricerche di mercato approfondite e ben strutturate, con una solida competenza nel settore. Il loro team si è dimostrato professionale e reattivo in ogni fase. Il sito web intuitivo ha reso l'accesso ai report di settore semplice e immediato. Li consigliamo vivamente per servizi di ricerca affidabili e di alta qualità.
YUKIHIKO ADACHI Amministratore delegato, Deep Blue, LLC.Questa è la prima volta che acquisto un report di mercato da The Insight Partners. Sebbene inizialmente fossi indeciso, ho visitato il loro sito web e mi sono sentito più a mio agio nell'acquistare un report di mercato. Sono completamente soddisfatto della qualità del report e del servizio clienti. Avevo diverse domande e commenti sul report iniziale, ma dopo un paio di conversazioni via email con il loro analista credo di avere un report che posso utilizzare come input per il nostro processo di pianificazione strategica. Grazie mille per aver dedicato del tempo extra e aver reso questa esperienza positiva. Consiglierò sicuramente il vostro servizio ad altri e sarete la mia prima persona a cui rivolgermi quando avremo bisogno di ulteriori dati di mercato.
GIOVANNI SUZUKI Presidente e Amministratore Delegato, Consigliere di Amministrazione, Tecnologie BKDesidero esprimere la mia gratitudine per il supporto e la professionalità dimostrati nel rispondere alla mia richiesta di informazioni sul mercato dei dispositivi medici in vitro per malattie infettive in Nigeria. Apprezzo la vostra pazienza, la vostra guida e la vostra disponibilità a offrirmi uno sconto, che alla fine ci ha permesso di concludere l'affare. Non vedo l'ora di collaborare con The Insight Partners in futuro, grazie anche all'impressione che mi avete lasciato dopo questo primo incontro.
Dott. Chijioke AMMINISTRATORE DELEGATO DI ONYIA, PineCrest Healthcare Ltd.Motivo dell'acquisto
- Processo decisionale informato
- Comprensione delle dinamiche di mercato
- Analisi competitiva
- Analisi dei clienti
- Previsioni di mercato
- Mitigazione del rischio
- Pianificazione strategica
- Giustificazione degli investimenti
- Identificazione dei mercati emergenti
- Miglioramento delle strategie di marketing
- Aumento dell'efficienza operativa
- Allineamento alle tendenze normative


