航空燃料カード市場の戦略、主要プレーヤー、成長機会、分析、2030年までの予測
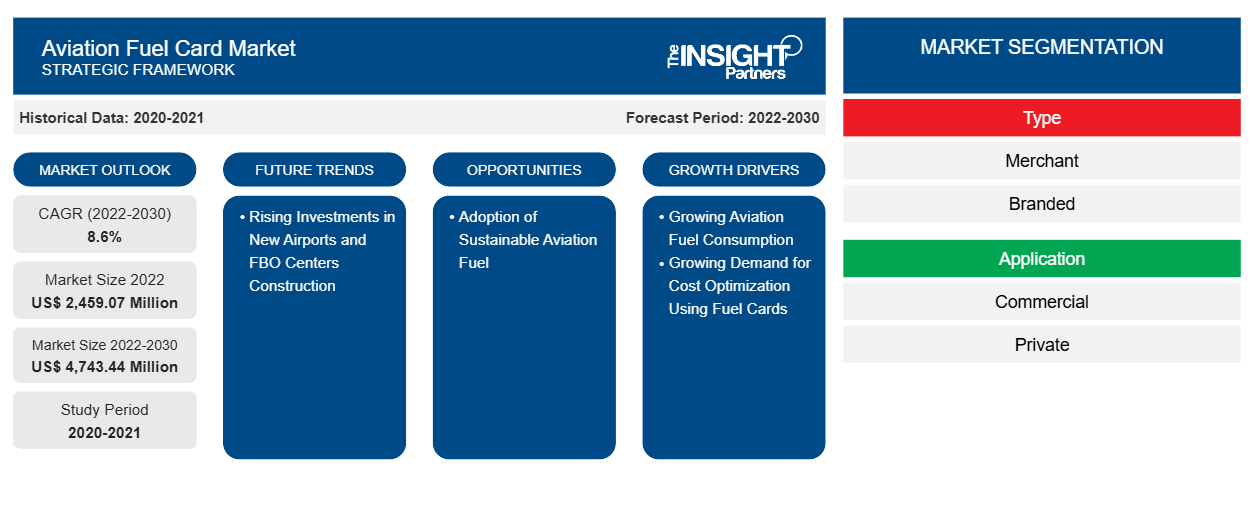
過去データ : 2020-2021 | 基準年 : 2022 | 予測期間 : 2022-2030航空燃料カード市場の規模と予測(2020-2030年)、世界および地域のシェア、トレンド、成長機会分析レポートの対象範囲:タイプ(加盟店、ブランド)、アプリケーション(商業、個人)、および地理別
- ステータス : 出版
- レポートコード : TIPRE00031432
- カテゴリー : 銀行、金融サービス、保険
- ページ数 : 142
- 利用可能なレポート形式 :


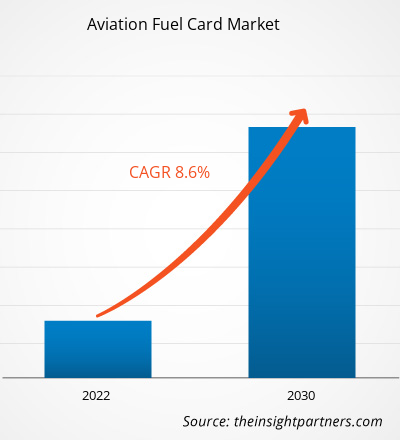
航空燃料カード市場規模は、2022年の24億5,907万米ドルから2030年には47億4,344万米ドルに達すると予測されています。市場は2022年から2030年にかけて8.6%のCAGRを記録すると予想されています。
従来、航空業界は、燃料業界と航空会社の経済状況や既存の契約に応じて、さまざまな方法で燃料の支払いを行ってきました。航空会社やその他の航空業界は、石油会社から直接、または燃料ブローカーを通じて、スポット市場で燃料を購入することがよくあります。このような状況では、航空会社は現金とクレジットを組み合わせて燃料の支払いを行う可能性が高くなります。全体として、航空業界が燃料を取得するために使用する支払い方法は、会社の規模、場所、購入戦略、市場状況、利用可能な可能性など、さまざまな基準によって決まります。統合されたコスト管理ソフトウェアを備えた高限度額の法人カードを使用すると、燃料の支払いをはるかに簡単に監視できます。高限度額のカードを使用すると、企業は支払いの柔軟性が大幅に高まり、銀行の遅延や融資手数料に直面することなく事業を継続できます。さらに、コスト管理 ソフトウェアにリンクされることがほとんどないガソリンカードとは異なり、支出管理会社の高限度額の法人クレジットカードは、完全に統合されたエクスペリエンスを提供します。法人クレジットカードにより、燃料費の集中管理と全体的な経費管理プロセスの合理化が簡単になりました。さまざまな支払い方法や払い戻しに頼るのではなく、1 枚のクレジットカードをすべての燃料関連の購入に使用できるため、支出の追跡と管理が容易になります。ビジネス クレジットカードで燃料支出を統合すると、燃料プロバイダーとのより強力な関係を構築するのに役立ちます。燃料取引に 1 枚のカードを頻繁に使用する航空会社は、数量割引や有利な条件に関して燃料プロバイダーとの交渉力を高めることができます。したがって、他の代替方法が提供する利点は、航空燃料カード市場の成長を妨げます。
航空燃料カード市場分析
多くの燃料生産者や航空会社は、持続可能な航空燃料の開発と採用に取り組んでいます。2023年、ドバイ航空ショーで、ボーイングとゼロペトロリアムの関係者は、合成持続可能な航空燃料(SAF)の開発を加速するための契約に署名しました。2023年、ネステはトロルヘッタン・ヴェーネルスボリ空港と航空会社ヴェストフライグがすべてのフライトで持続可能な航空燃料を使用する世界初の航空会社になるよう支援しました。2023年、エミレーツ航空は、シェルアビエーションとの提携を通じて、ドバイにある航空会社の国際ハブ(DXB)に約30万ガロンの混合持続可能な航空燃料(SAF)を供給することに合意しました。このような取り組みにより、持続可能な航空燃料の採用が増加すると予想されています。航空燃料カードサプライヤーは、持続可能な航空燃料の購入に魅力的なオファーや割引を提供することで、ビジネスを拡大できます。これは最終的に、航空燃料カードの採用と使用の増加につながります。さらに、固定基地オペレーターとの提携により、燃料カードサービスプロバイダーは持続可能な航空燃料を供給するネットワークを拡大することができます。したがって、持続可能な航空燃料取引の増加は、予測期間中に航空燃料カード市場の成長に十分な機会をもたらすと予想されます。
航空燃料カード市場の概要
航空燃料カード市場のエコシステムにおける燃料カードサプライヤーの役割は、燃料カードのシームレスな機能と信頼性を確保する上で極めて重要です。航空燃料カードサプライヤーは、商業航空会社や民間航空会社などのエンドユーザーに燃料カードサービスを提供する上で重要な役割を果たします。燃料カードサプライヤーは、航空燃料の支払いプロセスにおいて安全で効率的な役割を確保します。燃料カードサービスを提供する主要な燃料サプライヤーは、ブランド燃料サプライヤーと呼ばれ、BP plc、Shell Global、ExxonMobil、Titan Aviation Fuels、Jio-BP、AEGFUELS、TotalEnergies Aviation が含まれます。これらの事業体は、航空燃料と航空燃料カードを自ら供給する責任があり、信頼性の高い航空燃料カードサプライチェーンを確保しています。燃料カードサービスを提供するサードパーティと民間企業は、マーチャント燃料サプライヤーと呼ばれ、World Fuel Services、CSI global-fleet、Aviation Pros、Avfuel Corporation が含まれます。マーチャント燃料カードサプライヤーは、主要な航空燃料サプライヤーと提携または協力し、シームレスで安全な支払いプロセスを確保する事業体です。このパートナーシップまたはコラボレーションには、効率的な取引を促進し、信頼性の高い燃料供給を維持するためのシステムの統合が含まれます。
要件に合わせてレポートをカスタマイズする
このレポートの一部、国レベルの分析、Excelデータパックなど、あらゆるレポートを無料でカスタマイズできます。また、スタートアップや大学向けのお得なオファーや割引もご利用いただけます。
航空燃料カード市場:戦略的洞察
-
このレポートの主要な市場動向を入手してください。この無料サンプルには、市場動向から見積もりや予測に至るまでのデータ分析が含まれます。
航空燃料カード市場の推進要因と機会
航空機燃料消費量の増加
航空旅行の需要が高いため、全体的な燃料消費量が増加しています。2022年、米国の航空会社は2021年よりも1億9,400万人多い乗客を運び、前年比で30%増加しました。2022年1月から12月まで、米国の航空会社は8億5,300万人の乗客を扱い、2021年の6億5,800万人、2020年の3億8,800万人から増加しました。2021年、欧州連合(EU)は航空旅行の大幅な回復を経験し、総乗客数は3億7,300万人に達しました。この数字は、前年の2020年と比較して34.9%の顕著な増加を反映しています。航空旅客数の急増はクロアチアで観測され、2021年と比較して84%の顕著な増加を経験しました。さらに、キプロスとギリシャはそれぞれ104.8%と85.9%の大幅な成長率を記録しました。特にクロアチア、キプロス、ギリシャなどの国での乗客数の急増は、航空旅行の需要の増加とそれに伴う燃料の必要性を浮き彫りにしています。
新空港と固定基地運営センター建設への投資増加
世界中のさまざまな先進国や発展途上国が、空港の総数を増やすことに注力しています。ベトナム政府は、観光と貿易を強化するために、2030年までに30以上の空港を建設する予定です。同国にはすでに22の空港がありますが、政府は増加する航空機に対応するために新しい空港の建設に注力しています。ベトナム政府は、2021年にロンタイン国際空港の建設を承認し、2025年に完成する予定です。ロンタイン国際空港は、年間最大1億人の収容能力を持つベトナム最大の空港になります。政府は、2030年までに空港を30以上に拡張することを目指しており、これは同国の航空産業の発展に対する取り組みを示しています。2023年、サウジアラビアは国内航空産業の拡大を発表しましたが、これには1,000億米ドルの投資が必要になります。インドは2023年に、現在のインフラに負担をかけている急増する旅行需要を満たすために数百機の新しい航空機を発注するなど、今後2年間で空港に120億ドルを投資すると発表した。
航空燃料カード市場レポートのセグメンテーション分析
航空燃料カード市場分析の導出に貢献した主要なセグメントは、タイプ、アプリケーション、および地理です。
- タイプに基づいて、航空燃料カード市場はマーチャントとブランドに分類されています。マーチャントセグメントは2022年に大きな市場シェアを占めました。
- 航空燃料カード市場は、用途別に商業用と個人用に区分されています。2022年には商業部門が市場で最大のシェアを占めました。
航空燃料カードの地域別市場シェア分析
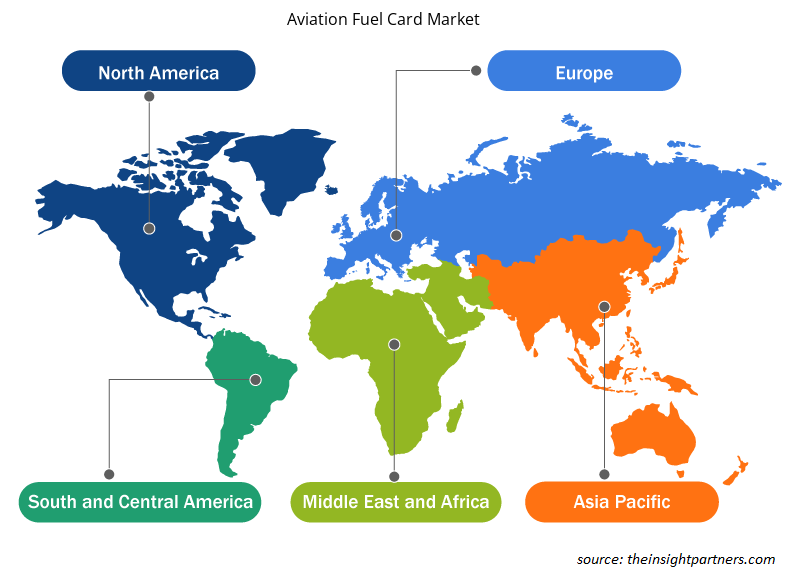
航空燃料カード市場レポートの地理的範囲は、主に北米、ヨーロッパ、アジア太平洋、中東およびアフリカ、南米の 5 つの地域に分かれています。
北米は2022年に航空燃料カード市場を支配しており、予測期間中もその優位性を維持すると予想されています。北米の航空燃料カード業界は、主に燃料カードコンセプトの認知度の高まりによって推進されています。さらに、米国やカナダなどの国で成長する航空産業は、航空燃料カード市場をさらに推進しています。航空産業は米国の注目すべき産業の1つです。2023年にAirlines for Americaが発表したデータによると、商業航空は2022年に米国のGDPの5%、1.25兆米ドルを占めました。さらに、米国の空港と固定基地運営者の大規模なネットワークが、航空燃料カードの使用増加を支えています。2022年、米国は5,100を超える公共空港と14,850の民間空港を運営しました。航空輸送業界はカナダ経済に大きく貢献しています。国際航空運送協会(IATA)によると、この業界は2018年にカナダのGDPに370億米ドル貢献しました。航空燃料消費量の増加と航空価格の上昇がメキシコの航空燃料カード市場を牽引しています。2022年6月、国営ペメックスのジェット燃料卸売価格が大幅に上昇しました。2022年、北米の航空燃料カード市場では米国が最大のシェアを占めました。
航空燃料カード市場の地域別分析
予測期間を通じて航空燃料カード市場に影響を与える地域的な傾向と要因は、Insight Partners のアナリストによって徹底的に説明されています。このセクションでは、北米、ヨーロッパ、アジア太平洋、中東、アフリカ、南米、中米にわたる航空燃料カード市場のセグメントと地理についても説明します。
- 航空燃料カード市場の地域別データを入手
航空燃料カード市場レポートの範囲
| レポート属性 | 詳細 |
|---|---|
| 2022年の市場規模 | 24億5,907万米ドル |
| 2030年までの市場規模 | 47億4,344万米ドル |
| 世界のCAGR(2022-2030年) | 8.6% |
| 履歴データ | 2020-2021 |
| 予測期間 | 2022-2030 |
| 対象セグメント |
タイプ別
|
| 対象地域と国 |
北米
|
| 市場リーダーと主要企業プロフィール |
|
航空燃料カード市場のプレーヤー密度:ビジネスダイナミクスへの影響を理解する
航空燃料カード市場は、消費者の嗜好の変化、技術の進歩、製品の利点に対する認識の高まりなどの要因により、エンドユーザーの需要が高まり、急速に成長しています。需要が高まるにつれて、企業は提供を拡大し、消費者のニーズを満たすために革新し、新たなトレンドを活用し、市場の成長をさらに促進しています。
市場プレーヤー密度とは、特定の市場または業界内で活動している企業または会社の分布を指します。これは、特定の市場スペースに、その市場規模または総市場価値に対してどれだけの競合相手 (市場プレーヤー) が存在するかを示します。
航空燃料カード市場で事業を展開している主要企業は次のとおりです。
- シェル
- BP社
- アソシエイテッド・エナジー・グループLLC
- ビバ・エナジー・グループ
- TITAN アビエーションフューエルズ株式会社
免責事項:上記の企業は、特定の順序でランク付けされていません。
- 航空燃料カード市場のトップキープレーヤーの概要を入手
航空燃料カード市場のニュースと最近の動向
航空燃料カード市場は、主要な企業出版物、協会データ、データベースを含む一次調査および二次調査後の定性的および定量的データを収集することによって評価されます。以下は、航空燃料カード市場の動向と戦略のリストです。
- 2023年9月、国際航空燃料製品およびサービスのサプライヤーであるAir bpは、ExecuJetとの新たな代理店提携により、ベルリン・ブランデンブルク空港(BER)の一般航空(GA)ターミナルでJet-A1燃料の提供を開始しました。(出典:Air BP、プレスリリース/企業ウェブサイト/ニュースレター)
- 2022年10月、グローバルB2B決済および請求ネットワークであるTreviPayは、KHIの協力を得てTreviPay Aviation Networkを立ち上げ、一般航空業界および防衛航空業界にサービスを提供するFBO(固定基地オペレーター)および飛行支援サービス組織とその顧客のニーズに合わせた共同ブランドのクローズドループカードソリューションを提供します。(出典:TreviPay、プレスリリース/企業ウェブサイト/ニュースレター)
航空燃料カード市場レポートの対象範囲と成果物
「航空燃料カード市場の規模と予測(2020〜2030年)」レポートでは、以下の分野をカバーする市場の詳細な分析を提供しています。
- 対象範囲に含まれるすべての主要市場セグメントの世界、地域、国レベルでの市場規模と予測
- 市場の動向(推進要因、制約、主要な機会など)
- 今後の主な動向
- ポーターのファイブフォース分析の詳細
- 主要な市場動向、主要プレーヤー、規制、最近の市場動向を網羅した世界および地域の市場分析
- 市場集中、ヒートマップ分析、主要プレーヤー、最近の動向を網羅した業界の状況と競争分析
- SWOT分析による詳細な企業プロフィール

アンキタは、テクノロジー、メディア、ICT、エレクトロニクス・半導体の各分野で8年以上の経験を持つ、ダイナミックな市場調査およびコンサルティングのプロフェッショナルです。Microsoft、Oracle、NEC、SAP、KPMG、Expeditors Internationalといったグローバルクライアントに対し、100件以上のコンサルティングおよび調査案件を主導・遂行してきました。彼女のコアコンピテンシーは、市場評価、データ分析、予測、戦略策定、競合情報、レポート作成です。
アンキタは、販売前の提案書作成やクライアントとの協議から、販売後の実用的なインサイトの提供まで、プロジェクトサイクル全体を巧みに管理することに長けています。彼女は、部門横断的なチームの管理、複雑な調査モジュールの構築、そしてクライアント固有のビジネス目標に合わせたソリューションの調整に長けています。優れたコミュニケーション能力、リーダーシップ、そしてプレゼンテーション能力により、急速に変化する市場環境において、常に価値主導の成果を生み出しています。
- 過去2年間の分析、基準年、CAGRによる予測(7年間)
- PEST分析とSWOT分析
- 市場規模価値/数量 - 世界、地域、国
- 業界と競争環境
- Excel データセット
お客様の声
Insight PartnersのSCADAシステム市場レポートは包括的で、現在のトレンドと将来の予測に関する貴重な洞察が含まれています。チームは終始、非常にプロフェッショナルで、対応が早く、サポートも充実していました。私たちは彼らのサービスに非常に満足しており、強くお勧めします。
ラン・ケデム パートナー, レアリテクノロジーズ株式会社非常に特殊なソフトウェア市場に関するレポートを依頼したところ、チームは数日でレポートを作成してくれました。情報は非常に関連性が高く、分かりやすくまとめられていました。その後、レポートにいくつか修正と追加を依頼しましたが、チームは非常に迅速に対応し、1週間も経たないうちに最終レポートを受け取ることができました。
ジャン=エルヴェ・ジェン 会長, フューチャー・アナリティカ重要な市場調査と予測のために、The Insight Partnersと協力しました。彼らは機会とリスクに関する明確な洞察を提供し、私たちの計画策定に役立ちました。彼らの調査は使いやすく、確かなデータに基づいており、賢明で自信に満ちた意思決定に役立ちました。彼らを強くお勧めします。
ピユーシュ・ナグパル 上級副社長, ハイビームグローバルInsight Partnersは、深い専門知識に基づき、洞察力に富み、構造化された市場調査を提供しました。チームは終始プロフェッショナルで、対応力も抜群でした。ユーザーフレンドリーなウェブサイトにより、業界レポートへのアクセスもスムーズでした。信頼性の高い高品質な調査サービスをお探しなら、Insight Partnersを強くお勧めします。
安達幸彦 最高経営責任者(CEO), ディープブルーLLC。The Insight Partnersから市場レポートを購入するのは今回が初めてです。最初は不安でしたが、ウェブサイトを見て、リスクを負ってでも購入してみようという気持ちになりました。レポートの品質とカスタマーサービスには大変満足しています。最初のレポートにはいくつか質問やコメントがありましたが、アナリストとメールで何度かやり取りした結果、戦略策定プロセスへのインプットとして活用できるレポートが完成しました。貴重なお時間を割いていただき、貴重な体験をさせていただき、誠にありがとうございました。他の方にもぜひお勧めしたいですし、今後さらに市場データが必要になった際には、まずThe Insight Partnersにご連絡させていただきます。
ジョン・スズキ 社長兼最高経営責任者、取締役, BKテクノロジーズナイジェリアの感染症IVD市場に関する情報提供依頼に対し、ご対応いただいた際、ご尽力とプロフェッショナルな姿勢に深く感謝申し上げます。忍耐強く、的確なアドバイスをいただき、また、最終的に取引成立に至った割引のご提供にも深く感謝申し上げます。今回の最初の出会いで得た強い印象のおかげで、今後もThe Insight Partnersとの連携を心待ちにしております。
チジオケ博士 オニア マネージングディレクター, パインクレストヘルスケア株式会社購入理由
- 情報に基づいた意思決定
- 市場動向の理解
- 競合分析
- 顧客インサイト
- 市場予測
- リスク軽減
- 戦略計画
- 投資の正当性
- 新興市場の特定
- マーケティング戦略の強化
- 業務効率の向上
- 規制動向への対応


 無料サンプルを入手 - 航空燃料カード市場