バーコードソフトウェア市場分析と予測:規模、シェア、成長、トレンド2031年
過去データ : 2021-2023 | 基準年 : 2024 | 予測期間 : 2025-2031バーコードソフトウェア市場の規模と予測(2021年 - 2031年)、世界および地域別のシェア、トレンド、成長機会分析レポートの対象範囲:バーコードの種類(1Dバーコードと2Dバーコード)、展開(クラウドとオンプレミス)、アプリケーション(在庫管理、販売時点管理(POS)業務、資産管理、従業員の勤怠管理と時間追跡など)、最終用途産業(BFSI、運輸・物流、製造、ヘルスケア、小売・電子商取引など)、および地域(北米、ヨーロッパ、アジア太平洋、中東・アフリカ、南米・中米)
- ステータス : 出版
- レポートコード : TIPRE00003636
- カテゴリー : テクノロジー、メディア、通信
- ページ数 : 255
- 利用可能なレポート形式 :


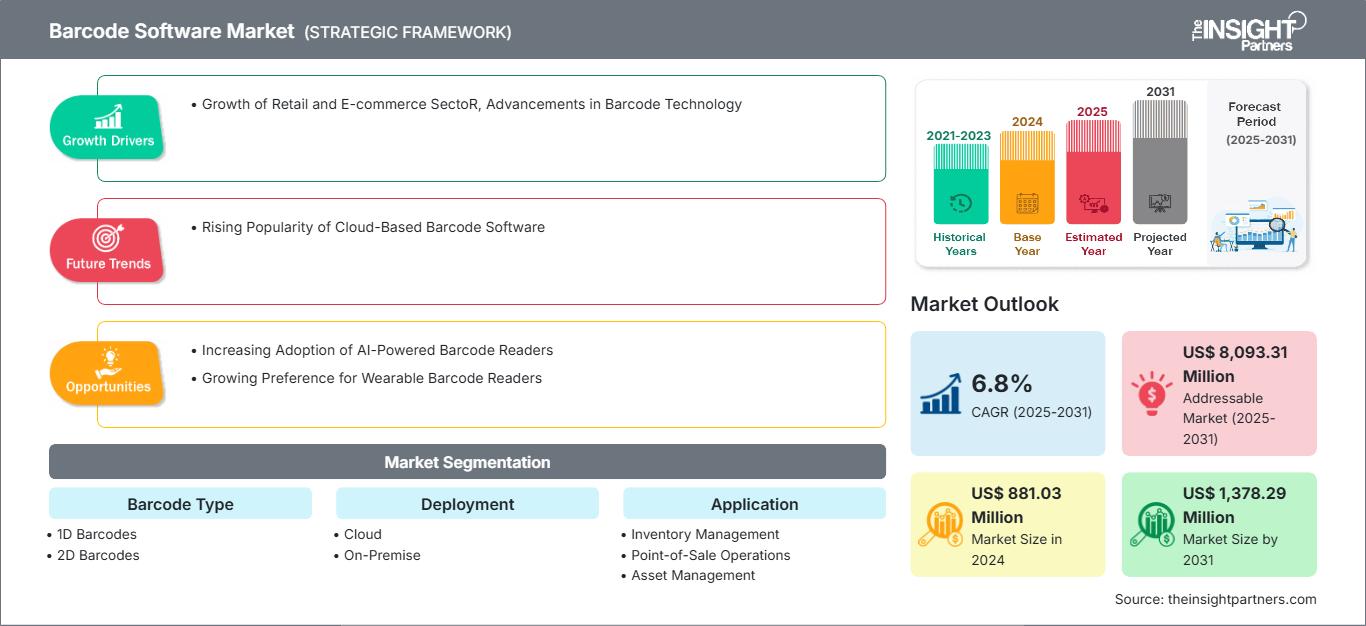
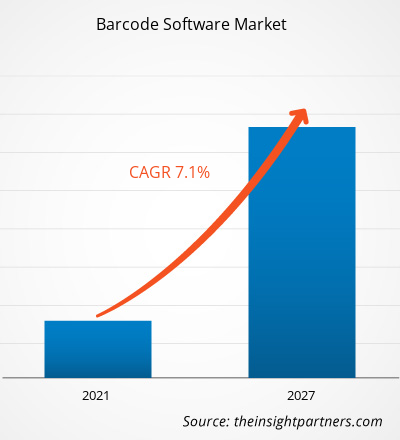
バーコードソフトウェア市場規模は、2024年に8億8,103万米ドルと評価され、2031年までに13億7,829万米ドルに達すると見込まれています。市場は2025年から2031年にかけて6.8%のCAGRを記録すると予測されています。クラウドベースのバーコードソフトウェアの人気の高まりは、主要な市場トレンドになる可能性があります。
バーコードソフトウェア市場分析
バーコードソフトウェアは、デスクトップシステム、モバイルデバイス、クラウドベースの環境など、さまざまなプラットフォームをサポートしているため、さまざまな組織の独自のニーズに適応し、多用途に使用できます。小売およびeコマースセクターの成長やバーコード技術の進歩などの要因が、バーコードソフトウェア市場を牽引しています。AI搭載バーコードリーダーの採用増加とウェアラブルバーコードリーダーの好感度の高まりにより、バーコードソフトウェア市場は予測期間中に成長すると予想されます。クラウドベースのバーコードソフトウェアの人気の高まりは、バーコードソフトウェア市場の重要なトレンドになると予想されています。しかし、スキャナーへの依存は、バーコードソフトウェア市場の成長を阻害する可能性があります。
バーコードソフトウェア市場の概要
バーコードソフトウェアには、バーコードの作成、印刷、管理のために特別に開発されたアプリケーションが含まれます。バーコードは、データを表す平行なバーまたは幅の異なる線で構成される、機械で読み取り可能なコードです。このソフトウェアを使用すると、バーコードスキャナーやモバイルデバイスでスキャンしてデコードできるバーコード画像またはラベルを生成できます。他のビジネスシステムと統合され、複数のプラットフォームをサポートすることで、スムーズなデータ交換を促進し、全体的な業務効率を向上させます。バーコードソフトウェアは、在庫管理、製品追跡、POSシステム、サプライチェーン管理など、さまざまな業界で広く利用されています。バーコードソフトウェアは、在庫追跡から製品ラベル作成まで、さまざまな用途のバーコードの作成、印刷、管理を容易にします。人気のある選択肢としては、ラベルデザイン、システムとの統合、拡張性といった機能を備えたBarTenderやZebraDesignerなどが挙げられます。これらのソフトウェアは他の業務システムと容易に統合できるため、プラットフォーム間でスムーズなデータ交換が可能です。この統合により、リアルタイム更新、人的ミスの最小化、在庫追跡と管理の精度向上が可能になり、全体的な業務効率が向上します。
要件に合わせてレポートをカスタマイズ
レポートの一部、国レベルの分析、Excelデータパックなどを含め、スタートアップ&大学向けに特別オファーや割引もご利用いただけます(無償)
バーコードソフトウェア市場: 戦略的洞察
-
このレポートの主要な市場動向を入手してください。この無料サンプルには、市場動向から見積もりや予測に至るまでのデータ分析が含まれます。
バーコード ソフトウェア市場の推進要因と機会
小売および電子商取引セクターの成長
国際貿易局によると、2026 年までに世界の B2B 電子商取引市場は驚異的な 36 兆米ドルに達すると予測されており、このセクターの巨大な規模と可能性を浮き彫りにしています。同様に、2025年2月、米国商務省国勢調査局は、2024年第4四半期の米国小売電子商取引売上高の推定を発表しました。2024年第4四半期の電子商取引売上高は、小売売上高全体の16.4%を占め、3,529億米ドルに達し、2024年第3四半期から22.1%増加しました。2023年第4四半期と比較して、電子商取引売上高は9.3%増加し、小売売上高全体は4.5%増加しました。2024年通年の電子商取引総売上高は推定1兆1,926億米ドルに達し、2023年から8.1%増加しました。世界的な小売および電子商取引分野の急速な成長により、効率的な在庫およびサプライチェーン管理システムの必要性が高まっています。バーコードソフトウェアを使用すると、企業は在庫管理を改善し、製品の移動をリアルタイムで追跡し、より優れた顧客サービスを提供できます。電子商取引の成長に伴い、正確な注文処理を維持するためにバーコードスキャンおよび追跡ソフトウェアの必要性がさらに重要になっています。そのため、成長を続ける小売業と電子商取引部門がバーコードソフトウェア市場を牽引しています。
AI 搭載バーコードリーダーの採用増加
バーコードソフトウェア市場は、技術の進歩と、様々な製造業における自動化と効率化の需要の高まりに牽引され、著しい成長を遂げています。これらの高度なバーコードリーダーの導入は、バーコードソフトウェア市場で AI 搭載ソリューションの採用が拡大していることを示しています。例えば、2025 年 1 月、産業用マシンビジョンの世界的リーダーである Cognex Corporation は、最新の製品である DataMan 290 および 390 バーコードリーダーを発売し、この分野でのイノベーションを推進し続けています。これらの新製品は最先端の AI テクノロジーを活用して比類のないデコード精度と信頼性を実現し、業務の生産性向上に欠かせないツールとなっています。これらの高度なリーダーの導入は、複雑なバーコードスキャンの課題に対処するだけでなく、進化するバーコードソフトウェア市場における数多くのビジネスチャンスの開拓にもつながります。コグネックスのDataMan 290および390バーコードリーダーは、産業用スキャン技術における大きな飛躍です。高度なAIを搭載したこれらのリーダーは、幅広いバーコードタイプと製造環境で高性能なデコードを保証します。AIの統合により、デバイスはさまざまなスキャン条件を学習して適応できるため、コントラストが低い、破損している、または印刷品質の低いバーコードなどの困難な状況でも、リアルタイムで精度と速度が向上します。このイノベーションは、効率を高め、ダウンタイムを最小限に抑える多用途のソリューションをメーカーに提供します。
バーコードソフトウェア市場レポートのセグメンテーション分析
バーコードソフトウェア市場分析の導出に貢献した主要なセグメントは、導入、バーコードタイプ、アプリケーション、および最終用途産業です。
- 導入の観点から、バーコードソフトウェア市場はオンプレミスとクラウドに分かれています。 2024 年にはクラウド セグメントが市場を支配しました。
- バーコードの種類に基づいて、市場は 1D バーコードと 2D バーコードに分割されています。2024 年には 1D バーコード セグメントが市場を支配しました。
- アプリケーションの観点から、市場は在庫管理、販売時点管理 (POS) 操作、資産管理、従業員の勤怠と時間追跡などに分割されています。2024 年には在庫管理セグメントが市場を支配しました。
- 最終用途産業に基づいて、バーコード ソフトウェア市場は、BFSI、輸送と物流、製造、ヘルスケア、小売と電子商取引などに分かれています。2024 年には小売と電子商取引セグメントが市場を支配しました。
地域別のバーコード ソフトウェア市場シェア分析
- バーコード ソフトウェア市場は、北米、ヨーロッパ、アジア太平洋 (APAC)、中東 & アフリカの 5 つの主要地域に分割されています。
- 北米は、最先端技術の早期導入、主要市場プレーヤーの強力な存在、物流、小売、在庫管理における自動化の需要により、世界のバーコードソフトウェア市場で支配的な地位を占めています。この地域は、スマート製造とeコマースへの投資に加えて、確立されたインフラストラクチャを備えています。さらに、The Enterprise Worldによると、米国は世界のQRコード使用のフロントランナーであり、2022年には世界のスキャンの42.2%を占め、このシェアは2023年には43.9%に上昇します。
- ヨーロッパでは、特に自動車、民生用電子機器、医薬品などの業界における地域の強力な製造基盤に牽引され、バーコードソフトウェア市場は着実に拡大しています。在庫管理、サプライチェーンの最適化、規制遵守のためのバーコードソリューションの採用は、この地域で大幅に増加しています。さらに、インダストリー4.0へのトレンドの高まりと欧州製造業のデジタル化により、バーコードソフトウェアソリューションの需要が高まっています。
- アジア太平洋地域は、バーコードソフトウェア市場で最も高い成長率が見込まれています。この急成長は、中国やインドなどの新興経済国の急速な工業化によって推進されており、これらの国では小売、物流、製造業でバーコードソフトウェアの採用が進んでいます。この地域では、自動化、スマート物流、eコマースプラットフォームの開発への注目が着実に高まっています。さらに、食品・飲料、小売、ヘルスケア分野におけるバーコードベースのソリューションの需要も高まっています。さらに、VISAによると、2022年には東南アジアの消費者の93%が取引にQRコードを含むさまざまなキャッシュレス決済方法を利用しました。この地域では効率的なデジタル決済ソリューションの需要が高まっており、技術の進歩と市場の拡大を促進しています。
バーコード ソフトウェア市場レポートの範囲
バーコード ソフトウェア市場のニュースと最近の動向
バーコード ソフトウェア市場は、主要な企業出版物、協会データ、データベースなどの一次調査と二次調査後の定性的および定量的データを収集することで評価されます。バーコード ソフトウェア市場におけるいくつかの動向を以下に示します。
- Honeywell (Nasdaq: HON) は、SwiftDecoder バーコード デコード ソフトウェアが Corvus Robotics の自律飛行在庫ドローンに統合されると発表しました。この先駆的なソリューションは、倉庫や配送センター(DC)内で使用され、小売業者、販売業者、メーカーがケースレベルやパレットレベルで、急速に変化する在庫をより迅速かつ正確に追跡できるようにします。
(出典:Honeywell、プレスリリース、2025年3月)
- Revenova社は現在、TEC-ITバーコードAPIを輸送管理システム(TMS)に統合しています。TEC-ITサブスクリプションを利用することで、追加のプログラミングなしで簡単にバーコードを作成できるオンラインバーコードジェネレーターを利用できます。この機能により、物流管理と在庫追跡が簡素化されます。
(出典: TEC-IT Datenverarbeitung GmbH、プレスリリース、2024年11月)
バーコードソフトウェア市場レポートの対象範囲と成果物
「バーコードソフトウェア市場規模と予測(2021~2031年)」では、以下の分野を網羅した詳細な市場分析を提供しています。
- 調査対象範囲に含まれるすべての主要市場セグメントについて、世界、地域、国レベルでのバーコードソフトウェア市場規模と予測
- バーコードソフトウェア市場の動向、および推進要因、制約要因、主要な機会などの市場動向
- 詳細なPEST分析とSWOT分析
- 主要な市場動向、世界および地域の枠組み、主要プレーヤー、規制、最近の市場動向を網羅したバーコードソフトウェア市場分析
- 市場集中、ヒートマップ分析、主要プレーヤー、最近の動向を網羅した業界動向と競争分析バーコードソフトウェア市場の動向
- 詳細な企業プロフィール
バーコードソフトウェア市場の地域別分析
予測期間を通じてバーコードソフトウェア市場に影響を与える地域的な傾向と要因については、The Insight Partnersのアナリストが詳細に解説しています。このセクションでは、北米、ヨーロッパ、アジア太平洋、中東・アフリカ、中南米におけるバーコードソフトウェア市場のセグメントと地域についても解説しています。
バーコードソフトウェア市場レポートの範囲
| レポート属性 | 詳細 |
|---|---|
| の市場規模 2024 | US$ 881.03 Million |
| 市場規模別 2031 | US$ 1,378.29 Million |
| 世界的なCAGR (2025 - 2031) | 6.8% |
| 過去データ | 2021-2023 |
| 予測期間 | 2025-2031 |
| 対象セグメント |
By バーコードの種類
|
| 対象地域と国 |
北米
|
| 市場リーダーと主要企業の概要 |
|
バーコードソフトウェア市場のプレーヤー密度:ビジネスダイナミクスへの影響を理解する
バーコードソフトウェア市場は、消費者の嗜好の変化、技術の進歩、製品の利点に対する認知度の高まりといった要因により、エンドユーザーの需要が高まり、急速に成長しています。需要が高まるにつれ、企業は製品ラインナップの拡充、消費者ニーズへの対応、そして新たなトレンドの活用を進めており、これが市場の成長をさらに加速させています。
- 入手 バーコードソフトウェア市場 主要プレーヤーの概要

アンキタは、テクノロジー、メディア、ICT、エレクトロニクス・半導体の各分野で8年以上の経験を持つ、ダイナミックな市場調査およびコンサルティングのプロフェッショナルです。Microsoft、Oracle、NEC、SAP、KPMG、Expeditors Internationalといったグローバルクライアントに対し、100件以上のコンサルティングおよび調査案件を主導・遂行してきました。彼女のコアコンピテンシーは、市場評価、データ分析、予測、戦略策定、競合情報、レポート作成です。
アンキタは、販売前の提案書作成やクライアントとの協議から、販売後の実用的なインサイトの提供まで、プロジェクトサイクル全体を巧みに管理することに長けています。彼女は、部門横断的なチームの管理、複雑な調査モジュールの構築、そしてクライアント固有のビジネス目標に合わせたソリューションの調整に長けています。優れたコミュニケーション能力、リーダーシップ、そしてプレゼンテーション能力により、急速に変化する市場環境において、常に価値主導の成果を生み出しています。
- 過去2年間の分析、基準年、CAGRによる予測(7年間)
- PEST分析とSWOT分析
- 市場規模価値/数量 - 世界、地域、国
- 業界と競争環境
- Excel データセット
お客様の声
Insight PartnersのSCADAシステム市場レポートは包括的で、現在のトレンドと将来の予測に関する貴重な洞察が含まれています。チームは終始、非常にプロフェッショナルで、対応が早く、サポートも充実していました。私たちは彼らのサービスに非常に満足しており、強くお勧めします。
ラン・ケデム パートナー, レアリテクノロジーズ株式会社非常に特殊なソフトウェア市場に関するレポートを依頼したところ、チームは数日でレポートを作成してくれました。情報は非常に関連性が高く、分かりやすくまとめられていました。その後、レポートにいくつか修正と追加を依頼しましたが、チームは非常に迅速に対応し、1週間も経たないうちに最終レポートを受け取ることができました。
ジャン=エルヴェ・ジェン 会長, フューチャー・アナリティカ重要な市場調査と予測のために、The Insight Partnersと協力しました。彼らは機会とリスクに関する明確な洞察を提供し、私たちの計画策定に役立ちました。彼らの調査は使いやすく、確かなデータに基づいており、賢明で自信に満ちた意思決定に役立ちました。彼らを強くお勧めします。
ピユーシュ・ナグパル 上級副社長, ハイビームグローバルInsight Partnersは、深い専門知識に基づき、洞察力に富み、構造化された市場調査を提供しました。チームは終始プロフェッショナルで、対応力も抜群でした。ユーザーフレンドリーなウェブサイトにより、業界レポートへのアクセスもスムーズでした。信頼性の高い高品質な調査サービスをお探しなら、Insight Partnersを強くお勧めします。
安達幸彦 最高経営責任者(CEO), ディープブルーLLC。The Insight Partnersから市場レポートを購入するのは今回が初めてです。最初は不安でしたが、ウェブサイトを見て、リスクを負ってでも購入してみようという気持ちになりました。レポートの品質とカスタマーサービスには大変満足しています。最初のレポートにはいくつか質問やコメントがありましたが、アナリストとメールで何度かやり取りした結果、戦略策定プロセスへのインプットとして活用できるレポートが完成しました。貴重なお時間を割いていただき、貴重な体験をさせていただき、誠にありがとうございました。他の方にもぜひお勧めしたいですし、今後さらに市場データが必要になった際には、まずThe Insight Partnersにご連絡させていただきます。
ジョン・スズキ 社長兼最高経営責任者、取締役, BKテクノロジーズナイジェリアの感染症IVD市場に関する情報提供依頼に対し、ご対応いただいた際、ご尽力とプロフェッショナルな姿勢に深く感謝申し上げます。忍耐強く、的確なアドバイスをいただき、また、最終的に取引成立に至った割引のご提供にも深く感謝申し上げます。今回の最初の出会いで得た強い印象のおかげで、今後もThe Insight Partnersとの連携を心待ちにしております。
チジオケ博士 オニア マネージングディレクター, パインクレストヘルスケア株式会社購入理由
- 情報に基づいた意思決定
- 市場動向の理解
- 競合分析
- 顧客インサイト
- 市場予測
- リスク軽減
- 戦略計画
- 投資の正当性
- 新興市場の特定
- マーケティング戦略の強化
- 業務効率の向上
- 規制動向への対応


 無料サンプルを入手 - バーコードソフトウェア市場