Marktanalyse und Prognose für Barcode-Software nach Größe, Anteil, Wachstum, Trends 2031
Historische Daten : 2021-2023 | Basisjahr : 2024 | Prognosezeitraum : 2025-2031Marktgröße und Prognose für Barcode-Software (2021 – 2031), Berichtsabdeckung für globale und regionale Anteils-, Trend- und Wachstumschancenanalyse: Nach Barcode-Typ (1D-Barcodes und 2D-Barcodes), Bereitstellung (Cloud und vor Ort), Anwendung [Bestandsverwaltung, Point-of-Sale (POS)-Betrieb, Anlagenverwaltung, Mitarbeiteranwesenheits- und Zeiterfassung und andere], Endverbrauchsbranche (BFSI, Transport und Logistik, Fertigung, Gesundheitswesen, Einzelhandel und E-Commerce und andere) und Geografie (Nordamerika, Europa, Asien-Pazifik, Naher Osten und Afrika sowie Süd- und Mittelamerika)
- Status : Veröffentlicht
- Berichtscode : TIPRE00003636
- Kategorie : Technologie, Medien und Telekommunikation
- Anzahl der Seiten : 255
- Verfügbare Berichtsformate :


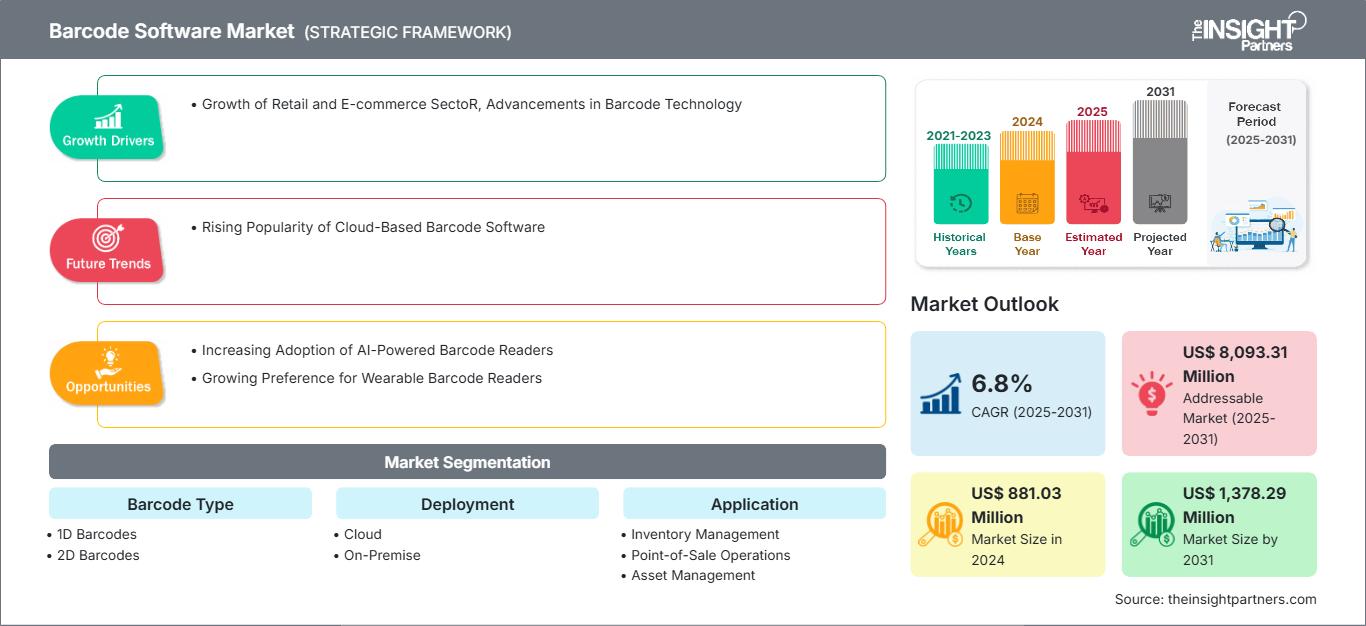
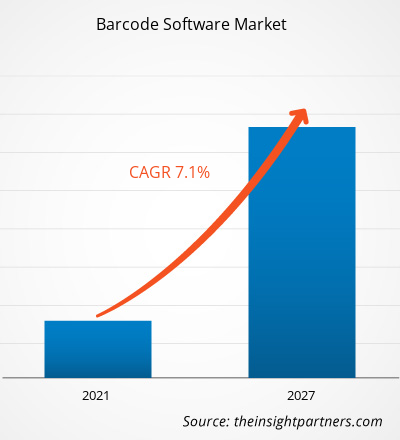
Der Markt für Barcode-Software wurde im Jahr 2024 auf 881,03 Millionen US-Dollar geschätzt und soll bis 2031 1.378,29 Millionen US-Dollar erreichen; von 2025 bis 2031 wird ein CAGR von 6,8 % erwartet. Die steigende Beliebtheit cloudbasierter Barcode-Software dürfte ein wichtiger Markttrend sein.
Marktanalyse für Barcode-Software
Barcode-Software unterstützt eine Reihe von Plattformen, darunter Desktop-Systeme, mobile Geräte und cloudbasierte Umgebungen, und ist daher anpassungsfähig und vielseitig, um den individuellen Anforderungen verschiedener Organisationen gerecht zu werden. Faktoren wie der wachsende Einzelhandels- und E-Commerce-Sektor sowie Fortschritte in der Barcode-Technologie treiben den Markt für Barcode-Software an. Aufgrund der zunehmenden Verbreitung KI-gestützter Barcode-Lesegeräte und der wachsenden Präferenz für tragbare Barcode-Lesegeräte wird für den Prognosezeitraum ein Wachstum des Marktes für Barcode-Software erwartet. Die steigende Beliebtheit cloudbasierter Barcode-Software dürfte ein wichtiger Trend im Barcode-Softwaremarkt werden. Die Abhängigkeit von Scannern könnte jedoch das Wachstum des Barcode-Softwaremarktes hemmen.
Marktübersicht für Barcode-Software
Barcode-Software umfasst Anwendungen, die speziell zum Erstellen, Drucken und Verwalten von Barcodes entwickelt wurden. Ein Barcode ist ein maschinenlesbarer Code, der aus parallelen Strichen oder Linien unterschiedlicher Breite besteht, die Daten darstellen. Mit dieser Software können Benutzer Barcode-Bilder oder -Etiketten erstellen, die von Barcode-Scannern oder mobilen Geräten gescannt und dekodiert werden können. Sie lässt sich in andere Geschäftssysteme integrieren und unterstützt mehrere Plattformen, was einen reibungslosen Datenaustausch ermöglicht und die allgemeine Betriebseffizienz verbessert. Barcode-Software wird in verschiedenen Branchen häufig für Zwecke wie Bestandsverwaltung, Produktverfolgung, Kassensysteme und Lieferkettenmanagement eingesetzt. Barcode-Software erleichtert das Erstellen, Drucken und Verwalten von Barcodes für verschiedene Anwendungen, von der Bestandsverfolgung bis zur Produktkennzeichnung. Beliebte Optionen sind BarTender und ZebraDesigner, die Funktionen wie Etikettendesign, Systemintegration und Skalierbarkeit bieten. Die Software lässt sich problemlos in andere Geschäftssysteme integrieren und gewährleistet einen reibungslosen Datenaustausch zwischen Plattformen. Diese Integration steigert die allgemeine Betriebseffizienz durch Echtzeit-Updates, minimiert menschliche Fehler und gewährleistet eine präzise Bestandsverfolgung und -verwaltung.
Passen Sie diesen Bericht Ihren Anforderungen an
Sie erhalten kostenlos Anpassungen an jedem Bericht, einschließlich Teilen dieses Berichts oder einer Analyse auf Länderebene, eines Excel-Datenpakets sowie tolle Angebote und Rabatte für Start-ups und Universitäten.
Markt für Barcode-Software: Strategische Einblicke
-
Holen Sie sich die wichtigsten Markttrends aus diesem Bericht.Dieses KOSTENLOSE Beispiel umfasst Datenanalysen, die von Markttrends bis hin zu Schätzungen und Prognosen reichen.
Treiber und Chancen des Barcode-Software-Marktes
Wachstum des Einzelhandels- und E-Commerce-Sektors
Wie die International Trade Administration angibt, wird der globale B2B-E-Commerce-Markt bis 2026 voraussichtlich unglaubliche 36 Billionen US-Dollar erreichen, was die immense Größe und das Potenzial dieses Sektors unterstreicht. Ebenso gab das Census Bureau des Handelsministeriums im Februar 2025 die Schätzung der E-Commerce-Umsätze im US-Einzelhandel für das vierte Quartal 2024 bekannt. Im vierten Quartal 2024 machten die E-Commerce-Umsätze 16,4 % des gesamten Einzelhandelsumsatzes aus und beliefen sich auf 352,9 Milliarden US-Dollar, ein Anstieg von 22,1 % gegenüber dem dritten Quartal 2024. Im Vergleich zum vierten Quartal 2023 stiegen die E-Commerce-Umsätze um 9,3 %, während die gesamten Einzelhandelsumsätze um 4,5 % zunahmen. Für das gesamte Jahr 2024 erreichten die gesamten E-Commerce-Umsätze schätzungsweise 1.192,6 Milliarden US-Dollar, was einem Wachstum von 8,1 % gegenüber 2023 entspricht. Das schnelle Wachstum des Einzelhandels- und E-Commerce-Sektors weltweit erhöht den Bedarf an effizienten Bestands- und Lieferkettenmanagementsystemen. Barcode-Software ermöglicht es Unternehmen, die Lagerverwaltung zu verbessern, Produktbewegungen in Echtzeit zu verfolgen und einen besseren Kundenservice anzubieten. Mit dem Wachstum des E-Commerce wird der Bedarf an Barcode-Scan- und Tracking-Software für eine präzise Auftragsabwicklung immer wichtiger. Daher treibt der wachsende Einzelhandels- und E-Commerce-Sektor den Markt für Barcode-Software an.
Zunehmende Nutzung KI-gestützter Barcode-Lesegeräte
Der Markt für Barcode-Software erlebt ein starkes Wachstum, angetrieben durch technologische Fortschritte und eine steigende Nachfrage nach Automatisierung und Effizienz in verschiedenen Fertigungssektoren. Die Einführung dieser fortschrittlichen Barcode-Lesegeräte signalisiert einen wachsenden Trend zur Nutzung KI-gestützter Lösungen im Barcode-Softwaremarkt. So trieb beispielsweise die Cognex Corporation, ein weltweit führendes Unternehmen im Bereich der industriellen Bildverarbeitung, im Januar 2025 die Innovation in diesem Bereich mit der Einführung ihrer neuesten Angebote, den Barcode-Lesegeräten DataMan 290 und 390, weiter voran. Diese neuen Produkte nutzen modernste KI-Technologie, um eine beispiellose Dekodiergenauigkeit und -zuverlässigkeit zu bieten und sind damit ein unverzichtbares Werkzeug zur Steigerung der betrieblichen Produktivität. Die Einführung dieser fortschrittlichen Lesegeräte bewältigt nicht nur komplexe Herausforderungen beim Barcode-Scannen, sondern eröffnet auch zahlreiche Möglichkeiten auf dem sich entwickelnden Markt für Barcode-Software. Die Barcode-Lesegeräte DataMan 290 und 390 von Cognex stellen einen bedeutenden Fortschritt in der industriellen Scan-Technologie dar. Angetrieben von fortschrittlicher KI gewährleisten diese Lesegeräte eine leistungsstarke Dekodierung für eine Vielzahl von Barcode-Typen und in verschiedenen Fertigungsumgebungen. Durch die Integration von KI können die Geräte lernen und sich an unterschiedliche Scanbedingungen anpassen, wodurch Genauigkeit und Geschwindigkeit in Echtzeit verbessert werden, selbst unter schwierigen Bedingungen wie geringem Kontrast, beschädigten oder schlecht gedruckten Barcodes. Diese Innovation bietet Herstellern eine vielseitige Lösung, die die Effizienz steigert und Ausfallzeiten minimiert.
Segmentierungsanalyse des Marktberichts für Barcode-Software
Schlüsselsegmente, die zur Ableitung der Marktanalyse für Barcode-Software beigetragen haben, sind Bereitstellung, Barcode-Typ, Anwendung und Endverbraucherbranche.
- In Bezug auf die Bereitstellung ist der Markt für Barcode-Software in On-Premise und Cloud unterteilt. Das Cloud-Segment dominierte den Markt im Jahr 2024.
- Basierend auf dem Barcode-Typ ist der Markt in 1D-Barcodes und 2D-Barcodes segmentiert. Das Segment der 1D-Barcodes dominierte den Markt im Jahr 2024.
- In Bezug auf die Anwendung ist der Markt in Bestandsverwaltung, Point-of-Sale (POS)-Betrieb, Anlagenverwaltung, Mitarbeiteranwesenheit und Zeiterfassung und andere segmentiert. Das Segment Bestandsverwaltung dominierte den Markt im Jahr 2024.
- Basierend auf der Endverbraucherbranche ist der Markt für Barcode-Software in BFSI, Transport und Logistik, Fertigung, Gesundheitswesen, Einzelhandel und E-Commerce und andere unterteilt. Das Segment Einzelhandel und E-Commerce dominierte den Markt im Jahr 2024.
Marktanteilsanalyse für Barcode-Software nach Geografie
- Der Markt für Barcode-Software ist in fünf große Regionen unterteilt: Nordamerika, Europa, Asien-Pazifik (APAC), Naher Osten und Afrika (MEA) sowie Süd- und Mittelamerika. Nordamerika dominierte den Markt im Jahr 2024, gefolgt von Europa und dem Asien-Pazifik-Raum.
- Nordamerika nimmt aufgrund der frühen Einführung modernster Technologien, der starken Präsenz wichtiger Marktteilnehmer und der Nachfrage nach Automatisierung in Logistik, Einzelhandel und Bestandsverwaltung eine beherrschende Stellung auf dem globalen Markt für Barcode-Software ein. Die Region verfügt über eine gut ausgebaute Infrastruktur sowie Investitionen in intelligente Fertigung und E-Commerce. Darüber hinaus sind die USA laut The Enterprise World Spitzenreiter bei der weltweiten Nutzung von QR-Codes: Im Jahr 2022 waren sie für 42,2 % der weltweiten Scans verantwortlich, wobei dieser Anteil bis 2023 auf 43,9 % steigen soll.
- In Europa wächst der Markt für Barcode-Software stetig, angetrieben von der starken Produktionsbasis der Region, insbesondere in Branchen wie der Automobilindustrie, Unterhaltungselektronik und Pharmaindustrie. Die Nutzung von Barcode-Lösungen für Bestandsverwaltung, Lieferkettenoptimierung und Einhaltung gesetzlicher Vorschriften nimmt in der Region deutlich zu. Darüber hinaus steigern der zunehmende Trend zu Industrie 4.0 und die Digitalisierung der europäischen Fertigung die Nachfrage nach Barcode-Softwarelösungen.
- Im asiatisch-pazifischen Raum wird das höchste Wachstum des Barcode-Softwaremarktes erwartet. Dieser Anstieg wird durch die schnelle Industrialisierung in Schwellenländern wie China und Indien vorangetrieben, wo Barcode-Software zunehmend im Einzelhandel, der Logistik und der Fertigung eingesetzt wird. Der Fokus auf Automatisierung, intelligente Logistik und die Entwicklung von E-Commerce-Plattformen nimmt in der Region stetig zu. Darüber hinaus wächst die Nachfrage nach Barcode-basierten Lösungen in der Lebensmittel- und Getränkebranche, im Einzelhandel und im Gesundheitswesen. Laut VISA nutzten im Jahr 2022 93 % der Verbraucher in Südostasien verschiedene bargeldlose Zahlungsmethoden, darunter auch QR-Codes für Transaktionen. Die Nachfrage nach effizienten digitalen Zahlungslösungen steigt in der Region und treibt den technologischen Fortschritt und die Marktexpansion voran.
Umfang des Berichts zum Markt für Barcode-Software
Neuigkeiten und aktuelle Entwicklungen zum Markt für Barcode-Software
Der Markt für Barcode-Software wird durch die Erhebung qualitativer und quantitativer Daten nach Primär- und Sekundärforschung bewertet, die wichtige Unternehmenspublikationen, Verbandsdaten und Datenbanken umfasst. Einige der Entwicklungen auf dem Markt für Barcode-Software sind nachfolgend aufgeführt:
- Honeywell (Nasdaq: HON) gab bekannt, dass seine Barcode-Dekodierungssoftware SwiftDecoder in die selbstfliegenden Inventardrohnen von Corvus Robotics integriert wird. Diese bahnbrechende Lösung wird in Lagern und Distributionszentren (DCs) eingesetzt, um Einzelhändlern, Händlern und Herstellern die Verfolgung schnell wechselnder Lagerbestände auf Kisten- und Palettenebene schneller und genauer zu machen.
(Quelle: Honeywell, Pressemitteilung, März 2025)
- Revenova hat jetzt die TEC-IT Barcode-API in sein Transportmanagementsystem (TMS) integriert. Mit einem TEC-IT-Abonnement können sie den Online-Barcode-Generator nutzen, der die einfache Erstellung von Barcodes ohne zusätzliche Programmierung ermöglicht. Diese Funktion vereinfacht das Logistikmanagement und die Bestandsverfolgung.
(Quelle: TEC-IT Datenverarbeitung GmbH, Pressemitteilung, November 2024)
Bericht zum Markt für Barcode-Software: Umfang und Ergebnisse
Der Bericht „Marktgröße und -prognose für Barcode-Software (2021–2031)“ bietet eine detaillierte Analyse des Marktes in den unten genannten Bereichen:
- Marktgröße und -prognose für Barcode-Software auf globaler, regionaler und Länderebene für alle abgedeckten wichtigen Marktsegmente
- Markttrends für Barcode-Software sowie Marktdynamiken wie Treiber, Einschränkungen und wichtige Chancen
- Detaillierte PEST- und SWOT-Analyse
- Marktanalyse für Barcode-Software mit wichtigen Markttrends, globalen und regionalen Rahmenbedingungen, wichtigen Akteuren, Vorschriften und aktuellen Marktentwicklungen
- Branchenlandschaft und Wettbewerbsanalyse mit Marktkonzentration, Heatmap-Analyse, prominenten Akteuren und aktuellen Entwicklungen für die Barcode-Software Markt
- Detaillierte Unternehmensprofile
Regionale Einblicke in den Barcode-Softwaremarkt
Die Analysten von The Insight Partners haben die regionalen Trends und Faktoren, die den Barcode-Software-Markt im Prognosezeitraum beeinflussen, ausführlich erläutert. In diesem Abschnitt werden auch die Marktsegmente und die geografische Lage in Nordamerika, Europa, dem asiatisch-pazifischen Raum, dem Nahen Osten und Afrika sowie Süd- und Mittelamerika erörtert.
Umfang des Marktberichts zu Barcode-Software
| Berichtsattribut | Einzelheiten |
|---|---|
| Marktgröße in 2024 | US$ 881.03 Million |
| Marktgröße nach 2031 | US$ 1,378.29 Million |
| Globale CAGR (2025 - 2031) | 6.8% |
| Historische Daten | 2021-2023 |
| Prognosezeitraum | 2025-2031 |
| Abgedeckte Segmente |
By Barcode-Typ
|
| Abgedeckte Regionen und Länder |
Nordamerika
|
| Marktführer und wichtige Unternehmensprofile |
|
Dichte der Marktteilnehmer für Barcode-Software: Auswirkungen auf die Geschäftsdynamik verstehen
Der Markt für Barcode-Software wächst rasant. Die steigende Nachfrage der Endnutzer ist auf Faktoren wie veränderte Verbraucherpräferenzen, technologische Fortschritte und ein stärkeres Bewusstsein für die Produktvorteile zurückzuführen. Mit der steigenden Nachfrage erweitern Unternehmen ihr Angebot, entwickeln Innovationen, um den Bedürfnissen der Verbraucher gerecht zu werden, und nutzen neue Trends, was das Marktwachstum weiter ankurbelt.
- Holen Sie sich die Markt für Barcode-Software Übersicht der wichtigsten Akteure

Ankita ist eine dynamische Marktforschungs- und Beratungsexpertin mit über 8 Jahren Erfahrung in den Bereichen Technologie, Medien, IKT sowie Elektronik und Halbleiter. Sie hat über 100 Beratungs- und Forschungsaufträge für globale Kunden wie Microsoft, Oracle, NEC Corporation, SAP, KPMG und Expeditors International erfolgreich geleitet und durchgeführt. Zu ihren Kernkompetenzen gehören Marktbewertung, Datenanalyse, Prognose, Strategieformulierung, Wettbewerbsbeobachtung und das Verfassen von Berichten. Ankita ist versiert in der Abwicklung kompletter Projektzyklen – von der Angebotserstellung vor dem Verkauf und Kundengesprächen bis hin zur Bereitstellung umsetzbarer Erkenntnisse nach dem Verkauf. Sie ist versiert in der Leitung funktionsübergreifender Teams, der Strukturierung komplexer Forschungsmodule und der Ausrichtung von Lösungen an kundenspezifischen Geschäftszielen. Ihre ausgezeichneten Kommunikationsfähigkeiten, Führungsqualitäten und Präsentationsfähigkeiten haben es ihr ermöglicht, in einem schnelllebigen und sich entwickelnden Marktumfeld stets wertorientierte Ergebnisse zu liefern.
- Historische Analyse (2 Jahre), Basisjahr, Prognose (7 Jahre) mit CAGR
- PEST- und SWOT-Analyse
- Marktgröße Wert/Volumen – Global, Regional, Land
- Branchen- und Wettbewerbslandschaft
- Excel-Datensatz
Erfahrungsberichte
Der SCADA-Systemmarktbericht von Insight Partners ist umfassend und bietet wertvolle Einblicke in aktuelle Trends und Zukunftsprognosen. Das Team war durchweg hochprofessionell, reaktionsschnell und hilfsbereit. Wir sind sehr zufrieden und können die Dienstleistungen wärmstens empfehlen.
RAN KEDEM Partner, Reali Technologies LTDsIch habe einen Bericht über einen sehr spezifischen Softwaremarkt angefordert, und das Team hat ihn innerhalb weniger Tage erstellt. Die Informationen waren sehr relevant und gut präsentiert. Anschließend habe ich einige Änderungen und Ergänzungen zum Bericht angefordert. Das Team reagierte erneut sehr schnell, und ich erhielt den Abschlussbericht in weniger als einer Woche.
JEAN-HERVE JENN Vorsitzende, Future AnalyticaWir haben mit The Insight Partners für eine wichtige Marktstudie und Prognose zusammengearbeitet. Sie gaben uns klare Einblicke in Chancen und Risiken, die uns bei der Gestaltung unserer Pläne halfen. Ihre Recherchen waren benutzerfreundlich und basierten auf soliden Daten. Sie halfen uns, kluge und sichere Entscheidungen zu treffen. Wir können sie wärmstens empfehlen.
PIYUSH NAGPAL Sr. Vizepräsident, Fernlicht GlobalDie Insight Partners lieferten aufschlussreiche, gut strukturierte Marktforschung mit fundierter Fachkompetenz. Ihr Team war durchweg professionell und reaktionsschnell. Die benutzerfreundliche Website ermöglichte den Zugriff auf Branchenberichte. Wir empfehlen sie wärmstens für zuverlässige und hochwertige Forschungsdienstleistungen.
YUKIHIKO ADACHI Geschäftsführer, Deep Blue, LLC.Dies ist das erste Mal, dass ich einen Marktbericht von The Insight Partners erworben habe. Obwohl ich zunächst unsicher war, besuchte ich die Website und fühlte mich dann sicherer, das Risiko einzugehen und einen Marktbericht zu kaufen. Ich bin mit der Qualität des Berichts und dem Kundenservice rundum zufrieden. Ich hatte einige Fragen und Anmerkungen zum ersten Bericht, aber nach einigen E-Mail-Gesprächen mit dem Analysten bin ich überzeugt, dass ich einen Bericht habe, den ich als Input für unseren strategischen Planungsprozess verwenden kann. Vielen Dank, dass Sie sich die Zeit genommen und dies zu einer positiven Erfahrung gemacht haben. Ich werde Ihren Service auf jeden Fall weiterempfehlen und Sie werden meine erste Anlaufstelle sein, wenn wir weitere Marktdaten benötigen.
JOHN SUZUKI Präsident und Chief Executive Officer, Vorstandsmitglied, BK TechnologiesIch möchte mich für Ihre Unterstützung und die Professionalität bedanken, die Sie bei der Bearbeitung meiner Informationsanfrage zum IVD-Markt für Infektionskrankheiten in Nigeria gezeigt haben. Ich schätze Ihre Geduld, Ihre Beratung und die Tatsache, dass Sie bereit waren, einen Rabatt anzubieten, der uns schließlich den Abschluss eines Geschäfts ermöglichte. Ich freue mich darauf, The Insight Partners in Zukunft wieder zu beauftragen, dank des Eindrucks, den Sie bei dieser ersten Begegnung bei mir hinterlassen haben.
DR. CHIJIOKE ONYIA GESCHÄFTSFÜHRERIN, PineCrest Healthcare Ltd.Grund zum Kauf
- Fundierte Entscheidungsfindung
- Marktdynamik verstehen
- Wettbewerbsanalyse
- Kundeneinblicke
- Marktprognosen
- Risikominimierung
- Strategische Planung
- Investitionsbegründung
- Identifizierung neuer Märkte
- Verbesserung von Marketingstrategien
- Steigerung der Betriebseffizienz
- Anpassung an regulatorische Trends


Exklusive Berichtsrabatte freischalten
Jetzt anfragen


 Kostenlose Probe anfordern für - Markt für Barcode-Software