Análisis y pronóstico del mercado de software de código de barras por tamaño, participación, crecimiento y tendencias para 2031
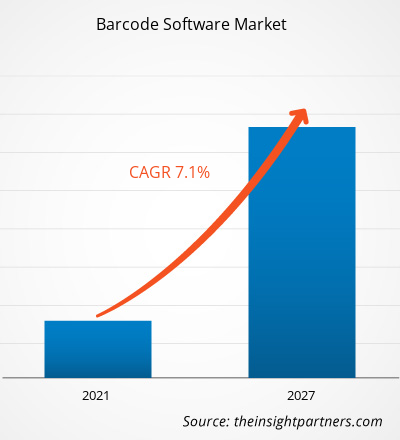
Datos históricos : 2021-2023 | Año base : 2024 | Período de pronóstico : 2025-2031Análisis y pronósticos del mercado de software de códigos de barras por tamaño, participación, crecimiento y tendencias para 2027
- Estado : Publicada
- Código de informe : TIPRE00003636
- Categoría : Tecnología, medios y telecomunicaciones
- Número de páginas : 255
- Formatos de informe disponibles :


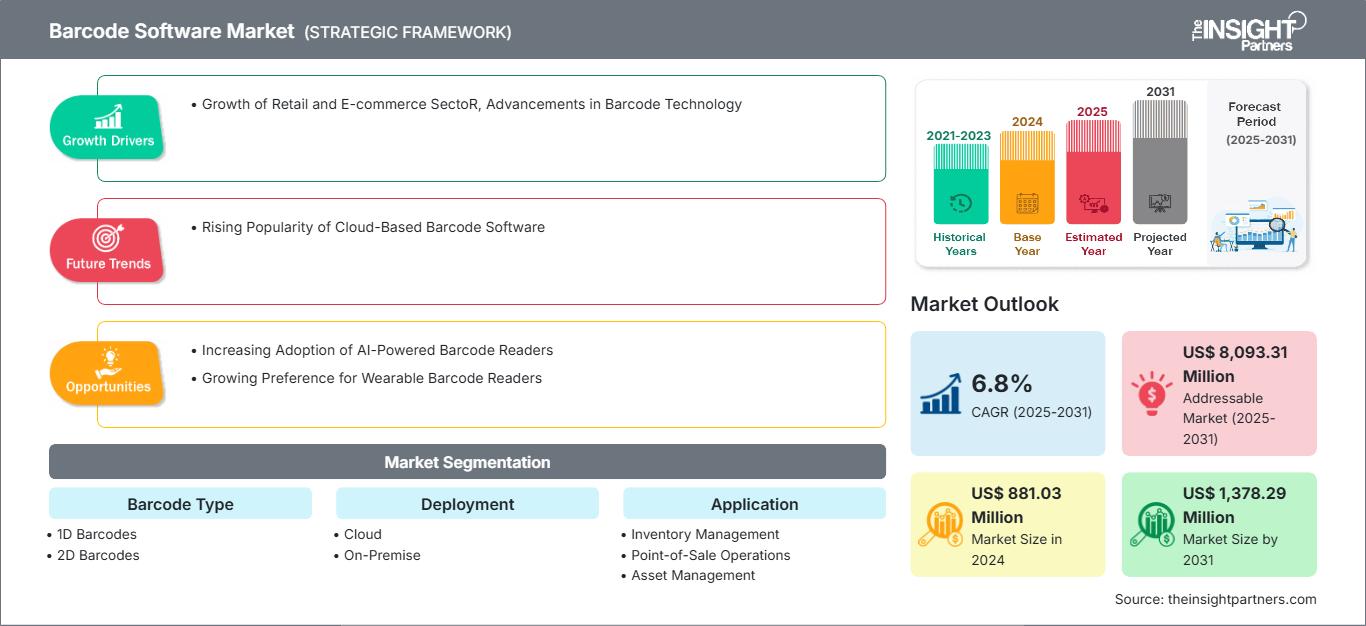
El mercado de software de códigos de barras se valoró en 881,03 millones de dólares estadounidenses en 2024 y se espera que alcance los 1.378,29 millones de dólares estadounidenses en 2031; se estima que el mercado registrará una tasa de crecimiento anual compuesta (TCAC) del 6,8 % entre 2025 y 2031. La creciente popularidad del software de códigos de barras basado en la nube probablemente sea una tendencia clave del mercado.
Análisis del mercado de software de códigos de barras
El software de códigos de barras es compatible con diversas plataformas, como sistemas de escritorio, dispositivos móviles y entornos en la nube, lo que lo hace adaptable y versátil para las necesidades específicas de distintas organizaciones. Factores como el crecimiento del sector minorista y del comercio electrónico, junto con los avances en la tecnología de códigos de barras, impulsan el mercado de este software. Se prevé que el mercado crezca durante el período de pronóstico debido a la creciente adopción de lectores de códigos de barras con inteligencia artificial y a la preferencia cada vez mayor por los lectores de códigos de barras portátiles. La creciente popularidad del software de códigos de barras basado en la nube se perfila como una tendencia clave en este mercado. Sin embargo, la dependencia de los escáneres podría frenar su crecimiento.
Panorama del mercado de software de códigos de barras
El software de códigos de barras comprende aplicaciones desarrolladas específicamente para crear, imprimir y gestionar códigos de barras. Un código de barras es un código legible por máquina que consiste en barras o líneas paralelas de diferentes grosores que representan datos. Este software permite a los usuarios generar imágenes o etiquetas de códigos de barras, que pueden escanearse y decodificarse mediante lectores de códigos de barras o dispositivos móviles. Se integra con otros sistemas empresariales y es compatible con múltiples plataformas, lo que facilita un intercambio de datos fluido y mejora la eficiencia operativa general. El software de códigos de barras se utiliza ampliamente en diversos sectores para fines como la gestión de inventario, el seguimiento de productos, los sistemas de punto de venta y la gestión de la cadena de suministro. Este software facilita la creación, impresión y gestión de códigos de barras para diversas aplicaciones, desde el seguimiento de inventario hasta el etiquetado de productos. Entre las opciones más populares se encuentran BarTender y ZebraDesigner, que ofrecen funciones como el diseño de etiquetas, la integración con sistemas y la escalabilidad. El software se integra fácilmente con otros sistemas empresariales, lo que garantiza un intercambio de datos fluido entre plataformas. Esta integración mejora la eficiencia operativa general al permitir actualizaciones en tiempo real, minimizar el error humano y garantizar la precisión en el seguimiento y la gestión del inventario.
Obtendrá personalización gratuita de cualquier informe, incluyendo partes de este informe, análisis a nivel de país y paquetes de datos de Excel. Además, podrá aprovechar excelentes ofertas y descuentos para empresas emergentes y universidades.
Mercado de software de códigos de barras: Perspectivas estratégicas
-
Obtenga las principales tendencias clave del mercado que se describen en este informe.Esta muestra GRATUITA incluirá análisis de datos, que abarcarán desde tendencias de mercado hasta estimaciones y pronósticos.
Factores impulsores y oportunidades del mercado de software de códigos de barras
Crecimiento del sector minorista y de comercio electrónico
Según la Administración de Comercio Internacional, se prevé que para 2026 el mercado global de comercio electrónico B2B alcance la asombrosa cifra de 36 billones de dólares estadounidenses, lo que pone de manifiesto la inmensa magnitud y el potencial de este sector. Asimismo, en febrero de 2025, la Oficina del Censo del Departamento de Comercio anunció la estimación de las ventas minoristas de comercio electrónico en Estados Unidos para el cuarto trimestre de 2024. En dicho trimestre, las ventas de comercio electrónico representaron el 16,4 % del total de las ventas minoristas, alcanzando los 352 900 millones de dólares estadounidenses, lo que supone un aumento del 22,1 % con respecto al tercer trimestre de 2024. En comparación con el cuarto trimestre de 2023, las ventas de comercio electrónico crecieron un 9,3 %, mientras que las ventas minoristas totales experimentaron un aumento del 4,5 %. Durante todo el año 2024, las ventas totales de comercio electrónico alcanzaron un estimado de US$ 1.192,6 mil millones, lo que representa un crecimiento del 8,1% con respecto a 2023. El rápido crecimiento de los sectores minorista y de comercio electrónico a nivel mundial impulsa la necesidad de sistemas eficientes de gestión de inventario y cadena de suministro. El software de códigos de barras permite a las empresas mejorar la gestión de existencias, rastrear el movimiento de productos en tiempo real y ofrecer un mejor servicio al cliente. A medida que crece el comercio electrónico, la necesidad de software de escaneo y seguimiento de códigos de barras se vuelve aún más crucial para garantizar la precisión en el cumplimiento de los pedidos. Por lo tanto, el creciente sector minorista y de comercio electrónico impulsa el mercado de software de códigos de barras.
Adopción creciente de lectores de códigos de barras con inteligencia artificial
El mercado de software para códigos de barras está experimentando un crecimiento significativo, impulsado por los avances tecnológicos y la creciente demanda de automatización y eficiencia en diversos sectores manufactureros. La introducción de estos lectores de códigos de barras avanzados refleja una tendencia creciente hacia la adopción de soluciones basadas en inteligencia artificial (IA) en este mercado. Por ejemplo, en enero de 2025, Cognex Corporation, líder mundial en visión artificial industrial, continuó impulsando la innovación con el lanzamiento de sus nuevos productos: los lectores de códigos de barras DataMan 290 y 390. Estos nuevos productos aprovechan tecnología de IA de vanguardia para ofrecer una precisión y fiabilidad de decodificación inigualables, convirtiéndose en una herramienta esencial para mejorar la productividad operativa. La introducción de estos lectores avanzados no solo resuelve los complejos desafíos del escaneo de códigos de barras, sino que también abre numerosas oportunidades en el mercado de software para códigos de barras, que se encuentra en constante evolución. Los lectores de códigos de barras DataMan 290 y 390 de Cognex representan un importante avance en la tecnología de escaneo industrial. Gracias a la IA avanzada, estos lectores garantizan una decodificación de alto rendimiento en una amplia gama de tipos de códigos de barras y entornos de fabricación. La integración de la IA permite que los dispositivos aprendan y se adapten a diferentes condiciones de escaneo, mejorando la precisión y la velocidad en tiempo real, incluso en condiciones difíciles, como códigos de barras con bajo contraste, dañados o mal impresos. Esta innovación proporciona a los fabricantes una solución versátil que aumenta la eficiencia y minimiza el tiempo de inactividad.
Análisis de segmentación del informe de mercado de software de códigos de barras
Los segmentos clave que contribuyeron a la elaboración del análisis del mercado de software de códigos de barras son la implementación, el tipo de código de barras, la aplicación y la industria de uso final.
- En cuanto a la implementación, el mercado de software de códigos de barras se divide en soluciones locales y en la nube. El segmento de la nube dominó el mercado en 2024.
- Según el tipo de código de barras, el mercado se divide en códigos de barras 1D y códigos de barras 2D. El segmento de códigos de barras 1D dominó el mercado en 2024.
- En cuanto a su aplicación, el mercado se segmenta en gestión de inventarios, sistemas de punto de venta (TPV), gestión de activos, control de asistencia y registro horario de empleados, entre otros. El segmento de gestión de inventarios dominó el mercado en 2024.
- Según el sector de uso final, el mercado de software de códigos de barras se divide en banca, servicios financieros y seguros (BFSI), transporte y logística, manufactura, salud, comercio minorista y electrónico, entre otros. El segmento de comercio minorista y electrónico dominó el mercado en 2024.
Análisis de la cuota de mercado del software de códigos de barras por geografía
- El mercado de software de códigos de barras se divide en cinco regiones principales: Norteamérica, Europa, Asia Pacífico (APAC), Oriente Medio y África (MEA) y Sudamérica y Centroamérica. Norteamérica dominó el mercado en 2024, seguida de Europa y Asia Pacífico.
- América del Norte ostenta una posición dominante en el mercado global de software de códigos de barras, gracias a la pronta adopción de tecnologías de vanguardia, la sólida presencia de actores clave del mercado y la demanda de automatización en logística, comercio minorista y gestión de inventarios. La región cuenta con una infraestructura consolidada, además de inversiones en fabricación inteligente y comercio electrónico. Asimismo, según The Enterprise World, Estados Unidos lidera el uso global de códigos QR, representando el 42,2 % de los escaneos mundiales en 2022, cifra que ascenderá al 43,9 % en 2023.
- En Europa, el mercado de software de códigos de barras se expande de forma constante, impulsado por la sólida base manufacturera de la región, especialmente en sectores como la automoción, la electrónica de consumo y la farmacéutica. La adopción de soluciones de códigos de barras para la gestión de inventarios, la optimización de la cadena de suministro y el cumplimiento normativo está creciendo significativamente en la región. Además, la creciente tendencia hacia la Industria 4.0 y la digitalización de la producción europea están impulsando la demanda de software de códigos de barras.
- Se prevé que la región de Asia Pacífico experimente el mayor crecimiento en el mercado de software de códigos de barras. Este auge se debe a la rápida industrialización de economías emergentes como China e India, donde el software de códigos de barras se está adoptando cada vez más en los sectores de comercio minorista, logística y manufactura. El enfoque en la automatización, la logística inteligente y el desarrollo de plataformas de comercio electrónico está creciendo de forma constante en la región. Además, la demanda de soluciones basadas en códigos de barras en los sectores de alimentos y bebidas, comercio minorista y salud está en aumento. Asimismo, según VISA, en 2022, el 93 % de los consumidores del Sudeste Asiático utilizó diversos métodos de pago sin efectivo, incluidos los códigos QR para realizar transacciones. La demanda de soluciones de pago digitales eficientes está creciendo en la región, impulsando los avances tecnológicos y la expansión del mercado.
Perspectivas regionales del mercado de software de códigos de barras
Los analistas de The Insight Partners han explicado en detalle las tendencias regionales y los factores que influyen en el mercado de software de códigos de barras durante el período de previsión. Esta sección también analiza los segmentos y la geografía del mercado de software de códigos de barras en Norteamérica, Europa, Asia Pacífico, Oriente Medio y África, y Sudamérica y Centroamérica.
Alcance del informe de mercado de software de códigos de barras
| Atributo del informe | Detalles |
|---|---|
| Tamaño del mercado en 2024 | US$ 881,03 millones |
| Tamaño del mercado para 2031 | US$ 1.378,29 millones |
| Tasa de crecimiento anual compuesto global (2025 - 2031) | 6,8% |
| Datos históricos | 2021-2023 |
| período de previsión | 2025-2031 |
| Segmentos cubiertos |
Por tipo de código de barras
|
| Regiones y países cubiertos |
América del norte
|
| Líderes del mercado y perfiles de empresas clave |
|
Densidad de los actores del mercado de software de códigos de barras: comprensión de su impacto en la dinámica empresarial
El mercado de software de códigos de barras está creciendo rápidamente, impulsado por la creciente demanda de los usuarios finales debido a factores como la evolución de las preferencias de los consumidores, los avances tecnológicos y una mayor conciencia de los beneficios del producto. A medida que aumenta la demanda, las empresas amplían su oferta, innovan para satisfacer las necesidades de los consumidores y aprovechan las nuevas tendencias, lo que impulsa aún más el crecimiento del mercado.
- Obtenga una visión general de los principales actores del mercado de software de códigos de barras.
Noticias y novedades del mercado de software de códigos de barras
El mercado de software de códigos de barras se evalúa mediante la recopilación de datos cualitativos y cuantitativos tras una investigación primaria y secundaria, que incluye publicaciones corporativas importantes, datos de asociaciones y bases de datos. A continuación se enumeran algunos de los avances en el mercado de software de códigos de barras:
- Honeywell (Nasdaq: HON) anunció que su software de decodificación de códigos de barras SwiftDecoder se integrará en los drones autónomos de inventario de Corvus Robotics. Esta innovadora solución se utilizará en almacenes y centros de distribución para agilizar y mejorar la precisión del seguimiento del inventario, que cambia rápidamente, para minoristas, distribuidores y fabricantes, tanto a nivel de caja como de palé.
(Fuente: Honeywell, comunicado de prensa, marzo de 2025)
- Revenova ahora integra la API de códigos de barras de TEC-IT en su Sistema de Gestión de Transporte (TMS). Con una suscripción a TEC-IT, pueden usar el Generador de Códigos de Barras en línea, que permite crear códigos de barras fácilmente sin necesidad de programación adicional. Esta función simplifica la gestión logística y el seguimiento del inventario.
(Fuente: TEC-IT Datenverarbeitung GmbH, comunicado de prensa, noviembre de 2024)
Cobertura y resultados del informe de mercado de software de códigos de barras
El informe "Tamaño y pronóstico del mercado de software de códigos de barras (2021-2031)" proporciona un análisis detallado del mercado que abarca las áreas mencionadas a continuación:
- Tamaño y pronóstico del mercado de software de códigos de barras a nivel mundial, regional y nacional para todos los segmentos clave del mercado cubiertos por el alcance.
- Tendencias del mercado de software de códigos de barras, así como la dinámica del mercado, como los impulsores, las restricciones y las oportunidades clave.
- Análisis detallado de PEST y SWOT
- Análisis del mercado de software de códigos de barras que abarca las principales tendencias del mercado, el marco global y regional, los principales actores, las regulaciones y los desarrollos recientes del mercado.
- Análisis del panorama industrial y la competencia, incluyendo la concentración del mercado, el análisis de mapas de calor, los principales actores y los desarrollos recientes del mercado de software de códigos de barras.
- Perfiles detallados de las empresas

Ankita es una profesional dinámica en investigación de mercados y consultoría con más de 8 años de experiencia en los sectores de tecnología, medios de comunicación, TIC, electrónica y semiconductores. Ha liderado y ejecutado con éxito más de 100 proyectos de consultoría e investigación para clientes globales como Microsoft, Oracle, NEC Corporation, SAP, KPMG y Expeditors International. Sus principales competencias incluyen la evaluación de mercado, el análisis de datos, la previsión, la formulación de estrategias, la inteligencia competitiva y la redacción de informes.
Ankita es experta en la gestión de ciclos completos de proyecto, desde el diseño de propuestas de preventa y las conversaciones con los clientes hasta la entrega de información práctica posventa. Es experta en la gestión de equipos multifuncionales, la estructuración de módulos de investigación complejos y la alineación de soluciones con los objetivos de negocio específicos del cliente. Sus excelentes habilidades de comunicación, liderazgo y presentación le han permitido obtener constantemente resultados orientados al valor en entornos de mercado dinámicos y en constante evolución.
- Análisis histórico (2 años), año base, pronóstico (7 años) con CAGR
- Análisis PEST y FODA
- Tamaño del mercado, valor/volumen: global, regional y nacional
- Industria y panorama competitivo
- Conjunto de datos de Excel
Testimonios
El informe de mercado de sistemas SCADA de Insight Partners es completo y ofrece información valiosa sobre las tendencias actuales y las previsiones futuras. El equipo fue altamente profesional, receptivo y me brindó un gran apoyo en todo momento. Estamos muy satisfechos y recomendamos ampliamente sus servicios.
RAN KEDEM Socio, Reali Technologies LTDsSolicité un informe sobre un mercado de software muy específico y el equipo lo elaboró en pocos días. La información era muy relevante y estaba bien presentada. Posteriormente, solicité algunos cambios y adiciones al informe. El equipo fue muy receptivo y recibí el informe final en menos de una semana.
JEAN-HERVE JENN Presidente, Future AnalyticaTrabajamos con The Insight Partners para un importante estudio y pronóstico de mercado. Nos brindaron una visión clara de las oportunidades y los riesgos, lo que nos ayudó a definir nuestros planes. Su investigación fue fácil de usar y se basó en datos sólidos. Nos ayudó a tomar decisiones inteligentes y seguras. Los recomendamos ampliamente.
PIYUSH NAGPAL Vicepresidente Sénior, , High Beam GlobalThe Insight Partners realizó una investigación de mercado profunda y bien estructurada con una sólida experiencia en el sector. Su equipo fue profesional y receptivo en todo momento. El sitio web, fácil de usar, facilitó el acceso a los informes del sector. Los recomendamos ampliamente por sus servicios de investigación confiables y de alta calidad.
YUKIHIKO ADACHI Director Ejecutivo, , Deep Blue, LLCEsta es la primera vez que compro un informe de mercado de The Insight Partners. Aunque al principio tenía dudas, visité su sitio web y me sentí más cómodo al arriesgarme y comprarlo. Estoy completamente satisfecho con la calidad del informe y el servicio al cliente. Tenía varias preguntas y comentarios sobre el informe inicial, pero después de un par de conversaciones por correo electrónico con su analista, creo que tengo un informe que puedo usar como base para nuestro proceso de planificación estratégica. Muchas gracias por tomarse el tiempo y hacer de esta una experiencia positiva. Sin duda, recomendaré sus servicios y serán mi primera opción cuando necesitemos más datos de mercado.
JOHN SUZUKI Presidente y Director Ejecutivo, Director de la Junta Directiva, BK TechnologiesAgradezco su apoyo y la profesionalidad que demostraron al atender mi solicitud de información sobre el mercado de diagnóstico in vitro (IVD) para enfermedades infecciosas en Nigeria. Agradezco su paciencia, su orientación y su disposición a ofrecerme un descuento, lo que finalmente nos permitió cerrar un trato. Espero poder colaborar con The Insight Partners en el futuro, gracias a la impresión que me causó este primer encuentro.
DRA. CHIJIOKE ONYIA, DIRECTORA GENERAL, PineCrest Healthcare Ltd.Razón para comprar
- Toma de decisiones informada
- Comprensión de la dinámica del mercado
- Análisis competitivo
- Información sobre clientes
- Pronósticos del mercado
- Mitigación de riesgos
- Planificación estratégica
- Justificación de la inversión
- Identificación de mercados emergentes
- Mejora de las estrategias de marketing
- Impulso de la eficiencia operativa
- Alineación con las tendencias regulatorias


Desbloquea descuentos exclusivos en informes
Consultar ahora


 Obtenga una muestra gratuita para - Mercado de software de códigos de barras