ビジネスソフトウェアおよびサービス市場の動向、需要、成長予測(2034年まで)
過去データ : 2021-2024 | 基準年 : 2025 | 予測期間 : 2026-2034ビジネスソフトウェアおよびサービス市場規模と予測(2021年~2034年)、世界および地域別シェア、トレンド、成長機会分析レポートの対象範囲:ソフトウェア別(財務、営業・マーケティング、人事、サプライチェーン、その他)、導入形態別(クラウド、オンプレミス)、組織規模別(大企業、中小企業)、業界別(BFSI、ヘルスケア、IT・通信、製造、小売、運輸、その他)、地域別
- ステータス : 公開されたデータ
- レポートコード : TIPRE00025078
- カテゴリー : テクノロジー、メディア、通信
- ページ数 : 150
- 利用可能なレポート形式 :


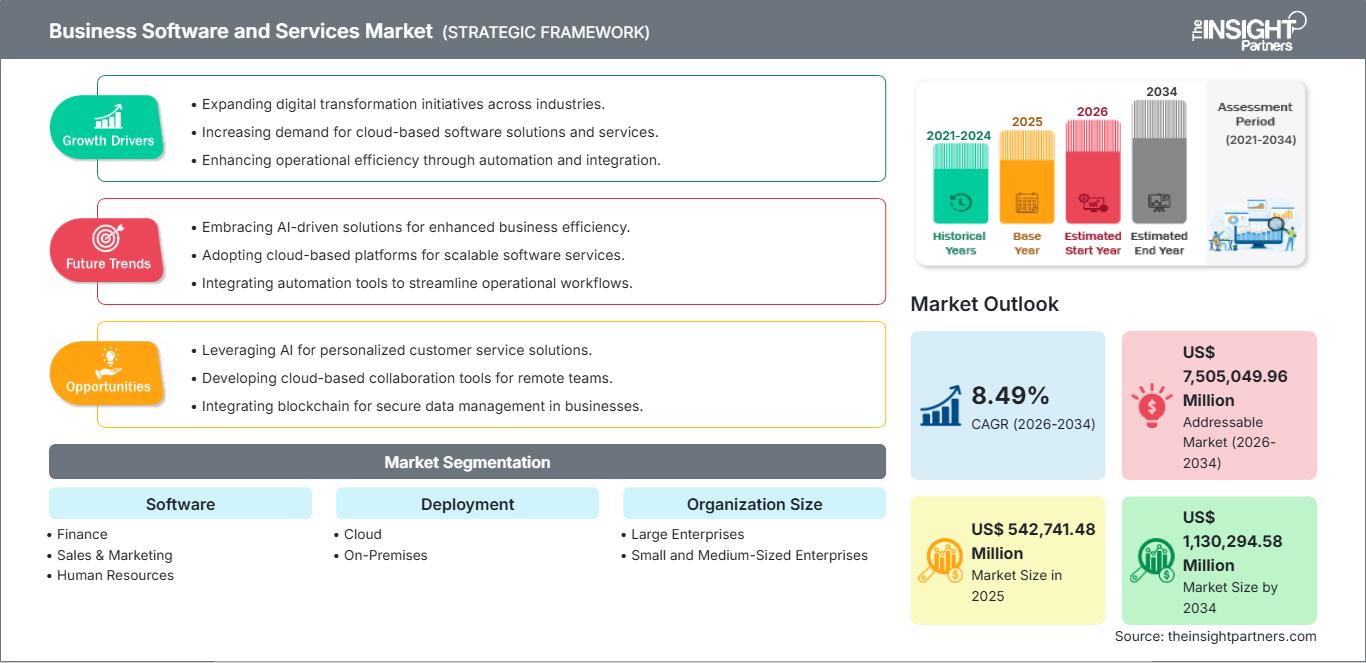
ビジネスソフトウェアおよびサービス市場規模は、2025年の5,427億4,148万米ドルから、2034年には1兆1,302億9,458万米ドルに達すると予測されています。同市場は、2026年から2034年の予測期間中に年平均成長率(CAGR)8.49%を記録すると見込まれています。
ビジネスソフトウェアおよびサービス市場分析
ビジネスソフトウェアおよびサービス市場は、近年、技術革新、業務におけるソフトウェアおよびシステムの導入拡大、そして企業のデジタルトランスフォーメーションの進展を背景に、著しい成長を遂げています。小売、製造、医療、運輸といったエンドユーザー産業における企業データ量の急速な増加と業務の自動化の進展は、ビジネスソフトウェアおよびサービスの需要を押し上げると予想されます。さらに、クラウドコンピューティングにおける技術開発と変化は、市場成長にとって魅力的な機会を提供しています。AIとMLの出現は、ビジネスソフトウェアおよびサービス市場の成長における重要なトレンドとして浮上しています。
ビジネスソフトウェアおよびサービス市場の概要
ビジネスソフトウェアとは、組織がさまざまな業務をより成功裏に、より安全に、より効率的に遂行できるよう支援するデジタルソリューションを指します。これらの業務には、顧客関係管理、プロジェクト調整、会計および給与管理などが含まれます。多くの業務活動を自動化する最良の方法は、ビジネスソフトウェアを活用することです。ビジネスソフトウェアは、あらゆる業務、特に反復的な業務を効率化し、収益性と生産性を向上させます。小規模な地元企業から国際的な大企業まで、あらゆる企業は競争力、正確性、効率性、安全性を維持するためにソフトウェアソリューションに依存しています。ビジネスソフトウェアは人手によるデータ入力の必要性を排除するため、大企業と中小企業の両方にとって不可欠です。ソフトウェアプログラムは、人為的ミスに伴うコストを削減します。データセキュリティ、ユーザーエクスペリエンス、統合の容易さ、コミュニケーション、分かりやすいユーザーインターフェース、更新の容易さは、ビジネスソフトウェアの重要な特性です。今日のデジタル時代において、企業は業務を効率化し、競争優位性を獲得するためにビジネスソフトウェアを活用しています。
市場調査のハイライト
- ビジネスソフトウェアおよびサービスの世界市場規模は、2025年には5,427億4,148万米ドルと評価された。
- 年間市場規模は2034年までに1兆1302億9458万米ドルに達すると予測されている。
- 2026年から2034年までの潜在市場規模(TAM)は、約7,505,049.96米ドルに達すると予測されています。
- 市場は予測期間中に年平均成長率(CAGR)8.49%を記録すると予想されている。
- 米国は重要な市場であり、業界全体にわたるデジタル変革イニシアチブの拡大、クラウドベースのソフトウェアソリューションとサービスに対する需要の増加、自動化と統合による業務効率の向上、そして進化する業界動向によって支えられています。
- 市場分析は、北米、ヨーロッパ、アジア太平洋、南米、中米、中東、アフリカを対象とし、予測期間全体にわたる成長を評価しています。
- AIを活用したパーソナライズされた顧客サービスソリューション、リモートチーム向けのクラウドベースのコラボレーションツールの開発、企業における安全なデータ管理のためのブロックチェーンの統合といった市場機会は、市場のダイナミクスと対象市場に影響を与えると予想されます。
- 本レポートでは、Acumatica, Inc.、Deltek, Inc.、Epicor Software Corporation、IBM Corporation、Infor.、NetSuite Inc.、Microsoft Corporation、SAP SE、Oracle Corporation、Wiproといった業界参加企業を紹介するとともに、競争戦略やイノベーションの動向を分析しています。
お客様のご要望に合わせてこのレポートをカスタマイズしてください
無料カスタマイズビジネスソフトウェアおよびサービス市場:戦略的洞察
-
本レポートの主要市場トレンドをご覧ください。この無料サンプルには、市場動向から予測、見通しまで、幅広いデータ分析が含まれています。
ビジネスソフトウェアおよびサービス市場の推進要因と機会
ビジネスソフトウェアおよびサービスの導入拡大が市場成長を促進する
ソフトウェアの導入は、さまざまな理由からあらゆる組織にとって不可欠です。企業は、ガイド付きフローフィールド検証などのソフトウェア導入ツールを使用することで、適切な業務プロセスを徹底できます。ビジネスソフトウェアツールは、ワークフローの自動化を可能にし、人的ミスのリスクを軽減し、確立されたガイドラインや規制への一貫した遵守を保証します。ビジネスソフトウェアを使用することで、組織は明確な監査証跡を確立し、アクティビティをリアルタイムで監視し、正確かつタイムリーなコンプライアンスレポートを生成できます。これにより、コンプライアンス管理が簡素化され、企業全体の透明性と説明責任が向上します。そのため、BFSI、小売、製造、ヘルスケアなど、幅広い業種で事業を展開するさまざまな企業が、ビジネスソフトウェアとサービスにますます注目しています。たとえば、Productivのデータによると、平均的な企業は約364個のSaaSアプリを使用しています。
同様に、最近のデジタル導入動向レポートによると、企業は2023年にSaaS製品に1,950億米ドルを費やすと予測されています。Aptyのブログによると、2031年までに組織の70%がデジタル導入プラットフォームを利用するようになるとのことです。このように、ビジネスソフトウェアおよびサービスの導入拡大が、ビジネスソフトウェアおよびサービス市場の成長を牽引しています。
企業におけるデジタルトランスフォーメーションの台頭 ― ビジネスソフトウェアおよびサービス市場におけるチャンス
組織は、急速に変化するダイナミックな市場で競争していくのに苦労しています。そのため、企業はデジタル変革を通じて、競争優位性を高め、業績を向上させ、事業成長を実現しようとしています。デジタル変革は、多くの組織にとって、激しくダイナミックな市場競争で競争優位性を獲得するための新たなモデルとなっています。ビジネスソフトウェアは、デジタル変革の一環として、ビジネスの変革を支援します。ビジネスソフトウェアは、高度なテクノロジーを通じて、業務をサポートし、付加価値を高め、業務を改善することができます。ビジネスソフトウェアは、デジタル変革の中核を成すものです。業務とプロセスを統合するための統一プラットフォームを提供します。ビジネスソフトウェアソリューションは、人事、データ分析、在庫管理、財務管理など、あらゆるプロセスを自動化するため、ビジネスソフトウェアはデジタル変革プロセスに不可欠です。このように、企業のデジタル変革の進展が、ビジネスソフトウェアおよびサービス市場の成長を牽引しています。
ビジネスソフトウェアおよびサービス市場レポートのセグメンテーション分析
ビジネスソフトウェアおよびサービス市場の分析に貢献した主要なセグメントは、ソフトウェア、導入形態、組織規模、および業界である。
- ソフトウェアの種類に基づいて、ビジネスソフトウェアおよびサービス市場は、財務、営業・マーケティング、人事、サプライチェーン、その他に分類されます。
- 導入形態に基づいて、ビジネスソフトウェアおよびサービス市場はクラウドとオンプレミスに分類される。
- 組織規模に基づき、ビジネスソフトウェアおよびサービス市場は、大企業と中小企業に分類される。
- 業界別に見ると、ビジネスソフトウェアおよびサービス市場は、金融サービス、ヘルスケア、IT・通信、製造、小売、運輸、その他に分類されます。
地域別ビジネスソフトウェアおよびサービス市場シェア分析
- ビジネスソフトウェアおよびサービス市場は、北米、ヨーロッパ、アジア太平洋(APAC)、中東・アフリカ(MEA)、南米・中米の5つの主要地域に区分される。
- 北米は、世界のビジネスソフトウェアおよびサービス市場において最大規模のシェアを占めています。北米地域の様々な産業におけるハイテク技術の導入動向が、ビジネスソフトウェアおよびサービス市場の成長を牽引してきました。デジタルツールの普及拡大や政府機関による高額な技術投資といった要因が、北米のビジネスソフトウェアおよびサービス市場の成長を促進すると予想されます。さらに、米国とカナダの先進国経済における研究開発への強い注力は、北米の企業に高度な技術ソリューションを市場に投入するよう促しています。加えて、米国には革新的なソリューションの開発にますます注力しているビジネスソフトウェアおよびサービス市場の企業が多数存在します。ビジネスソフトウェアおよびサービス市場の主要企業には、マイクロソフト、オラクル、シスコ、IBM、インフォアなどが挙げられます。これらの要因すべてが、北米地域のビジネスソフトウェアおよびサービス市場の成長に貢献しています。
ビジネスソフトウェアおよびサービス市場レポートの範囲
| レポート属性 | 詳細 |
|---|---|
| 2025年の市場規模 | 5,427億4,148万米ドル |
| 2034年までの市場規模 | 1兆1302億9458万米ドル |
| 世界の年間平均成長率(2026年~2034年) | 8.49% |
| 履歴データ | 2021年~2024年 |
| 予測期間 | 2026年~2034年 |
| 対象分野 |
ソフトウェアによる
|
| 対象地域および国 |
北米
|
| 市場リーダーと主要企業の概要 |
|
ビジネスソフトウェアおよびサービス市場のプレーヤー密度:ビジネスダイナミクスへの影響を理解する
ビジネスソフトウェアおよびサービス市場は、消費者の嗜好の変化、技術革新、製品のメリットに対する認識の高まりといった要因によるエンドユーザー需要の増加を背景に、急速に成長しています。需要の高まりに伴い、企業は提供する製品やサービスを拡大し、消費者のニーズに応えるべく革新を進め、新たなトレンドを活用することで、市場の成長をさらに加速させています。
ビジネスソフトウェアおよびサービス市場のニュースと最新動向
ビジネスソフトウェアおよびサービス市場は、主要な企業出版物、業界団体のデータ、データベースなどを含む一次調査および二次調査に基づいて、定性的および定量的なデータを収集することによって評価されます。以下は、ビジネスソフトウェアおよびサービス市場における主な動向です。
- 2023年9月、オールカーゴ・グループ傘下のガティ・リミテッドは、テック・マヒンドラとの提携を発表し、ガティ・エンタープライズ・マネジメント・システム(GEMS)2.0の開発に着手しました。ガティの中核となる運用ソフトウェアシステムであるGEMS 2.0は、効率性の向上とコスト削減を図りながら、顧客体験の向上と最新のテクノロジー主導型インターフェースの提供を目指しています。(出典:ガティ・リミテッド、プレスリリース)
2023年5月、WiproはServiceNowとの5年間の事業提携を発表しました。この提携は、顧客がビジネス変革を推進し、ビジネス上の課題を克服し、より高い価値を提供できるよう支援する新たなサービスへの投資と市場投入を目的としています。この提携に基づき、WiproとServiceNowは共同で顧客に対し、プロセスコンサルティング、導入、構成、およびマネージドサービスを提供します。提携は全世界を対象とし、当初は金融サービス、ヘルスケア、製造、エネルギー・公益事業の4つの主要産業に重点を置きます。(出典:Wipro、プレスリリース)
- 2023年7月、革新的なソフトウェアおよびデジタル化ソリューションプロバイダーであるESCRIBA AGは、Software AGとの戦略的パートナーシップの拡大を発表しました。このパートナーシップに基づき、ESCRIBAはSoftware AGのAgileAppsをベースとした強力なビジネスアプリケーションを開発しました。これにより、ESCRIBAはデータ管理、ケース管理、文書生成・管理といった新機能の開発を加速させることができます。
(出典:ESCRIBA AG、プレスリリース)
ビジネスソフトウェアおよびサービス市場レポートの対象範囲と成果物
「ビジネスソフトウェアおよびサービス市場規模と予測(2021年~2031年)」では、以下の分野を網羅した市場の詳細な分析を提供しています。
- ビジネスソフトウェアおよびサービス市場の規模と予測(グローバル、地域、国レベル)を、調査範囲に含まれるすべての主要市場セグメントについて分析します。
- ビジネスソフトウェアおよびサービス市場の動向(推進要因、阻害要因、主要な機会など)
- ビジネスソフトウェアおよびサービス市場の動向
- 詳細なPEST分析/ポーターの5つの力分析およびSWOT分析
- 主要な市場動向、主要企業、規制、および最近の市場動向を網羅した、グローバルおよび地域市場の分析。
- ビジネスソフトウェアおよびサービス市場の業界概況と競争分析(市場集中度、ヒートマップ分析、主要企業、最近の動向を含む)
- 詳細な企業プロフィール

アンキタは、テクノロジー、メディア、ICT、エレクトロニクス・半導体の各分野で8年以上の経験を持つ、ダイナミックな市場調査およびコンサルティングのプロフェッショナルです。Microsoft、Oracle、NEC、SAP、KPMG、Expeditors Internationalといったグローバルクライアントに対し、100件以上のコンサルティングおよび調査案件を主導・遂行してきました。彼女のコアコンピテンシーは、市場評価、データ分析、予測、戦略策定、競合情報、レポート作成です。
アンキタは、販売前の提案書作成やクライアントとの協議から、販売後の実用的なインサイトの提供まで、プロジェクトサイクル全体を巧みに管理することに長けています。彼女は、部門横断的なチームの管理、複雑な調査モジュールの構築、そしてクライアント固有のビジネス目標に合わせたソリューションの調整に長けています。優れたコミュニケーション能力、リーダーシップ、そしてプレゼンテーション能力により、急速に変化する市場環境において、常に価値主導の成果を生み出しています。
- 過去2年間の分析、基準年、CAGRによる予測(7年間)
- PEST分析とSWOT分析
- 市場規模価値/数量 - 世界、地域、国
- 業界と競争環境
- Excel データセット
お客様の声
Insight PartnersのSCADAシステム市場レポートは包括的で、現在のトレンドと将来の予測に関する貴重な洞察が含まれています。チームは終始、非常にプロフェッショナルで、対応が早く、サポートも充実していました。私たちは彼らのサービスに非常に満足しており、強くお勧めします。
ラン・ケデム パートナー, レアリテクノロジーズ株式会社非常に特殊なソフトウェア市場に関するレポートを依頼したところ、チームは数日でレポートを作成してくれました。情報は非常に関連性が高く、分かりやすくまとめられていました。その後、レポートにいくつか修正と追加を依頼しましたが、チームは非常に迅速に対応し、1週間も経たないうちに最終レポートを受け取ることができました。
ジャン=エルヴェ・ジェン 会長, フューチャー・アナリティカ重要な市場調査と予測のために、The Insight Partnersと協力しました。彼らは機会とリスクに関する明確な洞察を提供し、私たちの計画策定に役立ちました。彼らの調査は使いやすく、確かなデータに基づいており、賢明で自信に満ちた意思決定に役立ちました。彼らを強くお勧めします。
ピユーシュ・ナグパル 上級副社長, ハイビームグローバルInsight Partnersは、深い専門知識に基づき、洞察力に富み、構造化された市場調査を提供しました。チームは終始プロフェッショナルで、対応力も抜群でした。ユーザーフレンドリーなウェブサイトにより、業界レポートへのアクセスもスムーズでした。信頼性の高い高品質な調査サービスをお探しなら、Insight Partnersを強くお勧めします。
安達幸彦 最高経営責任者(CEO), ディープブルーLLC。The Insight Partnersから市場レポートを購入するのは今回が初めてです。最初は不安でしたが、ウェブサイトを見て、リスクを負ってでも購入してみようという気持ちになりました。レポートの品質とカスタマーサービスには大変満足しています。最初のレポートにはいくつか質問やコメントがありましたが、アナリストとメールで何度かやり取りした結果、戦略策定プロセスへのインプットとして活用できるレポートが完成しました。貴重なお時間を割いていただき、貴重な体験をさせていただき、誠にありがとうございました。他の方にもぜひお勧めしたいですし、今後さらに市場データが必要になった際には、まずThe Insight Partnersにご連絡させていただきます。
ジョン・スズキ 社長兼最高経営責任者、取締役, BKテクノロジーズナイジェリアの感染症IVD市場に関する情報提供依頼に対し、ご対応いただいた際、ご尽力とプロフェッショナルな姿勢に深く感謝申し上げます。忍耐強く、的確なアドバイスをいただき、また、最終的に取引成立に至った割引のご提供にも深く感謝申し上げます。今回の最初の出会いで得た強い印象のおかげで、今後もThe Insight Partnersとの連携を心待ちにしております。
チジオケ博士 オニア マネージングディレクター, パインクレストヘルスケア株式会社購入理由
- 情報に基づいた意思決定
- 市場動向の理解
- 競合分析
- 顧客インサイト
- 市場予測
- リスク軽減
- 戦略計画
- 投資の正当性
- 新興市場の特定
- マーケティング戦略の強化
- 業務効率の向上
- 規制動向への対応


 無料サンプルを入手 - ビジネスソフトウェアおよびサービス市場