
クレアチニン測定市場の需要、シェア、成長率(2034年まで)
クレアチニン測定市場規模と予測(2021年~2034年)、世界および地域別シェア、トレンド、成長機会分析レポートの対象範囲:製品別(キットおよび試薬)、タイプ別(酵素法およびジャッフェ速度論法)、サンプルタイプ別(血液または血清および尿)、エンドユーザー別(病院、診断検査機関、その他)、および地域別
- ステータス : 公開されたデータ
- レポートコード : TIPBT00002180
- カテゴリー : ライフサイエンス
- ページ数 : 150
- 利用可能なレポート形式 :


- 最終更新日 : April 09, 2026

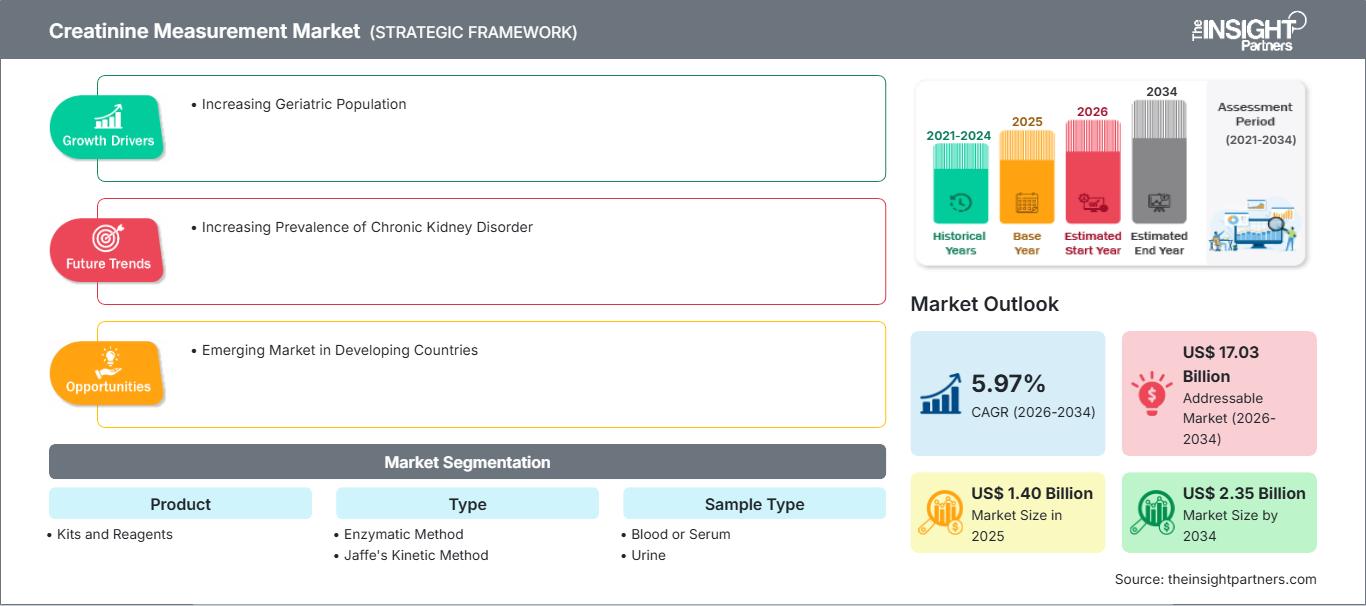
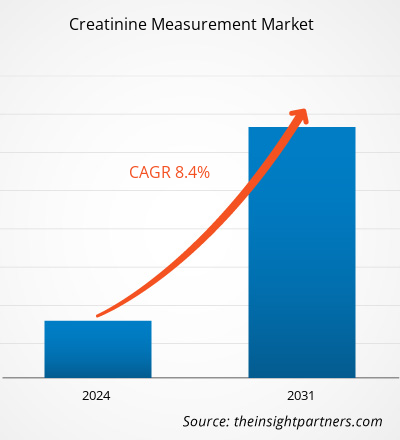
クレアチニン測定市場規模は、2025年の14億米ドルから2034年には23億5000万米ドルに達すると予測されています。同市場は、2026年から2034年の予測期間中に年平均成長率(CAGR)5.97%を記録すると見込まれています。
クレアチニン測定市場分析
高齢者人口は慢性腎臓病にかかりやすい。例えば、2021年に米国糖尿病協会が行った調査によると、推定3,840万人のアメリカ人、つまり人口の11.6%が糖尿病を患っている。65歳以上のアメリカ人の割合は依然として高く、約30%に達する。成人の糖尿病は腎不全のリスクを高める。例えば、全米腎臓財団が発表した研究によると、世界中で毎年推定30.0%の糖尿病患者が腎臓病を患っている。したがって、高齢者人口の増加は、予測期間中のクレアチニン測定市場の成長を促進すると予想される。
クレアチニン測定市場の概要
クレアチニン測定は、腎機能の評価や腎疾患の診断に用いられる分析方法です。尿中のクレアチニン値の上昇は、慢性腎臓病や急性腎障害などの腎臓の損傷や疾患を示唆します。市場の成長は、慢性腎臓病の罹患率の上昇や高齢者人口の増加といった主要な推進要因によるものです。しかしながら、新たなバイオマーカーの採用への移行は、予測期間中の市場成長を抑制する要因となることが予想されます。
市場評価と洞察
- クレアチニン測定の世界市場規模は、2025年には14億米ドルと評価された。
- 年間市場規模は2034年までに23億5000万米ドルに達すると予測されている。
- 2026年から2034年までの潜在市場規模(TAM)は、約170億3000万米ドルに達すると予測されている。
- 市場は予測期間中に年平均成長率(CAGR)5.97%を記録すると予想されている。
- 米国は、高齢者人口の増加と業界の動向の変化に支えられ、重要な市場となっている。
- 市場分析は、北米、ヨーロッパ、アジア太平洋、南米、中米、中東、アフリカを対象とし、予測期間全体にわたる成長を評価しています。
- 発展途上国の新興市場などの市場機会は、市場のダイナミクスと対象市場に影響を与えることが期待されます。
- 本レポートでは、シーメンス・ヘルスケア、アボット、サーモフィッシャーサイエンティフィック、F・ホフマン・ラ・ロシュ、ダナハー(ベックマン・コールター)、ケイマン・ケミカル、ランドックス・ラボラトリーズ、富士フイルム和光純薬、北京リードマン・バイオケミストリー、上海復星医薬集団有限公司などの業界参加企業を紹介するとともに、競争戦略とイノベーションの動向を分析しています。
お客様のご要望に合わせてこのレポートをカスタマイズしてください
無料カスタマイズクレアチニン測定市場:戦略的洞察
-
本レポートの主要市場トレンドをご覧ください。この無料サンプルには、市場動向から予測、見通しまで、幅広いデータ分析が含まれています。
クレアチニン測定市場の推進要因と機会
慢性腎臓病の有病率増加が市場に有利に働く
全米腎臓財団によると、慢性腎臓病(CKD)の世界的な罹患率は増加傾向にある。世界人口の約10%がCKDを患っており、適切な治療を受けられないために毎年数百万人が亡くなっている。200万人以上の患者が透析または腎臓移植による治療を受けている。これらの患者の大半は、米国、日本、ドイツ、ブラジル、イタリアの5つの先進国で治療を受けている。これらの5つの先進国は、世界人口のわずか12%しかカバーしていない。2019年の世界疾病負担研究によると、慢性腎臓病は世界全体の死亡原因の15%を占めている。
慢性腎臓病が一般大衆の間で蔓延していることから、世界的な健康問題として広く認識されています。米国腎臓学会(ASN)によると、分子診断の分野では近年目覚ましい進歩があり、腎臓関連疾患に苦しむ患者の管理方法が改善されつつあります。そのため、慢性腎臓病の増加と、腎臓の状態を把握するためのクレアチニン測定の利点が相まって、予測期間中のクレアチニン測定機器の需要は増加すると予想されます。
発展途上国の新興市場
アジア太平洋地域の新興経済国における医療産業の成長は、市場参入企業にとって事業拡大の好機となっています。これらの国々における膨大な患者数は、高度な診断システムへの需要を生み出しています。例えば、世界疾病負担データによると、インドは世界人口の18%を占めていますが、世界の腎疾患患者数の約17%を占めています。さらに、透析治療の増加は、腎疾患の罹患率の大幅な増加を示しています。また、世界疾病負担研究が発表した推計によると、中国だけでも1億1950万人の腎疾患患者がいます。このように、腎疾患の急速な増加と診断検査における需要と供給のギャップが相まって、2031年までに市場の成長に大きなチャンスをもたらすと予測されています。
クレアチニン測定市場レポートのセグメンテーション分析
クレアチニン測定市場分析の算出に貢献した主要なセグメントは、汚染物質、技術、および食品の種類である。
- 製品別に見ると、クレアチニン測定市場はキットと試薬に分けられる。2023年にはキット分野がより大きな市場シェアを占めた。
- 種類別に見ると、市場は酵素法とジャッフェ法(速度論的分析法)の2つに分けられる。2023年には、酵素法の方がより大きな市場シェアを占めた。
- 検体タイプ別に見ると、市場は血液・血清と尿に分類されます。2023年には、血液・血清製品セグメントが市場を牽引しました。
- エンドユーザー別に見ると、市場は病院、診断検査機関、その他の事業体に分類される。2023年には病院セグメントが市場を牽引した。
クレアチニン測定市場シェア分析(地域別)
クレアチニン測定市場レポートの地理的範囲は、主に北米、アジア太平洋、ヨーロッパ、中東・アフリカ、南米・中米の5つの地域に分けられます。
北米のクレアチニン測定市場は、現在成長段階にあり、急激な成長を遂げています。さまざまな腎臓病に関連する高齢者人口の増加、透析に対する有利な償還政策、医療費の増加、クレアチニン測定サービスを提供する病院やクリニックの増加、技術開発の進歩、この市場における主要プレーヤーの存在感などが、市場の成長を促進する要因となっています。
さらに、米国における有利な償還制度も、様々な外科手術における尿道カテーテルの採用増加を通じて市場の成長を牽引しています。複数の保険会社が検査サービスに対する償還を行っています。メディケアは、サービス内容に応じて、医師報酬基準(PFS)または臨床検査室報酬基準(CLFS)のいずれかを使用して償還を行います。加えて、検査機関は、メディケイド、TRICARE、連邦職員健康給付プラン(FEHBP)などの他の政府プログラムの受益者や、民間保険プランの加入者にもサービスを提供しています。
クレアチニン測定市場レポートの範囲
| レポート属性 | 詳細 |
|---|---|
| 2025年の市場規模 | 14億米ドル |
| 2034年までの市場規模 | 23億5000万米ドル |
| 世界の年間平均成長率(2026年~2034年) | 5.97% |
| 履歴データ | 2021年~2024年 |
| 予測期間 | 2026年~2034年 |
| 対象分野 |
副産物
|
| 対象地域および国 |
北米
|
| 市場リーダーと主要企業の概要 |
|
クレアチニン測定市場のプレーヤー密度:ビジネスダイナミクスへの影響を理解する
クレアチニン測定市場は、消費者の嗜好の変化、技術革新、製品のメリットに対する認識の高まりといった要因によるエンドユーザー需要の増加を背景に、急速に成長しています。需要の高まりに伴い、企業は製品・サービスの提供範囲を拡大し、消費者のニーズに応えるべく革新を進め、新たなトレンドを活用することで、市場の成長をさらに加速させています。
クレアチニン測定市場のニュースと最近の動向
クレアチニン測定市場は、主要な企業出版物、業界団体のデータ、データベースなどを含む一次調査および二次調査後の定性的および定量的データを収集することによって評価されます。以下は、イノベーション、事業拡大、および戦略に関する市場の動向の一覧です。
- 2022年11月1日、Creative Enzymes社は診断キット製造用原材料の販売を開始しました。Creative Enzymes社が提供する原材料には、コレステロール試薬キット、クレアチンキナーゼアッセイキット、クレアチニンアッセイキット、遊離脂肪酸アッセイキット、ホモシステインアッセイキット、シアル酸キット、トリグリセリドキット用の酵素が含まれます。これらの高品質製品は、迅速で信頼性が高く、再現性のある実験を常に保証します。(出典:Creative Enzymes社、プレスリリース)
- 2022年3月、ノヴァ・バイオメディカル社は、CEマークを取得したすべての国で、ノヴァ・マックス・プロ・クレアチニン/eGFR測定システムを発売することを発表しました。ノヴァ・マックス・プロは、病院外の診療現場で腎機能スクリーニングと腎疾患の早期発見を通じて腎臓ケアを向上させるための重要な新ツールです。(出典:ノヴァ・バイオメディカル社、プレスリリース)
クレアチニン測定市場レポートの対象範囲と成果物
「クレアチニン測定市場規模と予測(2021年~2031年)」レポートは、以下の分野を網羅した市場の詳細な分析を提供します。
- クレアチニン測定市場の規模と予測(グローバル、地域、国レベル)を、調査範囲に含まれるすべての主要市場セグメントについて分析します。
- 市場の動向(推進要因、阻害要因、主要な機会など)
- クレアチニン測定市場の動向
- 詳細なPEST分析とSWOT分析
- クレアチニン測定市場に関する分析。主要な市場動向、グローバルおよび地域的な枠組み、主要企業、規制、および最近の市場動向を網羅。
- クレアチニン測定業界の概況と競合分析。市場集中度、ヒートマップ分析、主要企業、最近の動向などを網羅。
- 詳細な企業プロフィール

ムリナル氏は、ライフサイエンス分野の市場インテリジェンスとコンサルティングで8年以上の経験を持つ、経験豊富なリサーチアナリストです。戦略的な思考と揺るぎない卓越性へのコミットメントに基づき、医薬品市場予測、市場機会評価、業界ベンチマークの開発において深い専門知識を培ってきました。彼女の業務は、クライアントが情報に基づいた戦略的意思決定を行えるよう、実用的なインサイトを提供することに重点を置いています。
ムリナル氏の強みは、複雑な定量データセットを有意義なビジネスインテリジェンスへと変換することにあります。彼女の分析力は、医薬品および医療機器分野における市場開拓(GTM)戦略の策定と成長機会の発掘に大きく貢献しています。信頼できるコンサルタントとして、ワークフロープロセスの合理化とベストプラクティスの確立に常に注力し、クライアントのイノベーションと業務効率の向上に貢献しています。
- 包括的な市場規模および予測分析
- 詳細なセグメンテーション分析
- 市場動向(ダイナミクス)の徹底的な評価
- 地域および国別のインサイト
- 競争環境および企業ベンチマーク
- 戦略的ビジネスインテリジェンス
お客様の声
Insight PartnersのSCADAシステム市場レポートは包括的で、現在のトレンドと将来の予測に関する貴重な洞察が含まれています。チームは終始、非常にプロフェッショナルで、対応が早く、サポートも充実していました。私たちは彼らのサービスに非常に満足しており、強くお勧めします。
ラン・ケデム パートナー, レアリテクノロジーズ株式会社非常に特殊なソフトウェア市場に関するレポートを依頼したところ、チームは数日でレポートを作成してくれました。情報は非常に関連性が高く、分かりやすくまとめられていました。その後、レポートにいくつか修正と追加を依頼しましたが、チームは非常に迅速に対応し、1週間も経たないうちに最終レポートを受け取ることができました。
ジャン=エルヴェ・ジェン 会長, フューチャー・アナリティカ重要な市場調査と予測のために、The Insight Partnersと協力しました。彼らは機会とリスクに関する明確な洞察を提供し、私たちの計画策定に役立ちました。彼らの調査は使いやすく、確かなデータに基づいており、賢明で自信に満ちた意思決定に役立ちました。彼らを強くお勧めします。
ピユーシュ・ナグパル 上級副社長, ハイビームグローバルInsight Partnersは、深い専門知識に基づき、洞察力に富み、構造化された市場調査を提供しました。チームは終始プロフェッショナルで、対応力も抜群でした。ユーザーフレンドリーなウェブサイトにより、業界レポートへのアクセスもスムーズでした。信頼性の高い高品質な調査サービスをお探しなら、Insight Partnersを強くお勧めします。
安達幸彦 最高経営責任者(CEO), ディープブルーLLC。The Insight Partnersから市場レポートを購入するのは今回が初めてです。最初は不安でしたが、ウェブサイトを見て、リスクを負ってでも購入してみようという気持ちになりました。レポートの品質とカスタマーサービスには大変満足しています。最初のレポートにはいくつか質問やコメントがありましたが、アナリストとメールで何度かやり取りした結果、戦略策定プロセスへのインプットとして活用できるレポートが完成しました。貴重なお時間を割いていただき、貴重な体験をさせていただき、誠にありがとうございました。他の方にもぜひお勧めしたいですし、今後さらに市場データが必要になった際には、まずThe Insight Partnersにご連絡させていただきます。
ジョン・スズキ 社長兼最高経営責任者、取締役, BKテクノロジーズナイジェリアの感染症IVD市場に関する情報提供依頼に対し、ご対応いただいた際、ご尽力とプロフェッショナルな姿勢に深く感謝申し上げます。忍耐強く、的確なアドバイスをいただき、また、最終的に取引成立に至った割引のご提供にも深く感謝申し上げます。今回の最初の出会いで得た強い印象のおかげで、今後もThe Insight Partnersとの連携を心待ちにしております。
チジオケ博士 オニア マネージングディレクター, パインクレストヘルスケア株式会社購入理由
- 情報に基づいた意思決定
- 市場動向の理解
- 競合分析
- 顧客インサイト
- 市場予測
- リスク軽減
- 戦略計画
- 投資の正当性
- 新興市場の特定
- マーケティング戦略の強化
- 業務効率の向上
- 規制動向への対応


