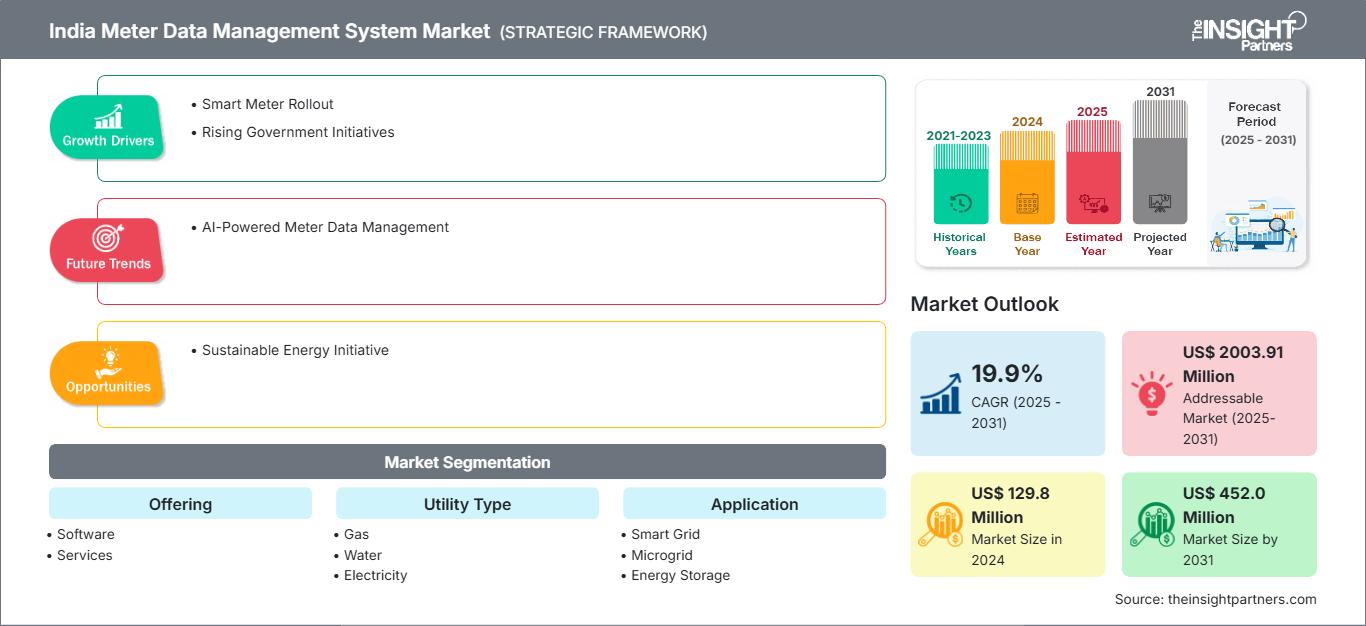
インドのメーターデータ管理システム市場規模は、2024年の1億2,980万米ドルから2031年には4億5,200万米ドルに達すると予想されています。市場は2025年から2031年の間に19.9%のCAGRを記録すると予想されています。
インドのメーターデータ管理システム市場分析
インドのメーターデータ管理システム市場は、今後数年間で大幅な拡大が見込まれています。政府の強力な取り組みとスマートメーターの導入義務化により、特にクラウド、AI、IoT、マルチユーティリティ統合機能を備えた堅牢なメーターデータ管理プラットフォームの需要が高まることが見込まれます。コスト、相互運用性、容量の問題による制約は依然として存在しますが、インドはデジタル化と効率化が進む電力エコシステムへの移行に伴い、グローバルおよびローカルのソフトウェア、サービス、システム統合ベンダーにとって、依然として大きなビジネスチャンスを秘めています。インドのスマートメーターへの移行は、電力配電部門の近代化における極めて重要な前進です。
政府の積極的な支援と構造化された資金調達メカニズムにより、これらの取り組みは業務効率の向上、損失の削減、そして消費者体験の向上につながることが期待されています。スマートメーターから流入する膨大なデータの収集、検証、管理のためのデジタルバックボーンとして機能するメーターデータ管理システムの導入拡大は、この変革の礎となります。
インドのメーターデータ管理システム市場の概要
インドのメーター データ管理システム (EDR) は、監視、検出、メーター データ管理システムが電気、ガス、水道、熱エネルギー分野の公益事業者にとって重要であることを目的に設計されたサイバーセキュリティ ソリューションです。これらのシステムにより、顧客構内からのメーター使用データの収集、検証、管理が可能になります。このデータから取得される情報は、課金、顧客サービス、消費予測、運用監視 (停止検出や損失分析など)、財務報告など、幅広い機能をサポートします。公益事業者に加えて、メーター データ管理システム ソリューションは、監査やエネルギー効率化イニシアチブのためのエネルギー サービス会社、使用状況報告と分析のためのエネルギー管理会社、生産計画とエンジニアリングのための独立系および地域エネルギー プロバイダー、内部会計と財務管理のための商業および工業企業によって採用されています。地方自治体や政府機関も、公共インフラ イニシアチブのサポートや規制遵守の確保のためにこれらのシステムに依存しています。
このレポートの一部、国レベルの分析、Excelデータパックなど、あらゆるレポートを無料でカスタマイズできます。また、スタートアップや大学向けのお得なオファーや割引もご利用いただけます。
インドのメーターデータ管理システム市場:

- このレポートの主要な市場動向を入手してください。この無料サンプルには、市場動向から見積もりや予測に至るまでのデータ分析が含まれます。
インドのメーターデータ管理システム市場の推進要因と機会
市場の推進要因:
スマートメーターの展開:
インドは、世界でも最も野心的なスマートメーター導入計画の一つを通じてエネルギー部門を急速に発展させ、デジタル公益事業変革の最前線に立っています。アベナー・キャピタルのレポートによると、政府は2億5000万台のスマートメーター設置を計画しており、これにより200億米ドル規模の市場機会が創出されると予測されています。政府の取り組みの高まり:
インドにおけるメーターデータ管理システム市場の成長を牽引する主な要因の一つは、政府が野心的な政策イニシアチブと重点的な投資を通じて配電部門の近代化に注力していることです。2022年7月、インド首相は電力省の旗艦事業である配電部門改革計画(RDSS)を立ち上げました。これは、配電会社(DISCOM)の業務効率と財務の持続可能性の向上を目的としています。
市場機会:
持続可能なエネルギーイニシアチブ:
インドは近年、エネルギー部門の強化において目覚ましい進歩を遂げ、急速に増加する電力需要への対応と持続可能性目標の推進という重要な二つの目標を効果的に両立させている。世界で最も急速に成長している経済の一つであるインドは、世界のエネルギー転換の最前線に位置し、そのエネルギー消費は大国の中で最も急速に増加すると予測されている。2025年2月、国際エネルギー機関(IEA)は、2026年から2029年にかけて世界の電力需要の増加分の85%を新興国と発展途上国が占め、このダイナミックな状況においてインドが中心的な役割を果たすと予測した。世界の一次エネルギー消費に占めるインドのシェアは2035年までに倍増すると予想されており、世界のエネルギー分野での同国の影響力拡大を浮き彫りにしている。
インドのメーターデータ管理システム市場レポート:セグメンテーション分析
インドのメーターデータ管理システム市場は、その仕組み、成長の可能性、そして最新のトレンドをより明確に把握するために、様々なセグメントに分割されています。以下は、ほとんどの業界レポートで使用されている標準的なセグメンテーション手法です。
提供内容:
ソフトウェア:
メーター データ管理システムのソフトウェア コンポーネントは、スマート ユーティリティがスマート メーターによって生成される膨大な量のデータを収集、保存、処理、分析できるようにする技術的な中核です。サービス:
メーターデータ管理システムに関連するサービスには、システムの導入とライフサイクル管理を成功させるために必要な様々なサービスが含まれます。これには、要件分析、コンサルティング、アーキテクチャ設計といった導入前の活動、そしてそれに続くシステム統合、テスト、そして導入が含まれます。
ユーティリティタイプ別:
電気:
電力会社は、主にスマート電気メーターの大規模な導入により、メーターデータ管理システム市場を支配している。水:
水道メーターデータ管理システムの水道事業セグメントは、老朽化したインフラを近代化し、水不足、漏水、無収水(NRW)などの差し迫った課題に対処しようとしている水道事業体によって成長を遂げています。ガス:
ガス事業者において、メーターデータ管理システムは安全性、請求精度、そして規制遵守に役立ちます。スマートガスメーターは、システムの整合性と効率的な運用に不可欠な消費量、流量、圧力レベルを提供します。
用途別:
スマートグリッド:
スマート グリッド アプリケーション セグメントは、メーター データ管理システムの主要かつ最も成熟した使用例です。マイクログリッド:
マイクログリッドは、独立して、または主要なユーティリティ グリッドと連動して動作するローカル グリッドです。エネルギー貯蔵:
メーター データ管理システムは、バッテリーの充電/放電サイクル、エネルギー スループット、健全性状態 (SoH)、グリッド信号統合の正確な追跡を可能にします。EV充電:
電気自動車 (EV) の充電は、送電網運営者にとって新たな課題と機会をもたらします。その他:
メーター データ管理システムの他の用途としては、建物のエネルギー管理、地域暖房、ピアツーピア エネルギー取引、エネルギー効率プログラムなどの分野が挙げられます。
エンドユーザー業界別:
- 居住の
- 商業
- 産業
各セクターにはそれぞれ固有のメーターデータ管理システム要件があり、それがデータ管理と分析に影響を与えます。
インドのメーターデータ管理システム市場における地域分析
予測期間を通じてインドのメーターデータ管理システム市場に影響を与える地域的な動向と要因は、The Insight Partnersのアナリストによって徹底的に解説されています。このセクションでは、インドのメーターデータ管理システム市場のセグメントと、北米、ヨーロッパ、アジア太平洋、中東・アフリカ、中南米における地域についても解説します。
インドのメーターデータ管理システム市場レポートの範囲
レポート属性 | 詳細 |
---|---|
2024年の市場規模 | 1億2,980万米ドル |
2031年までの市場規模 | 4億5,200万米ドル |
世界のCAGR(2025年~2031年) | 19.9% |
履歴データ | 2021-2023 |
予測期間 | 2025~2031年 |
対象セグメント | 提供することで
|
対象地域と国 | インド
|
市場リーダーと主要企業の概要 |
|
インドのメーターデータ管理システム市場のプレーヤー密度:ビジネスダイナミクスへの影響を理解する
インドのメーターデータ管理システム市場は、消費者の嗜好の変化、技術の進歩、製品メリットへの認知度の向上といった要因によるエンドユーザー需要の高まりに牽引され、急速に成長しています。需要が高まるにつれ、企業は製品ラインナップの拡充、消費者ニーズへの対応のための革新、そして新たなトレンドの活用を進めており、これが市場の成長をさらに加速させています。

- インドのメーターデータ管理システム市場のトップキープレーヤーの概要を入手
インドのメーターデータ管理システム市場シェア分析
スマートメーターの導入と政府の取り組みの増加は、インドのメーターデータ管理システム市場を牽引する重要な要因です。持続可能なエネルギーへの取り組みにより、市場は予測期間中も成長を続けると予想されます。AIを活用したメーターデータ管理の普及は、市場の主要なトレンドの一つです。しかしながら、メーターデータの一貫性の欠如は、市場の成長を阻害する可能性があります。
1. インド
市場占有率:
世界市場の大きな部分を占めている主な推進要因:
- スマートメーターの展開:
- 政府の取り組みの高まり。
トレンド:
AI を活用したメーターデータ管理システム。
インドのメーターデータ管理システム市場のプレーヤー密度:ビジネスダイナミクスへの影響を理解する
高い市場密度と競争
Siemens AG、Landis + GYR Group AG、Itronといった既存企業の存在により、競争は熾烈です。FluentGrid(インド)やGenus(インド)といった地域密着型かつニッチなプロバイダーも、インド全土で競争を激化させています。
この高いレベルの競争により、企業は次のようなものを提供して差別化を図ろうとしています。
- 高度なセキュリティ機能
- 分析やメーターデータ管理などの付加価値サービス
- 競争力のある価格モデル
- 強力な顧客サポートと簡単な統合
機会と戦略的動き
- スマートグリッド、IoT、分析との統合。
- 標準化と相互運用性に重点を置きます。
インドのメーターデータ管理システム市場で事業を展開している主要企業は次のとおりです。
- アイトロン社(米国)
- オラクル社(米国)
- ジェントラックグループ(ニュージーランド)
- Fluentgrid Limited(インド)
- シーメンスAG(ドイツ)
- エナジスピーク(インド)
- BCITS(インド)
- Esyasoft(インド)
- ランディス・ギア・グループAG(スイス)
- ジェナス・パワー・インフラストラクチャーズ社(インド)
免責事項:上記の企業は、特定の順序でランク付けされているわけではありません。
調査の過程で分析した他の企業:
- ククルス・ゾノス
- スマートフレックス
- コネクソインサイト
- ATLASエネルギー監視システム
- PI システム (AVEVA)
- Net@Suite (エンジニアリング Ingegneria Informatica)
- テラノバ TAMM MDM
- フェランティ MECOMS
- エネルギーワークス
- SAP
- メディデータソリューション
- ラディックスIoT
- エネルギーキャップ
- ハネウェル EIServer
- イートン
インドのメーターデータ管理システム市場のニュースと最近の動向
エシャソフトはアダニ・エナジーと合弁会社を設立したと発表した。
Esyasoftは、インドおよびその他の国々でスマートメータープロジェクトを実施するため、Adani Energy Solutionsと合弁会社を設立したと発表しました。この提携により、AdaniはEsyasoftのスマートメーターソリューション部門の株式49%を取得します。ランディス・ギアはMDUS認証を完了したと発表した。
Landis+Gyrは、Landis+Gyr MDMSプラットフォームのMDUS認証を取得したと発表しました。この認証の更新により、MDUS統合サービスを利用している電力会社顧客は、インターバル課金および時系列課金の新機能を利用できるようになります。Landis+GyrのMDUS(Meter Data Unification and Synchronization:メーターデータ統合および同期)は、スマートメーター環境を電力会社のバックオフィスシステムに接続・同期させることで、エンドツーエンドのビジネスプロセスを実現する独自のソリューションです。
インドのメーターデータ管理システム市場レポートの対象範囲と成果物
「インドのメーターデータ管理システム市場規模と予測(2021〜2031年)」レポートでは、以下の分野をカバーする市場の詳細な分析を提供しています。
- インドのメーターデータ管理システム市場規模と、スコープに含まれるすべての主要な市場セグメントの国レベルでの予測
- インドのメーターデータ管理システム市場の動向、および推進要因、制約、主要な機会などの市場動向
- 詳細なPEST分析とSWOT分析
- インドのメーターデータ管理システム市場分析では、主要な市場動向、世界および地域の枠組み、主要プレーヤー、規制、最近の市場動向を網羅しています。
- インドのメーターデータ管理システム市場における市場集中、ヒートマップ分析、主要プレーヤー、最近の動向を網羅した業界の展望と競争分析
- 詳細な企業プロフィール
よくある質問
Major players include FluentGrid, Genus, Itron, Siemens AG, Landis + Gyr Group AG, among others.
As of 2024, the India Meter Data Management System market is valued at approximately USD 129.8 million. It is projected to reach USD 452.0 million by 2031, growing at a compound annual growth rate (CAGR) of 19.9% during the forecast period from 2025 to 2031.
The market is primarily driven by:
1. Smart Meter Rollout: India is rapidly advancing its energy sector through one of the most ambitious smart meter rollout initiatives globally, positioning itself at the forefront of digital utility transformation.
2. Rising Government Initiatives: One of the primary drivers propelling the growth of the meter data management system market in India is the increasing focus of the government on modernizing the power distribution sector through ambitious policy initiatives and targeted investments.
AI are revolutionizing India Meter Data Management Systems by:
Greater Speed and Accuracy With the integration of AI, utilities can now identify irregularities or anomalies in energy consumption data with far greater speed and accuracy. The speed and accuracy also enable them to automatically flag unusual patterns, reduce the occurrence of billing errors, and mitigate the need for manual intervention or physical inspections, commonly referred to as "truck rolls", which can be costly and time-consuming.
Challenges include:
Inconsistent Metering Data: Inconsistency in data arises when meter readings deviate from expected or historical consumption patterns, leading to discrepancies that can undermine the accuracy and reliability of energy usage information.
Key industries utilizing India Meter Data Management Systems include:
1. Residential: The residential sector forms the largest base of smart meter installations globally, making it a major driver of the adoption of meter data management systems.
2. Commercial: Commercial end users, including shopping centers, office complexes, hospitals, and educational institutions, have unique energy demands and are typically early adopters of data-driven energy management solutions.
3. Industrial: Industrial facilities have complex, high-load energy environments that require robust and reliable data management systems.
The Software segment held the largest share of the India Meter Data Management System Market in 2024 as enables smart utilities to collect, store, process, and analyze the vast volumes of data generated by smart meters.
- 過去2年間の分析、基準年、CAGRによる予測(7年間)
- PEST分析とSWOT分析
- 市場規模価値/数量 - 世界、地域、国
- 業界と競争環境
- Excel データセット
お客様の声
購入理由
- 情報に基づいた意思決定
- 市場動向の理解
- 競合分析
- 新興市場の特定
- 顧客インサイト
- 市場予測
- リスク軽減
- 業務効率の向上
- 戦略計画
- 投資の正当性
- 業界イノベーションの追跡
- 規制動向への対応
はい!レポートの範囲(目次)、レポートの構成、そしてレポート全体の価値を評価するのに役立つ厳選されたインサイトを含む、レポートの無料サンプルをご提供しています。 「サンプルをダウンロード」ボタンをクリックするか、お問い合わせの上、サンプルをお送りください。
はい、アナリストによるサポートはパッケージに含まれています。ご購入後、アナリストにご連絡いただき、レポートの洞察や手法についてご説明したり、調査結果がお客様のビジネスニーズにどのように当てはまるかご相談いただけます。
ご注文が完了すると、確認メールと請求書が届きます。
• 公開済みレポートの場合:4~6営業時間以内に、セキュリティ保護されたメールがお客様のメールアドレスに送信されます。
• 近日公開予定レポートの場合:ご注文は事前予約として記録されます。リリース予定日については、担当チームからご連絡し、最新情報をお知らせいたします。レポートが公開され次第、ご登録いただいたメールアドレスに配信いたします。
お客様の特定の目的に合わせてレポートをカスタマイズするためのオプションをご用意しております。特定の地域、業界セグメント、競合他社の分析、データカットなど、より深い洞察が必要な場合でも、当社のリサーチチームがそれに応じてレポートをカスタマイズいたします。ご要望をお聞かせください。お客様に合わせたご提案やスコープを喜んでご提供いたします。
レポートは、選択したライセンスに応じて、PDF形式またはExcelデータセットで提供されます。
PDF版では、完全な分析とビジュアルがすぐに読める形式で提供されます。Excelデータセットには、すべてのデータテーブルが含まれており、簡単に操作して詳細な分析を行うことができます。
ご購入時にライセンスオプションをご確認ください。または、ご購入に含まれる形式を確認するには、お問い合わせください。
当社の決済プロセスは完全に安全で、PCI-DSSに準拠しています。
当社は、すべての取引が業界標準のSSL暗号化で保護されるよう、信頼性の高い暗号化された決済ゲートウェイを使用しています。お支払い情報は当社のサーバーに保存されることはありません。認定されたサードパーティの決済代行業者によって安全に処理されます。
お客様の個人情報と財務情報は当社で安全に保管されますので、安心してご購入いただけます。
はい、まとめ買いの場合は特別価格をご用意しております。
複数のレポートをご購入いただく場合は、お客様のニーズに合わせてカスタマイズされたバンドルオファーまたは数量ベースの割引をご提供いたします。ご検討中のレポートのリストを弊社の営業チームまでお送りください。お客様に合わせたお見積もりをお送りいたします。
はい、もちろんです。
弊社のチームが、お客様が十分な情報に基づいて意思決定できるようお手伝いいたします。レポートの範囲、方法論、カスタマイズオプション、最適なライセンスなど、ご質問がございましたら、お気軽にお問い合わせください。 sales@theinsightpartners.com までご連絡ください。担当者が速やかにご連絡いたします。
はい、ご購入が完了すると請求書が自動的に生成され、ご登録いただいたメールアドレスに送信されます。
特定の形式で請求書が必要な場合や、追加情報(会社名、GST、VAT情報など)が必要な場合は、お気軽にお問い合わせください。喜んでご対応させていただきます。
はい、もちろんです。
レポートへのアクセスや受信に問題が発生した場合は、サポートチームがサポートいたします。ご注文情報を添えて、メールまたはライブチャットでお問い合わせください。問題を迅速に解決し、お客様が中断することなくレポートにアクセスできるようお手伝いいたします。


The List of Companies - India Meter Data Management System Market
- Itron Inc.
- Oracle Corp
- Gentrack Group
- Fluentgrid Limited
- Siemens AG
- EnergiSpeak
- BCITS
- Esyasoft
- Landis+Gyr Group AG
- Genus Power Infrastructures Ltd.


The Insight Partners performs research in 4 major stages: Data Collection & Secondary Research, Primary Research, Data Analysis and Data Triangulation & Final Review.
- Data Collection and Secondary Research:
As a market research and consulting firm operating from a decade, we have published and advised several client across the globe. First step for any study will start with an assessment of currently available data and insights from existing reports. Further, historical and current market information is collected from Investor Presentations, Annual Reports, SEC Filings, etc., and other information related to company’s performance and market positioning are gathered from Paid Databases (Factiva, Hoovers, and Reuters) and various other publications available in public domain.
Several associations trade associates, technical forums, institutes, societies and organization are accessed to gain technical as well as market related insights through their publications such as research papers, blogs and press releases related to the studies are referred to get cues about the market. Further, white papers, journals, magazines, and other news articles published in last 3 years are scrutinized and analyzed to understand the current market trends.
- Primary Research:
The primarily interview analysis comprise of data obtained from industry participants interview and answers to survey questions gathered by in-house primary team.
For primary research, interviews are conducted with industry experts/CEOs/Marketing Managers/VPs/Subject Matter Experts from both demand and supply side to get a 360-degree view of the market. The primary team conducts several interviews based on the complexity of the markets to understand the various market trends and dynamics which makes research more credible and precise.
A typical research interview fulfils the following functions:
- Provides first-hand information on the market size, market trends, growth trends, competitive landscape, and outlook
- Validates and strengthens in-house secondary research findings
- Develops the analysis team’s expertise and market understanding
Primary research involves email interactions and telephone interviews for each market, category, segment, and sub-segment across geographies. The participants who typically take part in such a process include, but are not limited to:
- Industry participants: VPs, business development managers, market intelligence managers and national sales managers
- Outside experts: Valuation experts, research analysts and key opinion leaders specializing in the electronics and semiconductor industry.
Below is the breakup of our primary respondents by company, designation, and region:
Once we receive the confirmation from primary research sources or primary respondents, we finalize the base year market estimation and forecast the data as per the macroeconomic and microeconomic factors assessed during data collection.
- Data Analysis:
Once data is validated through both secondary as well as primary respondents, we finalize the market estimations by hypothesis formulation and factor analysis at regional and country level.
- Macro-Economic Factor Analysis:
We analyse macroeconomic indicators such the gross domestic product (GDP), increase in the demand for goods and services across industries, technological advancement, regional economic growth, governmental policies, the influence of COVID-19, PEST analysis, and other aspects. This analysis aids in setting benchmarks for various nations/regions and approximating market splits. Additionally, the general trend of the aforementioned components aid in determining the market's development possibilities.
- Country Level Data:
Various factors that are especially aligned to the country are taken into account to determine the market size for a certain area and country, including the presence of vendors, such as headquarters and offices, the country's GDP, demand patterns, and industry growth. To comprehend the market dynamics for the nation, a number of growth variables, inhibitors, application areas, and current market trends are researched. The aforementioned elements aid in determining the country's overall market's growth potential.
- Company Profile:
The “Table of Contents” is formulated by listing and analyzing more than 25 - 30 companies operating in the market ecosystem across geographies. However, we profile only 10 companies as a standard practice in our syndicate reports. These 10 companies comprise leading, emerging, and regional players. Nonetheless, our analysis is not restricted to the 10 listed companies, we also analyze other companies present in the market to develop a holistic view and understand the prevailing trends. The “Company Profiles” section in the report covers key facts, business description, products & services, financial information, SWOT analysis, and key developments. The financial information presented is extracted from the annual reports and official documents of the publicly listed companies. Upon collecting the information for the sections of respective companies, we verify them via various primary sources and then compile the data in respective company profiles. The company level information helps us in deriving the base number as well as in forecasting the market size.
- Developing Base Number:
Aggregation of sales statistics (2020-2022) and macro-economic factor, and other secondary and primary research insights are utilized to arrive at base number and related market shares for 2022. The data gaps are identified in this step and relevant market data is analyzed, collected from paid primary interviews or databases. On finalizing the base year market size, forecasts are developed on the basis of macro-economic, industry and market growth factors and company level analysis.
- Data Triangulation and Final Review:
The market findings and base year market size calculations are validated from supply as well as demand side. Demand side validations are based on macro-economic factor analysis and benchmarks for respective regions and countries. In case of supply side validations, revenues of major companies are estimated (in case not available) based on industry benchmark, approximate number of employees, product portfolio, and primary interviews revenues are gathered. Further revenue from target product/service segment is assessed to avoid overshooting of market statistics. In case of heavy deviations between supply and demand side values, all thes steps are repeated to achieve synchronization.
We follow an iterative model, wherein we share our research findings with Subject Matter Experts (SME’s) and Key Opinion Leaders (KOLs) until consensus view of the market is not formulated – this model negates any drastic deviation in the opinions of experts. Only validated and universally acceptable research findings are quoted in our reports.
We have important check points that we use to validate our research findings – which we call – data triangulation, where we validate the information, we generate from secondary sources with primary interviews and then we re-validate with our internal data bases and Subject matter experts. This comprehensive model enables us to deliver high quality, reliable data in shortest possible time.