メーターデータ管理システム市場の概要、成長、トレンド、分析、調査レポート(2025-2031)
過去データ : 2021-2023 | 基準年 : 2024 | 予測期間 : 2025-2031メーターデータ管理システム市場の規模と予測(2021年 - 2031年)、世界および地域のシェア、傾向、成長機会分析レポートの対象範囲:提供(ソフトウェアおよびサービス)、ユーティリティタイプ(電気、水道、ガス)、アプリケーション(スマートグリッド、マイクログリッド、エネルギー貯蔵、EV充電、その他)、エンドユーザー(住宅、商業、産業)、および地理(北米、ヨーロッパ、アジア太平洋、中東およびアフリカ、南米および中央アメリカ)
- ステータス : 出版
- レポートコード : TIPRE00006169
- カテゴリー : テクノロジー、メディア、通信
- ページ数 : 264
- 利用可能なレポート形式 :


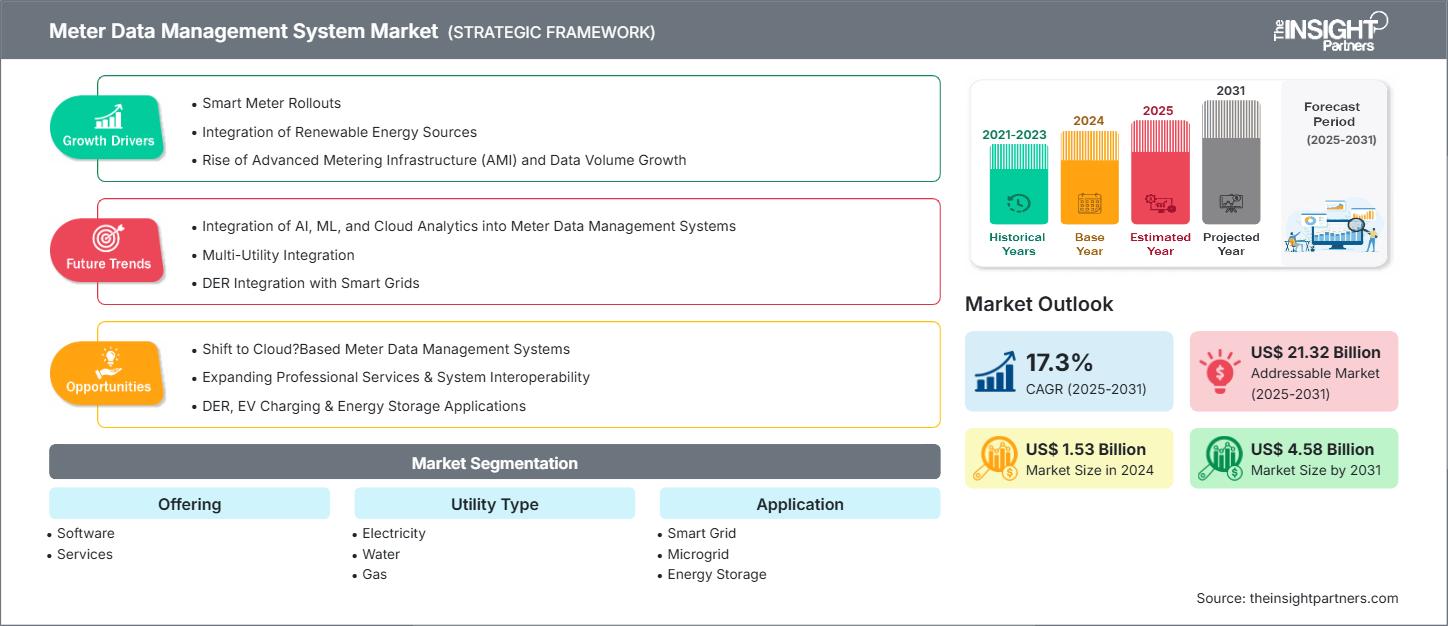
メーターデータ管理システムの市場規模は、2024年の15億3,000万米ドルから2031年には45億8,000万米ドルに達すると予想されています。市場は2025年から2031年の間に17.3%のCAGRを記録すると予想されています。
メーターデータ管理システム市場分析
世界のメーターデータ管理システム市場の成長には、スマートメーターの広範な導入、クリーンエネルギー源の統合、高度メーターインフラ(AMI)の台頭、データ量の増加、そして政府の取り組みなど、いくつかの主要な要因があります。クラウドベースのメーターデータ管理ソリューションへの移行と、エネルギーの持続可能性に向けた継続的な取り組みに後押しされ、市場は予測期間中も成長を続けると予想されます。市場に影響を与える重要なトレンドの一つは、AIベースのメーターデータ管理ソリューションの台頭です。しかしながら、メーターデータの変動といった問題は、市場の拡大を鈍化させる可能性があります。
メーターデータ管理システム市場の概要
メーターデータ管理システム(MDMS)は、電気、ガス、水道、熱エネルギー分野で事業を展開する公益企業にとって、依然として必須のシステムです。こうしたシステムにより、顧客施設から発信されるメーターデータの収集、検証、管理が可能になります。収集されたデータは、課金、顧客サービス、消費予測、運用監視(停電検知や損失分析など)、財務報告など、幅広い活動の基礎となります。さらに、公益事業業界以外でも、メーターデータ管理システムソリューションは、エネルギーサービス会社の監査や省エネプログラム、エネルギー管理会社の消費報告と分析、独立系エネルギー生産者や地域エネルギー供給業者の生産計画とエンジニアリング、商業・工業企業の社内会計や財務管理に使用されています。地方自治体や政府機関も、公共インフラプログラムや規制遵守の取り組みにおいてこれらのシステムを使用しています。
このレポートの一部、国レベルの分析、Excelデータパックなど、あらゆるレポートを無料でカスタマイズできます。また、スタートアップや大学向けのお得なオファーや割引もご利用いただけます。
メーターデータ管理システム市場:戦略的洞察
-
このレポートの主要な市場動向を入手してください。この無料サンプルには、市場動向から見積もりや予測に至るまでのデータ分析が含まれます。
メーターデータ管理システム市場の推進要因と機会
市場の推進要因:
- スマート メーターの導入: メーター データ管理システム市場の背景にある主な原因の 1 つは、世界中で大規模なスマート メーターの導入が進んでいることです。これは、規制上の要求とインフラストラクチャの近代化への対応として政府によって実施されています。
- 再生可能エネルギー源の統合:メーターデータ管理システム(MDS)プラットフォームは、今日のエネルギー分野においてますます不可欠なものになりつつあります。本質的には、スマートメーターインフラ(AMI)の測定値の4次元(x、y、z、時間)データを取得、検証、集約、分析する地理情報システム(GIS)マッピングソフトウェアとして機能します。
- 高度メーター インフラストラクチャ (AMI) の台頭とデータ量の増加: メーター データ管理システムの世界市場を形成する主な要因の 1 つは、高度メーター インフラストラクチャ (AMI) の急速な導入です。
市場機会:
- クラウドベースの導入拡張: クラウド インフラストラクチャの使用増加により、公共事業向けにスケーラブルでより手頃な MDMS ソリューションが提供されるようになりました。これは主に、クラウドベースの導入のニーズによるものです。
- 専門サービスとシステムの相互運用性の拡大: MDMS インフラストラクチャの複雑性の増大が、顧客情報システムの統合と DER の管理に特に重点を置いたコンサルティング、統合、保守サービスの需要が高まっている主な理由です。
- DER、EV 充電、エネルギー貯蔵アプリケーション: マイクログリッド、電気自動車の充電、エネルギー貯蔵の登場により、特殊な MDMS モジュールとカスタマイズされたソリューションの開発に新たな道が開かれました。
メーターデータ管理システム市場レポートのセグメンテーション分析
メーターデータ管理システム市場は、その仕組み、成長の可能性、そして最新のトレンドをより明確に把握するために、様々なセグメントに分割されています。以下は、ほとんどの業界レポートで使用されている標準的なセグメンテーション手法です。
提供内容:
- ソフトウェア: メーター データ管理システムのソフトウェア コンポーネントは、スマート ユーティリティがスマート メーターによって生成される膨大な量のデータを収集、保存、処理、分析できるようにする主要な中核です。
- サービス:メーターデータ管理システムに関連するサービスには、システムの導入とライフサイクル管理を成功させるために必要な様々なサービスが含まれます。これには、要件分析、コンサルティング、アーキテクチャ設計といった導入前の活動から、システム統合、テスト、そして導入までが含まれます。
ユーティリティタイプ別:
- 電力: スマート電気メーターの大規模な導入により、電力会社はメーターデータ管理システム市場を独占しています。
- 水道: メーター データ管理システム (MDMS) の水道事業部門が拡張され、水道事業者は水不足、漏水、無収水 (NRW) などのさまざまな問題に直面している古いインフラストラクチャを更新できるようになります。
- ガス:ガス業界におけるMDMSは、安全性、正確な請求、そして規制当局の要件への適合に役立ちます。スマートガスメーターは、システムの安全かつ効率的な運用に必要な消費量、流量、圧力レベルを提供します。
用途別:
- スマート グリッド: スマート グリッド アプリケーション セグメントは、メーター データ管理システムの主要かつ最も成熟した使用例です。
- マイクログリッド: マイクログリッドは、独立して、または主要なユーティリティ グリッドと連動して動作するローカライズされたグリッドです。
- エネルギー貯蔵: メーター データ管理システムは、バッテリーの充電/放電サイクル、エネルギー スループット、健全性状態 (SoH)、およびグリッド信号統合の正確な追跡を可能にします。
- EV 充電: 電気自動車 (EV) の充電は、送電網運用者に新たな課題と機会をもたらします。
- その他: メーター データ管理システムの他の用途としては、建物のエネルギー管理、地域暖房、ピアツーピア エネルギー取引、エネルギー効率プログラムなどの分野が挙げられます。
エンドユーザー業界別:
- 居住の
- コマーシャル
- 産業
各セクターにはそれぞれ固有のメーターデータ管理システム要件があり、それがデータ管理と分析に影響を与えます。
地理別:
- 北米
- ヨーロッパ
- アジア太平洋
- 南米と中央アメリカ
- 中東・アフリカ
アジア太平洋地域のメーターデータ管理システム市場は、最も急速な成長が見込まれています。再生可能エネルギー源の統合と高度メーターの普及が市場を牽引すると考えられます。
メーターデータ管理システム市場の地域別分析
予測期間全体を通してメーターデータ管理システム市場に影響を与える地域的なトレンドと要因は、The Insight Partnersのアナリストによって徹底的に解説されています。このセクションでは、北米、ヨーロッパ、アジア太平洋、中東・アフリカ、中南米におけるメーターデータ管理システム市場のセグメントと地域についても解説します。
メーターデータ管理システム市場レポートの範囲
| レポート属性 | 詳細 |
|---|---|
| 2024年の市場規模 | 15億3000万米ドル |
| 2031年までの市場規模 | 45億8000万米ドル |
| 世界のCAGR(2025年~2031年) | 17.3% |
| 履歴データ | 2021-2023 |
| 予測期間 | 2025~2031年 |
| 対象セグメント |
提供することで
|
| 対象地域と国 |
北米
|
| 市場リーダーと主要企業の概要 |
|
メーターデータ管理システム市場のプレーヤー密度:ビジネスダイナミクスへの影響を理解する
メーターデータ管理システム市場は、消費者の嗜好の変化、技術の進歩、製品メリットへの認知度の向上といった要因によるエンドユーザー需要の高まりに牽引され、急速に成長しています。需要の増加に伴い、企業は提供内容の拡充、消費者ニーズへの対応のための革新、そして新たなトレンドの活用を進めており、これが市場の成長をさらに加速させています。
- メーターデータ管理システム市場のトップキープレーヤーの概要を入手
地域別メーターデータ管理システム市場シェア分析
アジア太平洋地域の市場は、今後数年間で最も急速に成長すると予想されています。南米、中米、中東、アフリカの新興市場にも、メーターデータ管理システムプロバイダーにとって、事業拡大のための未開拓の機会が数多く存在します。
メーターデータ管理システム市場は地域によって異なります。地域ごとの成長パターンは、スマートメーターの導入、再生可能エネルギーの利用、高度メーターインフラ(AMI)の普及とデータ量の増加といった要因によって左右されます。以下は、地域別の市場シェアと動向の概要です。
1. 北米
- 市場シェア: 早期導入とユーティリティの近代化により、圧倒的なシェアを維持
-
主な推進要因:
- スマートグリッドへの投資
- 連邦および州レベルのエネルギー効率規制
- スマートメーターの普及率の高さ
- トレンド: リアルタイムのグリッドバランシングのための分散型エネルギー資源管理システム (DERMS) と MDMS の統合
2. ヨーロッパ
- 市場シェア: 厳しいエネルギー規制と持続可能性目標によって大きなシェアを獲得
-
主な推進要因:
- エネルギー効率に関するEU指令
- 再生可能エネルギーの統合
- 国境を越えたエネルギーデータプラットフォームのサポート
- トレンド: EUのデジタル変革フレームワークに沿ったクラウドベースのMDMSの成長
3. アジア太平洋
- 市場シェア: スマートグリッドの導入が本格化している最も急成長している地域
-
主な推進要因:
- 政府主導のデジタルユーティリティプログラム
- 都市化とスマートシティ開発
- グリッドの信頼性に関する懸念
- トレンド: 大量のデータと需要予測を管理する AI 対応 MDMS の急増
4. 南米と中央アメリカ
- 市場シェア: 公共事業の近代化への投資が増加する新興市場
-
主な推進要因:
- 老朽化したインフラのアップグレード
- 遠隔地の電化
- 地域の再生可能エネルギープロジェクト
- トレンド: 段階的なスマートメーター導入に対応するために、モジュール式MDMSプラットフォームが好まれる
5. 中東およびアフリカ
- 市場シェア: 政府の強力な支援を受けて市場が成長
-
主な推進要因:
- 国家エネルギー多様化計画
- 水エネルギー連携プロジェクト
- スマートシティと公共事業改革
- トレンド: 従来のエネルギー源と再生可能エネルギー源を組み合わせたハイブリッドグリッドにおけるMDMSの導入
メーターデータ管理システム市場のプレーヤー密度:ビジネスダイナミクスへの影響を理解する
高い市場密度と競争
Oracle、Siemens、Itron、Landis+Gyr、Schneider Electricといった大手ベンダーの存在により、競争は激化しています。Kamstrup(ヨーロッパ)、Aclara(北米)、Wasion Group(アジア)といった地域企業やニッチな企業も、市場の競争激化に貢献しています。
この競争環境により、ベンダーは次のような差別化を迫られています。
- スマートグリッドおよび再生可能エネルギーシステムとの統合
- スケーラブルなクラウドネイティブMDMSプラットフォーム
- 負荷予測と障害検出のための AI 駆動型データ分析
- マルチベンダーメーターエコシステムとの相互運用性
機会と戦略的動き
- 全国的なスマートメーターの展開に向けた公益事業会社および政府との協力
- AI/ML を組み込んで予測メンテナンスと消費分析を強化
メーターデータ管理システム市場で事業を展開している主要企業は次のとおりです。
- Itron Inc. – 米国
- オラクル社(米国)
- ジェントラックグループ – ニュージーランド
- Fluentgrid Limited – インド
- シーメンスAG – ドイツ
- ランディス・ギア・グループAG – スイス
- ハネウェル・インターナショナル社 – 米国
- ハッベル社 – 米国
- ABB Ltd – スイス
- AVEVA Group Plc – 英国
免責事項:上記の企業は、特定の順序でランク付けされているわけではありません。
調査の過程で分析した他の企業:
- ククルス・ゾノス
- スマートフレックス
- コネクソインサイト
- ATLASエネルギー監視システム
- PI システム (AVEVA)
- Net@Suite (エンジニアリング Ingegneria Informatica)
- テラノバ TAMM MDM
- フェランティ MECOMS
- エネルギーワークス
- SAP
- メディデータソリューション
- ラディックスIoT
- エネルギーキャップ
- ハネウェル EIServer
- イートン
メーターデータ管理システム市場のニュースと最近の動向
-
Esyasoftは、
インドおよびその他の国々でスマートメータープロジェクトを実施するため、Adani Energy Solutionsと合弁会社を設立したと発表しました。この提携により、AdaniはEsyasoftのスマートメーターソリューション部門の株式49%を取得します。 -
Landis+Gyrは、
Landis+GyrのMDMSプラットフォームにおけるMDUS認証を取得したと発表しました。この認証更新により、MDUS統合サービスを利用する電力会社顧客は、インターバル課金および時系列課金の新機能を利用できるようになります。Landis+GyrのMDUS(Meter Data Unification and Synchronization:メーターデータ統合および同期)は、スマートメーター環境を電力会社バックオフィスシステムに接続・同期させることで、エンドツーエンドのビジネスプロセスを実現する独自のソリューションです。
メーターデータ管理システム市場レポートの対象範囲と成果物
「メーターデータ管理システム市場規模と予測(2021〜2031年)」レポートでは、以下の分野を網羅した市場の詳細な分析を提供しています。
- メーターデータ管理システムの市場規模と予測(スコープに含まれるすべての主要市場セグメントの世界、地域、国レベル)
- メーターデータ管理システム市場の動向、および推進要因、制約、主要な機会などの市場動向
- 詳細なPEST分析とSWOT分析
- 主要な市場動向、世界および地域の枠組み、主要プレーヤー、規制、最近の市場動向を網羅したメーターデータ管理システム市場分析
- 市場集中、ヒートマップ分析、主要プレーヤー、メーターデータ管理システム市場の最近の動向を網羅した業界の展望と競争分析
- 詳細な企業プロフィール

アンキタは、テクノロジー、メディア、ICT、エレクトロニクス・半導体の各分野で8年以上の経験を持つ、ダイナミックな市場調査およびコンサルティングのプロフェッショナルです。Microsoft、Oracle、NEC、SAP、KPMG、Expeditors Internationalといったグローバルクライアントに対し、100件以上のコンサルティングおよび調査案件を主導・遂行してきました。彼女のコアコンピテンシーは、市場評価、データ分析、予測、戦略策定、競合情報、レポート作成です。
アンキタは、販売前の提案書作成やクライアントとの協議から、販売後の実用的なインサイトの提供まで、プロジェクトサイクル全体を巧みに管理することに長けています。彼女は、部門横断的なチームの管理、複雑な調査モジュールの構築、そしてクライアント固有のビジネス目標に合わせたソリューションの調整に長けています。優れたコミュニケーション能力、リーダーシップ、そしてプレゼンテーション能力により、急速に変化する市場環境において、常に価値主導の成果を生み出しています。
- 過去2年間の分析、基準年、CAGRによる予測(7年間)
- PEST分析とSWOT分析
- 市場規模価値/数量 - 世界、地域、国
- 業界と競争環境
- Excel データセット
お客様の声
Insight PartnersのSCADAシステム市場レポートは包括的で、現在のトレンドと将来の予測に関する貴重な洞察が含まれています。チームは終始、非常にプロフェッショナルで、対応が早く、サポートも充実していました。私たちは彼らのサービスに非常に満足しており、強くお勧めします。
ラン・ケデム パートナー, レアリテクノロジーズ株式会社非常に特殊なソフトウェア市場に関するレポートを依頼したところ、チームは数日でレポートを作成してくれました。情報は非常に関連性が高く、分かりやすくまとめられていました。その後、レポートにいくつか修正と追加を依頼しましたが、チームは非常に迅速に対応し、1週間も経たないうちに最終レポートを受け取ることができました。
ジャン=エルヴェ・ジェン 会長, フューチャー・アナリティカ重要な市場調査と予測のために、The Insight Partnersと協力しました。彼らは機会とリスクに関する明確な洞察を提供し、私たちの計画策定に役立ちました。彼らの調査は使いやすく、確かなデータに基づいており、賢明で自信に満ちた意思決定に役立ちました。彼らを強くお勧めします。
ピユーシュ・ナグパル 上級副社長, ハイビームグローバルInsight Partnersは、深い専門知識に基づき、洞察力に富み、構造化された市場調査を提供しました。チームは終始プロフェッショナルで、対応力も抜群でした。ユーザーフレンドリーなウェブサイトにより、業界レポートへのアクセスもスムーズでした。信頼性の高い高品質な調査サービスをお探しなら、Insight Partnersを強くお勧めします。
安達幸彦 最高経営責任者(CEO), ディープブルーLLC。The Insight Partnersから市場レポートを購入するのは今回が初めてです。最初は不安でしたが、ウェブサイトを見て、リスクを負ってでも購入してみようという気持ちになりました。レポートの品質とカスタマーサービスには大変満足しています。最初のレポートにはいくつか質問やコメントがありましたが、アナリストとメールで何度かやり取りした結果、戦略策定プロセスへのインプットとして活用できるレポートが完成しました。貴重なお時間を割いていただき、貴重な体験をさせていただき、誠にありがとうございました。他の方にもぜひお勧めしたいですし、今後さらに市場データが必要になった際には、まずThe Insight Partnersにご連絡させていただきます。
ジョン・スズキ 社長兼最高経営責任者、取締役, BKテクノロジーズナイジェリアの感染症IVD市場に関する情報提供依頼に対し、ご対応いただいた際、ご尽力とプロフェッショナルな姿勢に深く感謝申し上げます。忍耐強く、的確なアドバイスをいただき、また、最終的に取引成立に至った割引のご提供にも深く感謝申し上げます。今回の最初の出会いで得た強い印象のおかげで、今後もThe Insight Partnersとの連携を心待ちにしております。
チジオケ博士 オニア マネージングディレクター, パインクレストヘルスケア株式会社購入理由
- 情報に基づいた意思決定
- 市場動向の理解
- 競合分析
- 顧客インサイト
- 市場予測
- リスク軽減
- 戦略計画
- 投資の正当性
- 新興市場の特定
- マーケティング戦略の強化
- 業務効率の向上
- 規制動向への対応


 無料サンプルを入手 - メーターデータ管理システム市場