製品分析市場戦略、トッププレーヤー、成長機会、分析、2031年までの予測
過去データ : 2021-2022 | 基準年 : 2023 | 予測期間 : 2024-2031製品分析市場の規模と予測(2021年 - 2031年)、世界および地域のシェア、傾向、成長機会分析レポートの対象範囲:コンポーネント(ソリューションとサービス)、展開(オンプレミスとクラウドベース)、モード(データの追跡とデータ分析)、垂直(小売および消費財、食品および飲料、ヘルスケアおよび医薬品、エネルギーおよび公益事業、自動車、製造、その他)、および地理
- ステータス : 公開されたデータ
- レポートコード : TIPRE00006175
- カテゴリー : テクノロジー、メディア、通信
- ページ数 : 150
- 利用可能なレポート形式 :


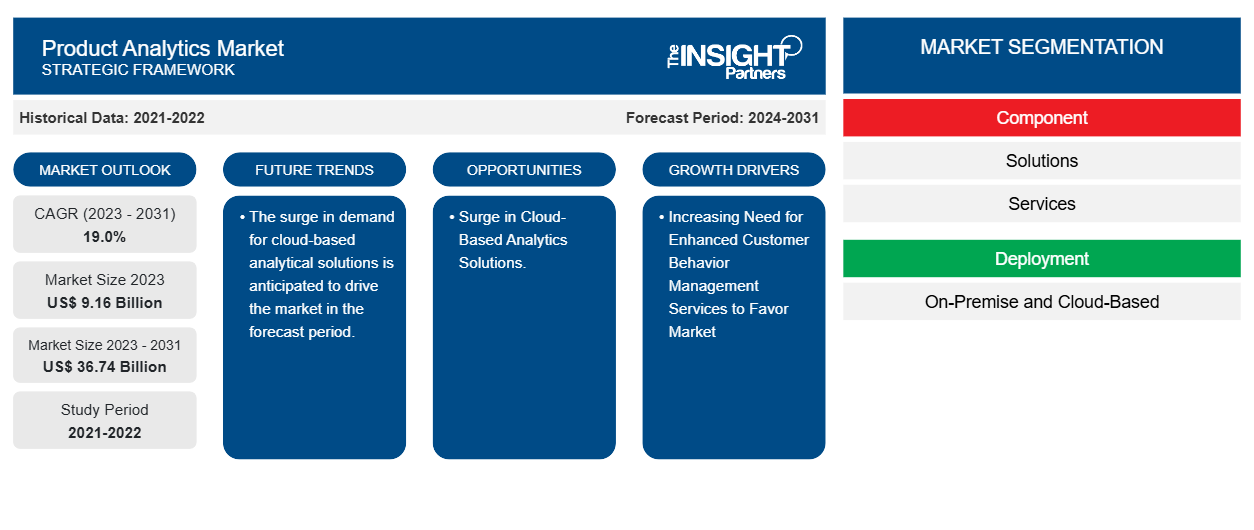
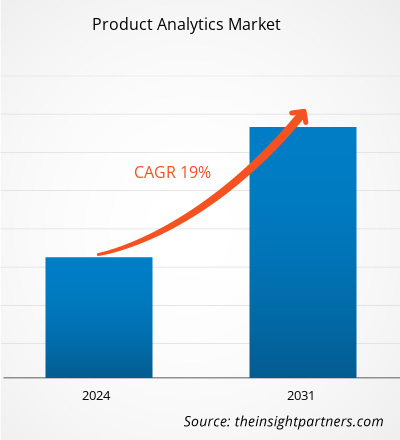
製品分析市場の規模は、2023年の91億6,000万米ドルから2031年には367億4,000万米ドルに達すると予測されています。市場は2023年から2031年の間に19.0%のCAGRを記録すると予想されています。強化された顧客行動管理サービスに対するニーズの高まりと高度なテクノロジーの利用の増加は、市場の主要な推進力とトレンドになる可能性があります。
製品分析 市場分析
製品分析市場は、世界的に著しい成長を遂げています。この成長は、強化された顧客行動管理サービスに対するニーズの高まりや、高度なテクノロジーの利用の増加などの要因に起因しています。さらに、クラウドベースの分析ソリューションに対する需要の急増により、製品分析市場にはさまざまな機会が生まれることが予想されます。
製品分析市場の概要
製品分析は、ユーザーが製品やサービスにどの程度依存しているかを分析する方法です。これにより、製品チームはユーザーのエンゲージメントと行動に関するデータを分析、追跡、視覚化できます。チームはこのデータを使用して、製品やサービスを最適化および改善します。
要件に合わせてレポートをカスタマイズする
このレポートの一部、国レベルの分析、Excelデータパックなど、あらゆるレポートを無料でカスタマイズできます。また、スタートアップや大学向けのお得なオファーや割引もご利用いただけます。
製品分析市場:戦略的洞察
-
このレポートの主要な市場動向を入手してください。この無料サンプルには、市場動向から見積もりや予測に至るまでのデータ分析が含まれます。
製品分析市場の推進要因と機会
市場を有利にするために強化された顧客行動管理サービスの必要性が高まっている
強化された顧客行動管理サービスに対するニーズの高まりは、多くの企業が個々の顧客の好みや行動を理解してパーソナライズされた体験をカスタマイズしていることから、確かに製品分析市場を牽引しています。市場のいくつかの企業は、強化された顧客行動のための製品分析を提供しています。たとえば、2023年3月、AdobeはAdobe Experience Cloudで新しいAdobe Product Analyticsを発表しました。この新しいアプリケーションは、マーケティングと製品全体のカスタマージャーニーインサイトを統合することにより、製品分析カテゴリを再考します。顧客体験に重点を置くチームは初めて、真に統合された顧客ビューの恩恵を受け、組織全体でシームレスにコラボレーションできるようになり、結果として収益性の高い成長を促進できます。
クラウドベースの分析ソリューションの急増。
クラウドベースの分析ソリューションの急増は、さまざまな方法で製品分析市場を牽引する可能性があります。クラウドベースのソリューションは拡張性を備えているため、企業は需要に応じて分析機能を簡単に調整できます。さらに、多くの企業がクラウドベースの分析ソリューションを提供しています。たとえば、SAP Business Technology Platform の一部である SAP Analytics Cloud ソリューションでは、多くの企業があらゆる階級やスキルセットの人々に、ビジネスやコミュニティに重大な結果をもたらす意思決定を行えるようにしています。
製品分析市場レポートセグメンテーション分析
製品分析市場分析の導出に貢献した主要なセグメントは、コンポーネント、展開、モード、垂直です。
- 製品分析市場は、コンポーネントに基づいてソリューションとサービスに分かれています。ソリューションセグメントは、予測期間中に大きな市場シェアを占めると予想されます。
- 展開に基づいて、製品分析市場は追跡データと分析データに分けられます。追跡データセグメントは、予測期間中に大きな市場シェアを占めると予想されます。
- 市場は、業種別に小売・消費財、食品・飲料、ヘルスケア・医薬品、エネルギー・公共事業、自動車、製造業、その他に分類されています。小売・消費財は、予測期間中に大きな市場シェアを占めると予想されます。
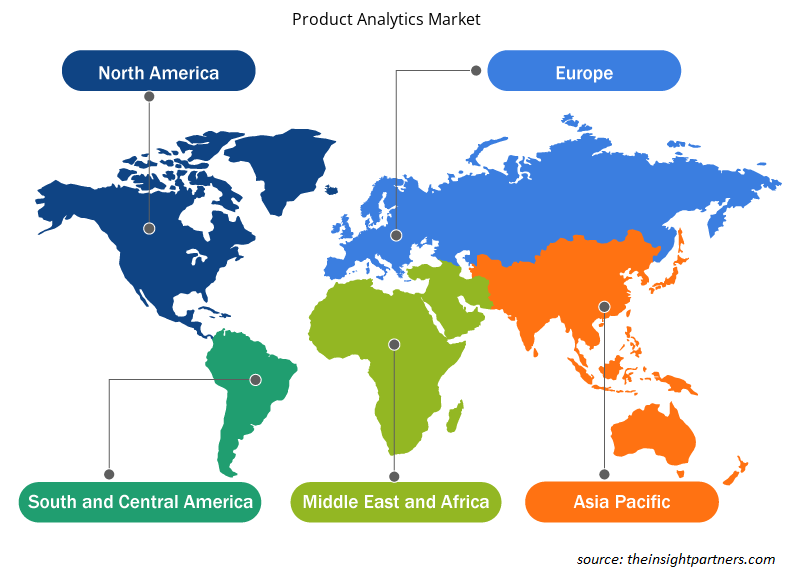
製品分析 地域別市場シェア分析
製品分析市場レポートの地理的範囲は、主に北米、アジア太平洋、ヨーロッパ、中東およびアフリカ、南米および中米の 5 つの地域に分かれています。
北米は製品分析市場を支配してきました。北米地域のさまざまな業界でのハイテク採用の傾向が、製品分析市場の成長を後押ししています。デジタルツールの採用の増加や政府機関による技術支出の増大などの要因が、北米の製品分析市場の成長を牽引すると予想されています。さらに、米国とカナダの先進国では研究開発に重点が置かれているため、北米のプレーヤーは技術的に高度なソリューションを市場に投入せざるを得ません。さらに、米国には、革新的なソリューションの開発にますます重点を置いている製品分析市場のプレーヤーが多数存在します。これらすべての要因が、この地域の製品分析市場の成長に貢献しています。
製品分析 市場 地域分析
予測期間を通じて製品分析市場に影響を与える地域的な傾向と要因は、Insight Partners のアナリストによって徹底的に説明されています。このセクションでは、北米、ヨーロッパ、アジア太平洋、中東およびアフリカ、南米および中米にわたる製品分析市場のセグメントと地理についても説明します。
- 製品分析市場の地域別データを入手
製品分析市場レポートの範囲
| レポート属性 | 詳細 |
|---|---|
| 2023年の市場規模 | 91億6千万米ドル |
| 2031年までの市場規模 | 367.4億米ドル |
| 世界のCAGR(2023年~2031年) | 19.0% |
| 履歴データ | 2021-2022 |
| 予測期間 | 2024-2031 |
| 対象セグメント |
コンポーネント別
|
| 対象地域と国 |
北米
|
| 市場リーダーと主要企業プロフィール |
|
製品分析市場のプレーヤー密度:ビジネスダイナミクスへの影響を理解する
製品分析市場は、消費者の嗜好の変化、技術の進歩、製品の利点に対する認識の高まりなどの要因により、エンドユーザーの需要が高まり、急速に成長しています。需要が高まるにつれて、企業は提供内容を拡大し、消費者のニーズを満たすために革新を起こし、新たなトレンドを活用し、市場の成長をさらに促進しています。
市場プレーヤー密度とは、特定の市場または業界内で活動している企業または会社の分布を指します。これは、特定の市場スペースに、その市場規模または総市場価値に対してどれだけの競合相手 (市場プレーヤー) が存在するかを示します。
製品分析市場で事業を展開している主要企業は次のとおりです。
- 株式会社アンプリチュード
- ゲインサイト
- ヒープ株式会社
- IBMコーポレーション
- ミックスパネル
- 株式会社Pendo.io
免責事項:上記の企業は、特定の順序でランク付けされていません。
- 製品分析市場のトップキープレーヤーの概要を入手
製品分析市場ニュースと最近の動向
製品分析市場は、主要な企業出版物、協会データ、データベースなどの一次調査と二次調査後の定性的および定量的データを収集することによって評価されます。製品分析市場の動向のいくつかを以下に示します。
- 大手学習テクノロジー エコシステムであり Canvas LMS のメーカーでもある Instructure は、AI と分析機能を搭載した新製品 Intelligent Insights をリリースしました。これにより、教育機関では通常利用できないレベルのセルフサービス レポート機能が実現します。(出典: Instructure 企業 Web サイト、2024 年 6 月)
- LSEG(ロンドン証券取引所グループ)とダウ・ジョーンズは、データ、ニュース、分析に関する新たな複数年パートナーシップを発表しました。ダウ・ジョーンズは、ウォール・ストリート・ジャーナル、バロンズ、インベスターズ・ビジネス・デイリー、マーケットウォッチなどのデジタルおよび印刷媒体全体に、LSEGの世界クラスのデータと分析機能を組み込みます。(出典:LSEG企業ウェブサイト、2024年7月)
製品分析市場レポートの対象範囲と成果物
「製品分析市場の規模と予測(2021〜2031年)」レポートでは、以下の分野をカバーする市場の詳細な分析を提供しています。
- 対象範囲に含まれるすべての主要市場セグメントについて、世界、地域、国レベルでの製品分析市場の規模と予測。
- 製品分析の市場動向、および推進要因、制約、主要な機会などの市場動向。
- 詳細な PEST/ポーターの 5 つの力と SWOT 分析。
- 主要な市場動向、世界および地域の枠組み、主要プレーヤー、規制、最近の市場動向を網羅した製品分析市場分析。
- 市場集中、ヒートマップ分析、主要プレーヤー、製品分析市場の最近の動向を網羅した業界の状況と競争分析。
- 詳細な企業プロフィール。

アンキタは、テクノロジー、メディア、ICT、エレクトロニクス・半導体の各分野で8年以上の経験を持つ、ダイナミックな市場調査およびコンサルティングのプロフェッショナルです。Microsoft、Oracle、NEC、SAP、KPMG、Expeditors Internationalといったグローバルクライアントに対し、100件以上のコンサルティングおよび調査案件を主導・遂行してきました。彼女のコアコンピテンシーは、市場評価、データ分析、予測、戦略策定、競合情報、レポート作成です。
アンキタは、販売前の提案書作成やクライアントとの協議から、販売後の実用的なインサイトの提供まで、プロジェクトサイクル全体を巧みに管理することに長けています。彼女は、部門横断的なチームの管理、複雑な調査モジュールの構築、そしてクライアント固有のビジネス目標に合わせたソリューションの調整に長けています。優れたコミュニケーション能力、リーダーシップ、そしてプレゼンテーション能力により、急速に変化する市場環境において、常に価値主導の成果を生み出しています。
- 過去2年間の分析、基準年、CAGRによる予測(7年間)
- PEST分析とSWOT分析
- 市場規模価値/数量 - 世界、地域、国
- 業界と競争環境
- Excel データセット
お客様の声
Insight PartnersのSCADAシステム市場レポートは包括的で、現在のトレンドと将来の予測に関する貴重な洞察が含まれています。チームは終始、非常にプロフェッショナルで、対応が早く、サポートも充実していました。私たちは彼らのサービスに非常に満足しており、強くお勧めします。
ラン・ケデム パートナー, レアリテクノロジーズ株式会社非常に特殊なソフトウェア市場に関するレポートを依頼したところ、チームは数日でレポートを作成してくれました。情報は非常に関連性が高く、分かりやすくまとめられていました。その後、レポートにいくつか修正と追加を依頼しましたが、チームは非常に迅速に対応し、1週間も経たないうちに最終レポートを受け取ることができました。
ジャン=エルヴェ・ジェン 会長, フューチャー・アナリティカ重要な市場調査と予測のために、The Insight Partnersと協力しました。彼らは機会とリスクに関する明確な洞察を提供し、私たちの計画策定に役立ちました。彼らの調査は使いやすく、確かなデータに基づいており、賢明で自信に満ちた意思決定に役立ちました。彼らを強くお勧めします。
ピユーシュ・ナグパル 上級副社長, ハイビームグローバルInsight Partnersは、深い専門知識に基づき、洞察力に富み、構造化された市場調査を提供しました。チームは終始プロフェッショナルで、対応力も抜群でした。ユーザーフレンドリーなウェブサイトにより、業界レポートへのアクセスもスムーズでした。信頼性の高い高品質な調査サービスをお探しなら、Insight Partnersを強くお勧めします。
安達幸彦 最高経営責任者(CEO), ディープブルーLLC。The Insight Partnersから市場レポートを購入するのは今回が初めてです。最初は不安でしたが、ウェブサイトを見て、リスクを負ってでも購入してみようという気持ちになりました。レポートの品質とカスタマーサービスには大変満足しています。最初のレポートにはいくつか質問やコメントがありましたが、アナリストとメールで何度かやり取りした結果、戦略策定プロセスへのインプットとして活用できるレポートが完成しました。貴重なお時間を割いていただき、貴重な体験をさせていただき、誠にありがとうございました。他の方にもぜひお勧めしたいですし、今後さらに市場データが必要になった際には、まずThe Insight Partnersにご連絡させていただきます。
ジョン・スズキ 社長兼最高経営責任者、取締役, BKテクノロジーズナイジェリアの感染症IVD市場に関する情報提供依頼に対し、ご対応いただいた際、ご尽力とプロフェッショナルな姿勢に深く感謝申し上げます。忍耐強く、的確なアドバイスをいただき、また、最終的に取引成立に至った割引のご提供にも深く感謝申し上げます。今回の最初の出会いで得た強い印象のおかげで、今後もThe Insight Partnersとの連携を心待ちにしております。
チジオケ博士 オニア マネージングディレクター, パインクレストヘルスケア株式会社購入理由
- 情報に基づいた意思決定
- 市場動向の理解
- 競合分析
- 顧客インサイト
- 市場予測
- リスク軽減
- 戦略計画
- 投資の正当性
- 新興市場の特定
- マーケティング戦略の強化
- 業務効率の向上
- 規制動向への対応


 無料サンプルを入手 - 製品分析市場