小売実行ソフトウェア市場の洞察と将来の動向(2026~2034年)
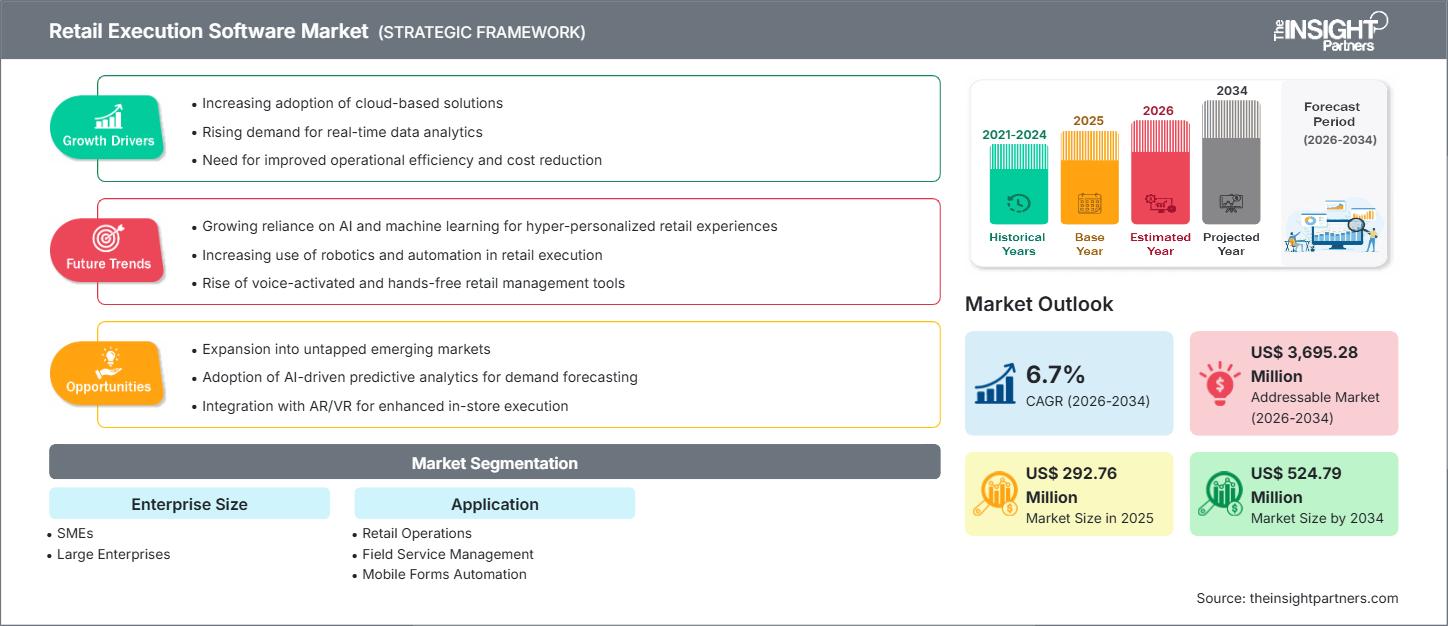
過去データ : 2021-2024 | 基準年 : 2025 | 予測期間 : 2026-2034小売実行ソフトウェア市場の規模と予測(2021年 - 2034年)、世界および地域のシェア、傾向、成長機会分析レポートの対象範囲:企業規模(中小企業および大企業)およびアプリケーション(小売業務、フィールドサービス管理、モバイルフォーム自動化、フィールドセールス、トレードプロモーション管理、従業員エンゲージメントなど)、および地域別
- ステータス : 公開されたデータ
- レポートコード : TIPRE00016464
- カテゴリー : テクノロジー、メディア、通信
- ページ数 : 150
- 利用可能なレポート形式 :


小売実行ソフトウェア市場は、2025年に2億9,276万米ドルと評価されました。2034年には5億2,479万米ドルに達し、2026年から2034年の間に6.7%のCAGRを記録すると予想されています。
小売実行ソフトウェア市場分析
小売施策ソフトウェア市場の予測は、リアルタイム分析、モバイルを活用した現場オペレーション、そして効率的な店舗施策への需要増加に牽引され、力強い成長を示しています。成長を牽引する主要な要因としては、小売業界におけるデジタルトランスフォーメーションの導入拡大、現場チームにおけるタスク自動化のニーズの高まり、そして予測的インサイト獲得のための機械学習の統合などが挙げられます。さらに、従来の手作業による店舗監査からデータドリブンな小売施策プラットフォームへの移行も、市場拡大を牽引しています。
小売実行ソフトウェア市場の概要
小売施策ソフトウェアは、店舗運営、フィールドセールス活動、マーチャンダイジング、コンプライアンス管理を最適化・自動化するために設計されたデジタルソリューションです。これらのプラットフォームは、消費財企業、小売業者、流通業者がフィールドチームの連携、店舗訪問の管理、タスクワークフローの自動化、リアルタイムデータ(棚監査、プロモーションコンプライアンスなど)の収集を行うのに役立ちます。これらのツールは、意思決定の迅速化、手作業によるオーバーヘッドの削減、店舗施策の一貫性向上を実現することで、業務効率を高め、販売実績の向上に貢献します。
要件に合わせてレポートをカスタマイズ
このレポートの一部、国レベルの分析、Excelデータパックなど、あらゆるレポートを無料でカスタマイズできます。また、スタートアップや大学向けのお得なオファーや割引もご利用いただけます。
小売実行ソフトウェア市場:戦略的洞察
-
このレポートの主要な市場動向を入手してください。この無料サンプルには、市場動向から見積もりや予測に至るまでのデータ分析が含まれます。
小売実行ソフトウェア市場の推進要因と機会
市場の推進要因:
- リアルタイムの小売分析情報の需要: 小売業者や消費財企業は、棚のパフォーマンス、製品のコンプライアンス、店舗監査指標をリアルタイムで把握するためにソフトウェアを活用するケースが増えています。
- モバイル フィールド ワークフォースの有効化: フィールド セールス、マーチャンダイジング、店舗チームは、タスクの管理、問題の報告、店舗からの直接データの収集を行うために、モバイル ファーストのアプリケーションを導入しています。
- AI と機械学習の導入: 機械学習は、需要の予測、タスクの割り当ての最適化、実行パターンの特定に使用され、よりスマートな小売の意思決定を促進します。
- 小売業におけるデジタル変革: 実店舗の小売業者が店舗運営をデジタル化するにつれて、ERP、POS、その他のバックエンド システムと統合する実行ソフトウェアの必要性が高まっています。
市場機会:
- クラウドベースの展開: クラウドベースの小売実行ソフトウェアを導入すると、スケーラビリティ、インフラストラクチャ コストの削減、分散チーム間でのリアルタイム同期が実現します。
- 新興市場への拡大: 新興経済国 (インド、中国、ラテンアメリカなど) の小売業者は、店舗運営の合理化と商品化の改善を目的として、小売実行プラットフォームへの投資を増やしています。
- AI 駆動型タスク自動化: プランオグラムコンプライアンス、タスクのスケジュール設定、異常検出に AI 駆動型自動化を組み込むことで、効率性が大幅に向上します。
- 分析と CRM との統合: CRM、分析、トレード プロモーション管理システムと統合された小売実行ソフトウェアは、より高度なビジネス分析情報とパフォーマンスの最適化を提供できます。
小売実行ソフトウェア市場レポートのセグメンテーション分析
市場は、その構造、成長分野、採用傾向を理解するのに役立つようにセグメント化されています。
企業規模別:
- 中小企業
- 大企業
用途別:
- 小売事業
- フィールドサービス管理
- モバイルフォーム自動化
- フィールドセールス
- トレードプロモーションマネジメント
- 従業員エンゲージメント
地理別:
- 北米
- ヨーロッパ
- アジア太平洋
- 中東およびアフリカ(MEA)
- 南米と中央アメリカ
小売実行ソフトウェア市場の地域別分析
予測期間全体を通して小売実行ソフトウェア市場に影響を与える地域的なトレンドと要因は、The Insight Partnersのアナリストによって徹底的に説明されています。このセクションでは、北米、ヨーロッパ、アジア太平洋、中東・アフリカ、中南米における小売実行ソフトウェア市場のセグメントと地域についても説明します。
小売実行ソフトウェア市場レポートの範囲
| レポート属性 | 詳細 |
|---|---|
| 2025年の市場規模 | 2億9,276万米ドル |
| 2034年までの市場規模 | 5億2,479万米ドル |
| 世界のCAGR(2026年~2034年) | 6.7% |
| 履歴データ | 2021-2024 |
| 予測期間 | 2026~2034年 |
| 対象セグメント |
企業規模別
|
| 対象地域と国 |
北米
|
| 市場リーダーと主要企業の概要 |
|
小売実行ソフトウェア市場のプレーヤー密度:ビジネスダイナミクスへの影響を理解する
小売業向けソフトウェア市場は、消費者の嗜好の変化、技術の進歩、製品メリットへの認知度の高まりといった要因によるエンドユーザー需要の高まりに牽引され、急速に成長しています。需要の高まりに伴い、企業は提供内容の拡充、消費者ニーズへの対応のための革新、そして新たなトレンドの活用を進めており、これが市場の成長をさらに加速させています。
- 小売実行ソフトウェア市場のトップキープレーヤーの概要を入手
地域別小売実行ソフトウェア市場シェア分析
- 北米:2019年、北米は市場シェアの約31.13%を占めました。成熟した小売インフラ、モバイル端末導入率の高さ、そして企業の小売システムとの強力な連携が、北米のリーダーシップを支えています。
- 欧州: 確立された CPG および小売チェーン、デジタル的に高度な運用、店舗間での実行の一貫性に対する需要により、大幅な導入が進んでいます。
- アジア太平洋地域(APAC):予測期間中、最も高いCAGRで成長すると予想されます。成長の原動力は、小売業のデジタル化(特に中国とインド)の進展、モバイルファーストのフィールドチームの増加、そしてモダンリテールの拡大です。
- 南米および中米: 従来の小売業の近代化、モバイル導入の増加、分散ネットワーク全体にわたるより優れた実行システムの必要性により、ビジネスチャンスが生まれます。
- 中東およびアフリカ: 小売ネットワークの拡大、テクノロジーへの投資の増加、店舗内のコンプライアンスとパフォーマンス管理の必要性によって新たな可能性が生まれています。
小売実行ソフトウェア市場のプレーヤー密度:ビジネスダイナミクスへの影響を理解する
市場環境は競争が激しく、確立されたエンタープライズ ソフトウェア プロバイダーとニッチな実行ソフトウェアに重点を置いたベンダーが混在しています。
競争上の差別化戦略:
- ERP、CRM、POS システムと統合して総合的な洞察を提供します。
- 現場チーム、タスク自動化、オフライン機能向けに最適化されたモバイルファーストのプラットフォームを提供します。
- インテリジェントなタスク ルーティング、予測分析、異常検出のための AI/ML を組み込みます。
- 中小企業と大企業の両方に対応するためのクラウド展開による拡張性。
小売実行ソフトウェア市場で事業を展開している主要企業:
- ビゾム(モビシー・テクノロジーズ・プライベート・リミテッド)
- EdgeCG(StayinFront株式会社)
- インテリジェンス・リテール
- モビソフト
- ポッププローブ
- スプリングモバイルソリューションズ株式会社
- Trax Technology Solutions Pte Ltd.
- ヴァロムニア
- 勝つ
他の選手の分析
- 返信
- ヨービック
- モビスタ
- ゴースポットチェック
- SAP SE
- IBM
- マイクロソフト
- セールスフォース
- ペペリー
- 最前線に立つ
小売実行ソフトウェア市場のニュースと最近の動向
- プレスリリースによると、機械学習は小売実行ソフトウェア市場の重要なトレンドとして認識されており、現場データの収集と分析の方法に革命をもたらしています。
小売実行ソフトウェア市場レポートの対象範囲と成果物
The Insight Partners による「小売実行ソフトウェア市場予測」レポートでは、以下の内容を取り上げています。
- 2021年から2034年までの市場規模と予測(世界、地域)
- 市場のダイナミクス:推進要因、制約要因、機会、傾向(COVID-19の影響を含む)
- 地域パフォーマンスに関する戦略的洞察(北米、ヨーロッパ、アジア太平洋、中東アフリカ、南米、中米)
- 企業規模によるセグメンテーション(中小企業と大企業)
- アプリケーションベースのセグメンテーション (小売オペレーション、フィールドセールス、トレードプロモーションなど)
- 主要企業の競争環境と企業プロファイリング
- 最近の動向とトレンド分析(AI、機械学習、モバイル)
- SWOT 分析と PEST 分析の可能性あり(Insight Partners のレポートでは一般的ですが、公開概要では完全に詳細化されていません)

アンキタは、テクノロジー、メディア、ICT、エレクトロニクス・半導体の各分野で8年以上の経験を持つ、ダイナミックな市場調査およびコンサルティングのプロフェッショナルです。Microsoft、Oracle、NEC、SAP、KPMG、Expeditors Internationalといったグローバルクライアントに対し、100件以上のコンサルティングおよび調査案件を主導・遂行してきました。彼女のコアコンピテンシーは、市場評価、データ分析、予測、戦略策定、競合情報、レポート作成です。
アンキタは、販売前の提案書作成やクライアントとの協議から、販売後の実用的なインサイトの提供まで、プロジェクトサイクル全体を巧みに管理することに長けています。彼女は、部門横断的なチームの管理、複雑な調査モジュールの構築、そしてクライアント固有のビジネス目標に合わせたソリューションの調整に長けています。優れたコミュニケーション能力、リーダーシップ、そしてプレゼンテーション能力により、急速に変化する市場環境において、常に価値主導の成果を生み出しています。
- 過去2年間の分析、基準年、CAGRによる予測(7年間)
- PEST分析とSWOT分析
- 市場規模価値/数量 - 世界、地域、国
- 業界と競争環境
- Excel データセット
お客様の声
Insight PartnersのSCADAシステム市場レポートは包括的で、現在のトレンドと将来の予測に関する貴重な洞察が含まれています。チームは終始、非常にプロフェッショナルで、対応が早く、サポートも充実していました。私たちは彼らのサービスに非常に満足しており、強くお勧めします。
ラン・ケデム パートナー, レアリテクノロジーズ株式会社非常に特殊なソフトウェア市場に関するレポートを依頼したところ、チームは数日でレポートを作成してくれました。情報は非常に関連性が高く、分かりやすくまとめられていました。その後、レポートにいくつか修正と追加を依頼しましたが、チームは非常に迅速に対応し、1週間も経たないうちに最終レポートを受け取ることができました。
ジャン=エルヴェ・ジェン 会長, フューチャー・アナリティカ重要な市場調査と予測のために、The Insight Partnersと協力しました。彼らは機会とリスクに関する明確な洞察を提供し、私たちの計画策定に役立ちました。彼らの調査は使いやすく、確かなデータに基づいており、賢明で自信に満ちた意思決定に役立ちました。彼らを強くお勧めします。
ピユーシュ・ナグパル 上級副社長, ハイビームグローバルInsight Partnersは、深い専門知識に基づき、洞察力に富み、構造化された市場調査を提供しました。チームは終始プロフェッショナルで、対応力も抜群でした。ユーザーフレンドリーなウェブサイトにより、業界レポートへのアクセスもスムーズでした。信頼性の高い高品質な調査サービスをお探しなら、Insight Partnersを強くお勧めします。
安達幸彦 最高経営責任者(CEO), ディープブルーLLC。The Insight Partnersから市場レポートを購入するのは今回が初めてです。最初は不安でしたが、ウェブサイトを見て、リスクを負ってでも購入してみようという気持ちになりました。レポートの品質とカスタマーサービスには大変満足しています。最初のレポートにはいくつか質問やコメントがありましたが、アナリストとメールで何度かやり取りした結果、戦略策定プロセスへのインプットとして活用できるレポートが完成しました。貴重なお時間を割いていただき、貴重な体験をさせていただき、誠にありがとうございました。他の方にもぜひお勧めしたいですし、今後さらに市場データが必要になった際には、まずThe Insight Partnersにご連絡させていただきます。
ジョン・スズキ 社長兼最高経営責任者、取締役, BKテクノロジーズナイジェリアの感染症IVD市場に関する情報提供依頼に対し、ご対応いただいた際、ご尽力とプロフェッショナルな姿勢に深く感謝申し上げます。忍耐強く、的確なアドバイスをいただき、また、最終的に取引成立に至った割引のご提供にも深く感謝申し上げます。今回の最初の出会いで得た強い印象のおかげで、今後もThe Insight Partnersとの連携を心待ちにしております。
チジオケ博士 オニア マネージングディレクター, パインクレストヘルスケア株式会社購入理由
- 情報に基づいた意思決定
- 市場動向の理解
- 競合分析
- 顧客インサイト
- 市場予測
- リスク軽減
- 戦略計画
- 投資の正当性
- 新興市場の特定
- マーケティング戦略の強化
- 業務効率の向上
- 規制動向への対応


 無料サンプルを入手 - 小売実行ソフトウェア市場