소매 실행 소프트웨어 시장 분석 및 향후 동향(2025~2031년)
이전 데이터 : 2021-2024 | 기준 연도 : 2025 | 예측 기간 : 2026-2034소매 실행 소프트웨어 시장 규모 및 전망(2021~2034), 글로벌 및 지역별 점유율, 트렌드 및 성장 기회 분석 보고서 범위: 기업 규모(중소기업 및 대기업), 애플리케이션(소매 운영, 현장 서비스 관리, 모바일 양식 자동화, 현장 판매, 판촉 관리, 직원 참여 등) 및 지역별
- 상태 : 데이터 공개
- 보고서 코드 : TIPRE00016464
- 범주 : 기술, 미디어 및 통신
- 페이지 수 : 150
- 사용 가능한 보고서 형식 :


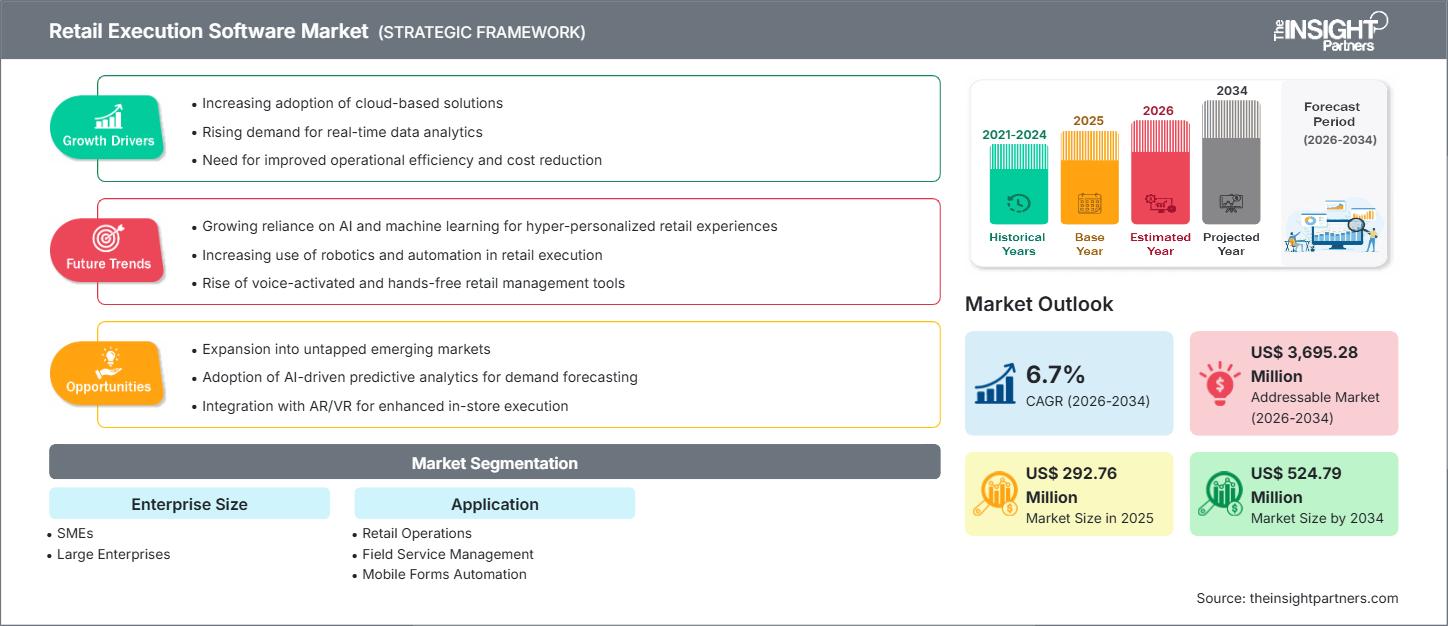
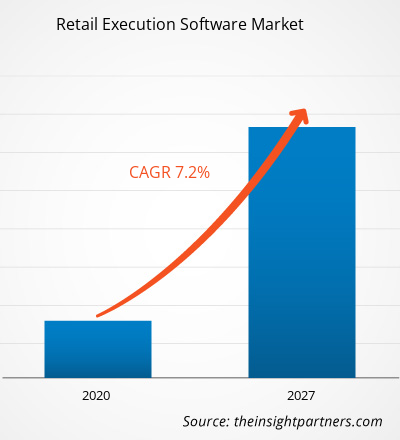
소매 판매 실행 소프트웨어 시장은 2025년에 2억 9,276만 달러 규모였으며, 2034년에는 5억 2,479만 달러에 이를 것으로 예상됩니다. 2026년부터 2034년까지 연평균 성장률(CAGR)은 6.7%입니다.
소매 실행 소프트웨어 시장 분석
소매 실행 소프트웨어 시장은 실시간 분석, 모바일 현장 운영 및 효율적인 매장 내 실행에 대한 수요 증가에 힘입어 강력한 성장을 보일 것으로 전망됩니다. 주요 성장 동력으로는 소매업계의 디지털 전환 확산, 현장 팀의 업무 자동화에 대한 필요성 증가, 예측 분석을 위한 머신러닝 통합 등이 있습니다. 또한, 기존의 수동 매장 감사 방식에서 데이터 기반 소매 실행 플랫폼으로의 전환이 시장 확대를 견인하고 있습니다.
소매 실행 소프트웨어 시장 개요
소매 실행 소프트웨어는 매장 운영, 현장 영업 활동, 상품 진열 및 규정 준수 관리를 최적화하고 자동화하도록 설계된 디지털 솔루션입니다. 이러한 플랫폼은 소비재 기업, 소매업체 및 유통업체가 현장 팀을 조정하고, 매장 방문을 관리하고, 작업 워크플로를 자동화하고, 실시간 데이터(예: 진열대 점검, 프로모션 준수 여부)를 수집하는 데 도움을 줍니다. 이러한 도구는 의사 결정 속도를 높이고, 수작업 부담을 줄이며, 매장 운영의 일관성을 향상시켜 운영 효율성을 높이고 매출 증대를 이끌어냅니다.
이 보고서를 귀하의 요구사항에 맞게 맞춤 설정하십시오.
모든 보고서에 대한 맞춤형 서비스(본 보고서의 일부 내용, 국가별 분석, Excel 데이터 팩 포함)를 무료로 제공해 드립니다. 또한 스타트업 및 대학을 위한 다양한 할인 혜택도 누리실 수 있습니다.
소매 실행 소프트웨어 시장: 전략적 통찰
-
이 보고서에서 주요 시장 동향을 확인하세요.이 무료 샘플에는 시장 동향부터 추정치 및 예측에 이르기까지 다양한 데이터 분석이 포함됩니다.
소매 실행 소프트웨어 시장 동인 및 기회
시장 동인:
- 실시간 소매 시장 분석 정보 수요 증가: 소매업체와 소비재 기업들은 진열대 실적, 제품 규정 준수, 매장 감사 지표 등을 실시간으로 파악하기 위해 소프트웨어를 점점 더 많이 활용하고 있습니다.
- 모바일 현장 인력 지원: 현장 영업, 상품 기획 및 매장 팀은 모바일 우선 애플리케이션을 도입하여 업무를 관리하고, 문제를 보고하고, 매장에서 직접 데이터를 수집하고 있습니다.
- AI 및 머신러닝 도입: 머신러닝은 수요 예측, 작업 할당 최적화, 실행 패턴 파악에 활용되어 더욱 스마트한 소매업 의사결정을 지원합니다.
- 소매업의 디지털 전환: 오프라인 소매업체들이 매장 운영을 디지털화함에 따라 ERP, POS 및 기타 백엔드 시스템과 통합되는 실행 소프트웨어에 대한 필요성이 증가하고 있습니다.
시장 기회:
- Cloud-Based Deployment: The adoption of cloud-based retail execution software offers scalability, lower infrastructure costs, and real-time synchronization across distributed teams.
- Expansion in Emerging Markets: Retailers in emerging economies (e.g., India, China, Latin America) are increasingly investing in retail execution platforms to streamline in-store operations and improve merchandising.
- AI-Driven Task Automation: Incorporating AI-driven automation for planogram compliance, task scheduling, and anomaly detection presents significant efficiency gains.
- Integration with Analytics & CRM: Retail execution software integrated with CRM, analytics, and trade promotion management systems can provide higher-level business insights and performance optimization.
Retail Execution Software Market Report Segmentation Analysis
The market is segmented to help understand its structure, growth areas, and adoption trends:
By Enterprise Size:
- SMEs
- Large Enterprises
By Application:
- Retail Operations
- Field Service Management
- Mobile Forms Automation
- Field Sales
- Trade Promotion Management
- Employee Engagement
By Geography:
- North America
- Europe
- Asia Pacific
- Middle East & Africa (MEA)
- South & Central America
Retail Execution Software Market Regional Insights
The regional trends and factors influencing the Retail Execution Software Market throughout the forecast period have been thoroughly explained by the analysts at The Insight Partners. This section also discusses Retail Execution Software Market segments and geography across North America, Europe, Asia Pacific, Middle East and Africa, and South and Central America.
Retail Execution Software Market Report Scope
| Report Attribute | Details |
|---|---|
| Market size in 2025 | US$ 292.76 Million |
| Market Size by 2034 | US$ 524.79 Million |
| Global CAGR (2026 - 2034) | 6.7% |
| Historical Data | 2021-2024 |
| Forecast period | 2026-2034 |
| Segments Covered |
By Enterprise Size
|
| Regions and Countries Covered |
North America
|
| Market leaders and key company profiles |
|
Retail Execution Software Market Players Density: Understanding Its Impact on Business Dynamics
The Retail Execution Software Market is growing rapidly, driven by increasing end-user demand due to factors such as evolving consumer preferences, technological advancements, and greater awareness of the product's benefits. As demand rises, businesses are expanding their offerings, innovating to meet consumer needs, and capitalizing on emerging trends, which further fuels market growth.
- Get the Retail Execution Software Market top key players overview
Retail Execution Software Market Share Analysis by Geography
- North America: In 2019, North America held ~31.13% of the market. Its leadership is driven by mature retail infrastructure, high mobile-field workforce adoption, and strong integration with enterprise retail systems.
- Europe: Significant adoption due to established CPG and retail chains, digitally advanced operations, and demand for execution consistency across stores.
- Asia Pacific (APAC): Expected to grow at the highest CAGR during the forecast period. Growth driven by rising retail digitization (especially in China & India), proliferation of mobile-first field teams, and expanding modern retail.
- South & Central America: Opportunities due to the modernization of traditional retail, increasing mobile adoption, and the need for better execution systems across distributed networks.
- Middle East & Africa: Emerging potential driven by retail network expansion, increasing investment in technology, and the need for in-store compliance and performance management.
Retail Execution Software Market Players Density: Understanding Its Impact on Business Dynamics
There is a competitive market landscape, with a mix of established enterprise software providers and niche execution‑software-focused vendors.
Competitive Differentiation Strategies:
- Integrating with ERP, CRM, and POS systems to provide holistic insights.
- Offering mobile-first platforms optimized for field teams, task automation, and offline capability.
- Embedding AI/ML for intelligent task routing, predictive analytics, and anomaly detection.
- Scalability via cloud deployments to serve both SMEs and large enterprises.
Major Companies Operating in the Retail Execution Software Market:
- Bizom (Mobisy Technologies Private Limited)
- EdgeCG (StayinFront, Inc.)
- Intelligence Retail
- Mobisoft
- POPProbe
- Spring Mobile Solutions, Inc.
- Trax Technology Solutions Pte Ltd.
- Valomnia
- WINIT
Other players analysed
- Repsly
- YOOBIC
- Movista
- GoSpotCheck
- SAP SE
- IBM
- Microsoft
- Salesforce
- Pepperi
- StayinFront
Retail Execution Software Market News and Recent Developments
- According to press releases, machine learning is identified as a key trend for the retail execution software market, revolutionizing how field data is collected and analyzed.
Retail Execution Software Market Report Coverage and Deliverables
The “Retail Execution Software Market Forecast” report by The Insight Partners covers:
- Market size and forecast (global, regional) from 2021–2034
- Market dynamics: drivers, restraints, opportunities, and trends (including COVID‑19 impact)
- Strategic insights into regional performance (North America, Europe, APAC, MEA, South & Central America)
- Enterprise-size segmentation (SMEs vs. Large Enterprises)
- Application-based segmentation (Retail Ops, Field Sales, Trade Promotion, etc.)
- Competitive landscape and company profiling of major players
- Recent developments and trend analysis (AI, machine learning, mobile)
- SWOT 및 PEST 분석이 포함될 수 있습니다(인사이트 파트너 보고서에서 흔히 볼 수 있지만, 공개 요약본에는 자세히 나와 있지 않습니다).

안키타는 기술, 미디어, 정보통신기술(ICT), 전자 및 반도체 분야에서 8년 이상의 경력을 보유한 역동적인 시장 조사 및 컨설팅 전문가입니다. Microsoft, Oracle, NEC Corporation, SAP, KPMG, Expeditors International 등 글로벌 고객을 대상으로 100건 이상의 컨설팅 및 조사 업무를 성공적으로 이끌고 수행했습니다. 그녀의 핵심 역량은 시장 평가, 데이터 분석, 예측, 전략 수립, 경쟁 정보 분석, 보고서 작성입니다.
안키타는 사전 판매 제안서 설계 및 고객 논의부터 실행 가능한 인사이트의 사후 판매까지 전체 프로젝트 주기를 능숙하게 처리합니다. 또한, 여러 부서의 팀을 관리하고, 복잡한 조사 모듈을 구성하며, 고객별 비즈니스 목표에 맞춰 솔루션을 조정하는 데 능숙합니다. 뛰어난 의사소통, 리더십, 그리고 프레젠테이션 능력을 바탕으로 빠르게 변화하는 시장 환경에서도 가치 중심의 성과를 꾸준히 달성해 왔습니다.
- 과거 분석(2년), 기준 연도, CAGR을 포함한 예측(7년)
- PEST 및 SWOT 분석
- 시장 규모 가치/거래량 - 글로벌, 지역, 국가
- 산업 및 경쟁 환경
- Excel 데이터세트
사용 후기
Insight Partners의 SCADA 시스템 시장 보고서는 포괄적이며, 현재 동향과 미래 전망에 대한 귀중한 통찰력을 제공합니다. 팀은 매우 전문적이고, 신속하게 대응하며, 처음부터 끝까지 지원해 주었습니다. 저희는 매우 만족하며 Insight Partners의 서비스를 적극 추천합니다.
란 케뎀 파트너, Reali Technologies LTDs아주 구체적인 소프트웨어 시장에 대한 보고서를 요청했는데, 팀에서 며칠 만에 보고서를 작성해 주셨습니다. 정보는 매우 관련성이 높고 잘 정리되어 있었습니다. 그 후 보고서에 몇 가지 수정과 추가 사항을 요청했습니다. 팀원들의 응답도 매우 빨랐고, 일주일도 채 되지 않아 최종 보고서를 받았습니다.
장-에르브 젠 의장, 퓨처 애널리티카The Insight Partners와 함께 중요한 시장 조사 및 예측 작업을 진행했습니다. Insight Partners는 기회와 위험에 대한 명확한 통찰력을 제공하여 계획을 세우는 데 큰 도움이 되었습니다. The Insight Partners의 조사는 사용하기 쉬웠고, 탄탄한 데이터를 기반으로 했습니다. 덕분에 현명하고 자신 있는 결정을 내릴 수 있었습니다. The Insight Partners를 강력 추천합니다.
피유시 나그팔 수석 부사장, 하이빔 글로벌Insight Partners는 탄탄한 분야 전문성을 바탕으로 통찰력 있고 체계적인 시장 조사를 제공했습니다. Insight Partners 팀은 처음부터 끝까지 전문적이고 신속하게 대응했습니다. 사용자 친화적인 웹사이트 덕분에 업계 보고서에 쉽게 접근할 수 있었습니다. 신뢰할 수 있고 고품질의 조사 서비스를 원하신다면 Insight Partners를 강력 추천합니다.
아다치 유키히코 대표이사, 딥블루 주식회사The Insight Partners에서 시장 보고서를 구매한 것은 이번이 처음입니다. 처음에는 확신이 없었지만, 웹사이트를 방문하고 나서 위험을 감수하고 시장 보고서를 구매하는 것이 더 편하다는 것을 알게 되었습니다. 보고서의 품질과 고객 서비스에 매우 만족합니다. 처음 보고서를 보고 몇 가지 질문과 의견이 있었지만, 분석가와 이메일로 몇 차례 대화를 나눈 후, 전략 기획 과정에 참고할 수 있는 보고서를 확보했다고 생각합니다. 시간을 내어 긍정적인 경험을 선사해 주셔서 정말 감사합니다. 다른 사람들에게도 귀사의 서비스를 적극 추천할 것이며, 추가적인 시장 데이터가 필요할 때면 가장 먼저 귀사에 연락하겠습니다.
존 스즈키 사장 겸 최고 경영자, 이사회 이사, BK 테크놀로지스나이지리아 감염성 질환 IVD 시장 관련 정보 요청에 응해 주신 귀사의 지원과 전문성에 감사드립니다. 귀사의 인내심과 지도, 그리고 할인 혜택을 기꺼이 제공해 주셔서 결국 계약을 성사시킬 수 있었습니다. 첫 만남을 통해 귀사가 저에게 심어주신 좋은 인상을 바탕으로 앞으로도 The Insight Partners와 함께할 수 있기를 기대합니다.
치지오케 박사 오니아 전무이사, 파인크레스트 헬스케어 유한회사구매 이유
- 정보에 기반한 의사 결정
- 시장 역학 이해
- 경쟁 분석
- 고객 인사이트
- 시장 예측
- 위험 완화
- 전략 기획
- 투자 타당성 분석
- 신흥 시장 파악
- 마케팅 전략 강화
- 운영 효율성 향상
- 규제 동향에 발맞춰 대응


 무료 샘플 받기 - 소매 실행 소프트웨어 시장