
鉄道車両管理市場の成長、規模、シェア、傾向、主要プレーヤーの分析、2028年までの予測
鉄道車両管理市場の規模と予測(2020年 - 2028年)、世界および地域シェア、傾向、成長機会分析レポートの対象範囲:管理タイプ(鉄道管理およびインフラ管理)および保守サービス(是正保守、予防保守、予測保守)別
- ステータス : 出版
- レポートコード : TIPRE00006444
- カテゴリー : 自動車・輸送
- ページ数 : 180
- 利用可能なレポート形式 :


- 最終更新日 : June 17, 2024

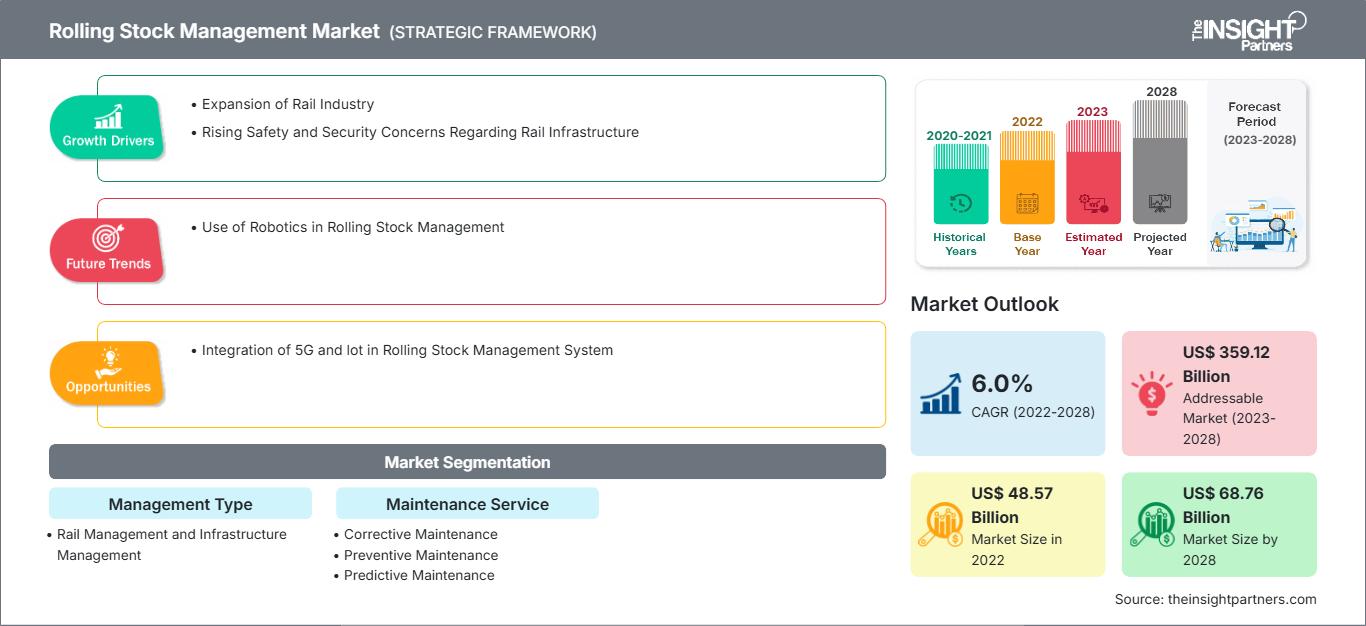
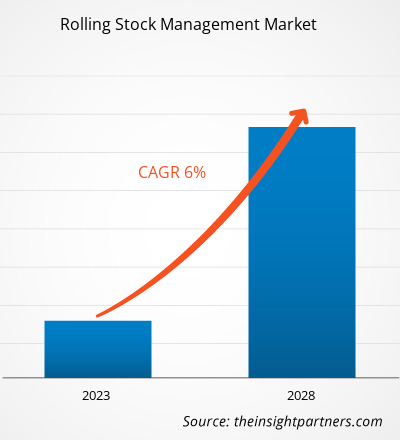
[調査レポート] 鉄道車両管理市場は2022年に485億7,146万米ドルと評価され、2028年には687億6,196万米ドルに達すると見込まれています。また、2022年から2028年にかけて6.0%のCAGRを記録すると予測されています。
アナリストの視点:
鉄道車両とは、動力車と非動力車の両方を含む鉄道車両を指します。線路上を移動できるあらゆる鉄道車両を指します。鉄道車両のメンテナンス、情報追跡、および管理は、鉄道車両管理システムの主要な機能です。車両の走行に関する情報だけでなく、故障や検査の記録も維持します。また、製造から主要な装備品に関する情報まで、鉄道車両の記録を保存します。車両の履歴ログを管理することで、作業員は車両の点検や整備の際に効率的に作業を進めることができます。さらに、このシステムは、運行管理システム、資材・会計システム、輸送計画などと情報を統合的に連携させることにも役立ちます。したがって、車両管理システムは、車両と鉄道業界の最適なパフォーマンスを決定するために不可欠です。
市場概要:車両管理市場
鉄道業界の成長は、車両管理市場の成長を牽引する大きな要因の一つです。新しい鉄道駅の開設や鉄道網の拡張が増えるにつれて、車両、そのルート、メンテナンスを管理するための効率的な車両管理システムの必要性が生じています。
主要な駅と鉄道拡張プロジェクトのいくつかを以下に紹介します。
- 2022年3月、サウジアラビア鉄道(SAR)は、北行き旅客列車の運行開始計画に基づき、アルクライヤット旅客駅を開業しました。
- 2023年3月、インド中央鉄道(CR)局は、ムンバイのローカル列車に対応するために6つの新しい郊外鉄道駅を建設する計画を発表しました。CRムンバイには80の駅があり、これらの6つの駅が加わると、その数は86になります。
要件に合わせてレポートをカスタマイズ
レポートの一部、国レベルの分析、Excelデータパックなどを含め、スタートアップ&大学向けに特別オファーや割引もご利用いただけます(無償)
鉄道車両管理市場: 戦略的洞察
-
このレポートの主要な市場動向を入手してください。この無料サンプルには、市場動向から見積もりや予測に至るまでのデータ分析が含まれます。
市場の牽引役:鉄道車両管理市場
鉄道業界の拡大
輸送サービスの改善に対する需要は、世界中で急速に高まっています。国際エネルギー機関(IEA)によると、2019年と比較して、旅客および貨物の活動は2050年までに倍増すると予想されています。世界銀行グループによると、鉄道は旅客および貨物を輸送する最も効率的な方法の1つと考えられています。輸送活動の増加により、世界銀行グループは鉄道産業の発展に投資し、より効率的にしています。多くの組織が、さまざまな開発途上国の政府に対して、鉄道インフラの改革と鉄道を国の輸送ネットワークに組み込むための支援を行っています。さらに、開発途上国の政府は鉄道産業の促進に投資しています。インドブランドエクイティ財団によると、2030年までに、同国は鉄道インフラと開発に約7,154.1億米ドルを投資する予定です。増加する旅客・貨物輸送を管理するため、各国は鉄道インフラの拡張を進めています。例えば、2022年9月には、コネチカット州運輸局(CTDOT)が米国ハートフォード郡に新しい駅を開設しました。また、2022年1月には、サウジアラビアの投資大臣が鉄道網を8,000km拡大するという目標を発表しました。鉄道車両管理システムは、鉄道車両の最適なパフォーマンスを向上させるのに役立ちます。鉄道産業の拡大と発展の高まりは、機関車、貨車、旅客列車などの鉄道車両の需要を生み出しており、効率的な鉄道車両管理システムの需要をさらに高めています。
セグメント分析:鉄道車両管理市場
管理タイプに基づいて、鉄道車両管理市場は鉄道管理とインフラに分かれています。保守サービスに基づいて、鉄道車両管理市場は事後保守、予防保守、予測保守に分類されます。地理的に見ると、鉄道車両管理市場は北米、ヨーロッパ、アジア太平洋、中東およびアフリカ、南米に分割されています。
地域分析:鉄道車両管理市場
鉄道車両管理市場は、北米、ヨーロッパ、アジア太平洋(APAC)、中東およびアフリカ(MEA)、南米(SAM)の5つの主要地域に分類されています。世界的な航空鉄道車両管理市場の成長は、旅客輸送量の増加と鉄道駅の増加に起因しています。従来の鉄道ネットワークのほとんどは、北米、ヨーロッパ、APACにあります。2019年の連邦運輸局データによると、これらの地域は従来の鉄道における世界の旅客移動の約90%を占めており、インドが39%でトップ、中国が27%、日本が11%、欧州連合が9%と続いています。インフラと乗客数の増加により、増加する保守サービスの需要に対応するためにこれらの鉄道車両を調達する必要性が生じています。このように、鉄道駅数の増加は、鉄道と駅間の効率、信頼性、安全性のための車両管理サービスの需要を押し上げ、車両管理市場を活性化させています。
主要プレーヤー分析:車両管理市場
車両管理市場で活動している主要プレーヤーには、Alstom SA、Hitachi Rail Ltd、ABB Ltd、Mitsubishi Electric Corp、Siemens Mobility GmbH、Talgo SA、Thales SA、Toshiba Infrastructure Systems and Solutions Corp、Trimble Inc、LocoTech LLCなどがあります。多くの企業が、車両の精度、運用効率、タイムリーな注文履行に関連する改善の可能性を求めて、車両管理に投資しています。
鉄道車両管理市場の地域別分析
The Insight Partnersのアナリストは、予測期間を通じて鉄道車両管理市場に影響を与える地域的な傾向と要因を詳細に解説しています。このセクションでは、北米、ヨーロッパ、アジア太平洋、中東・アフリカ、中南米における鉄道車両管理市場のセグメントと地域についても解説しています。
鉄道車両管理市場レポートの範囲
| レポート属性 | 詳細 |
|---|---|
| の市場規模 2022 | US$ 48.57 Billion |
| 市場規模別 2028 | US$ 68.76 Billion |
| 世界的なCAGR (2022 - 2028) | 6.0% |
| 過去データ | 2020-2021 |
| 予測期間 | 2023-2028 |
| 対象セグメント |
By 経営管理タイプ
|
| 対象地域と国 |
北米
|
| 市場リーダーと主要企業の概要 |
|
鉄道車両管理市場のプレーヤー密度:ビジネスダイナミクスへの影響を理解する
鉄道車両管理市場は、消費者の嗜好の変化、技術の進歩、製品メリットへの認知度の向上といった要因によるエンドユーザーの需要増加に牽引され、急速に成長しています。需要の増加に伴い、企業は提供内容の拡充、消費者ニーズへの対応のための革新、そして新たなトレンドの活用を進めており、これが市場の成長をさらに加速させています。
- 入手 鉄道車両管理市場 主要プレーヤーの概要
鉄道車両管理市場では、合併や買収などの無機的および有機的な戦略が企業に広く採用されています。鉄道車両管理市場の最近の主要な動向をいくつか以下に示します。
- 2023年、アルストムはニューヨーク・ニュージャージー港湾局およびニューアーク・リバティー国際空港と契約を締結し、2030年1月までの7年間、同社のInnoviaモノレールシステム(AirTrain Newark)の運用・保守サービスを提供しています。この契約の価値は2億6,000万米ドルを超え、1年間の追加オプションも含まれています。
- 2023年、ABBはスイスとスウェーデンに拠点を置く多国籍企業であるStadlerから、300台以上の新型列車と機関車に電力を供給する1億7,000万米ドルの注文を受けました。これらの列車は、英国、スペイン、ポルトガル、ドイツ、オーストリアなどの国々や、いくつかの欧州鉄道路線において、鉄道輸送の近代化と強化のため、様々な欧州鉄道網で使用されました。
- 2023年、シーメンス・モビリティは1,200台の電気機関車を納入し、35年間のフルサービス保守を約束しました。これは、シーメンス・モビリティとシーメンス・インドの歴史上、単一の機関車発注としては最大規模とされています。これにより、シーメンス・モビリティは市場における地位を強化しました。
- 2022年、タレスは、英国の鉄道網を線路作業員、列車乗務員、そして乗客にとってより安全なものにする新しい列車技術を関係者に実演しました。タレスは、ネットワーク・レールおよびウェスト・サマセット鉄道(WSR)と協力し、列車防護警報システム - 常時監視(TPWS-CS)のライブデモンストレーションを実施しました。

Naveenは、カスタム、シンジケート、コンサルティングの各プロジェクトにおいて9年以上の実績を持つ、経験豊富な市場調査およびコンサルティングのプロフェッショナルです。現在はアソシエイトバイスプレジデントを務め、プロジェクトバリューチェーン全体にわたるステークホルダー管理を成功させ、100件以上の調査レポートと30件以上のコンサルティング案件を執筆しています。産業および政府機関のプロジェクトに幅広く携わり、クライアントの成功とデータに基づく意思決定に大きく貢献しています。
Naveenは、カルナータカ州VTUで電子通信工学の学位を取得し、マニパル大学でマーケティング&オペレーションズのMBAを取得しています。IEEEの会員として9年間活動し、会議や技術シンポジウムへの参加、セクションレベルおよび地域レベルでのボランティア活動に積極的に取り組んでいます。現職以前は、IndustryARCでアソシエイト戦略コンサルタント、Hewlett Packard(HP Global)で産業用サーバーコンサルタントを務めていました。
- 包括的な市場規模および予測分析
- 詳細なセグメンテーション分析
- 市場動向(ダイナミクス)の徹底的な評価
- 地域および国別のインサイト
- 競争環境および企業ベンチマーク
- 戦略的ビジネスインテリジェンス
お客様の声
Insight PartnersのSCADAシステム市場レポートは包括的で、現在のトレンドと将来の予測に関する貴重な洞察が含まれています。チームは終始、非常にプロフェッショナルで、対応が早く、サポートも充実していました。私たちは彼らのサービスに非常に満足しており、強くお勧めします。
ラン・ケデム パートナー, レアリテクノロジーズ株式会社非常に特殊なソフトウェア市場に関するレポートを依頼したところ、チームは数日でレポートを作成してくれました。情報は非常に関連性が高く、分かりやすくまとめられていました。その後、レポートにいくつか修正と追加を依頼しましたが、チームは非常に迅速に対応し、1週間も経たないうちに最終レポートを受け取ることができました。
ジャン=エルヴェ・ジェン 会長, フューチャー・アナリティカ重要な市場調査と予測のために、The Insight Partnersと協力しました。彼らは機会とリスクに関する明確な洞察を提供し、私たちの計画策定に役立ちました。彼らの調査は使いやすく、確かなデータに基づいており、賢明で自信に満ちた意思決定に役立ちました。彼らを強くお勧めします。
ピユーシュ・ナグパル 上級副社長, ハイビームグローバルInsight Partnersは、深い専門知識に基づき、洞察力に富み、構造化された市場調査を提供しました。チームは終始プロフェッショナルで、対応力も抜群でした。ユーザーフレンドリーなウェブサイトにより、業界レポートへのアクセスもスムーズでした。信頼性の高い高品質な調査サービスをお探しなら、Insight Partnersを強くお勧めします。
安達幸彦 最高経営責任者(CEO), ディープブルーLLC。The Insight Partnersから市場レポートを購入するのは今回が初めてです。最初は不安でしたが、ウェブサイトを見て、リスクを負ってでも購入してみようという気持ちになりました。レポートの品質とカスタマーサービスには大変満足しています。最初のレポートにはいくつか質問やコメントがありましたが、アナリストとメールで何度かやり取りした結果、戦略策定プロセスへのインプットとして活用できるレポートが完成しました。貴重なお時間を割いていただき、貴重な体験をさせていただき、誠にありがとうございました。他の方にもぜひお勧めしたいですし、今後さらに市場データが必要になった際には、まずThe Insight Partnersにご連絡させていただきます。
ジョン・スズキ 社長兼最高経営責任者、取締役, BKテクノロジーズナイジェリアの感染症IVD市場に関する情報提供依頼に対し、ご対応いただいた際、ご尽力とプロフェッショナルな姿勢に深く感謝申し上げます。忍耐強く、的確なアドバイスをいただき、また、最終的に取引成立に至った割引のご提供にも深く感謝申し上げます。今回の最初の出会いで得た強い印象のおかげで、今後もThe Insight Partnersとの連携を心待ちにしております。
チジオケ博士 オニア マネージングディレクター, パインクレストヘルスケア株式会社購入理由
- 情報に基づいた意思決定
- 市場動向の理解
- 競合分析
- 顧客インサイト
- 市場予測
- リスク軽減
- 戦略計画
- 投資の正当性
- 新興市場の特定
- マーケティング戦略の強化
- 業務効率の向上
- 規制動向への対応


