ゴムタイヤ式ガントリークレーン市場戦略、トッププレーヤー、成長機会、分析、2027年までの予測
過去データ : 2017-2018 | 基準年 : 2019 | 予測期間 : 2020-20272027年までのゴムタイヤ式ガントリークレーン市場予測 - COVID-19の影響とタイプ別(8輪車と16輪車)、電源別(ディーゼル、電気、ハイブリッド)のグローバル分析
- ステータス : 出版
- レポートコード : TIPRE00011041
- カテゴリー : 自動車・輸送
- ページ数 : 145
- 利用可能なレポート形式 :


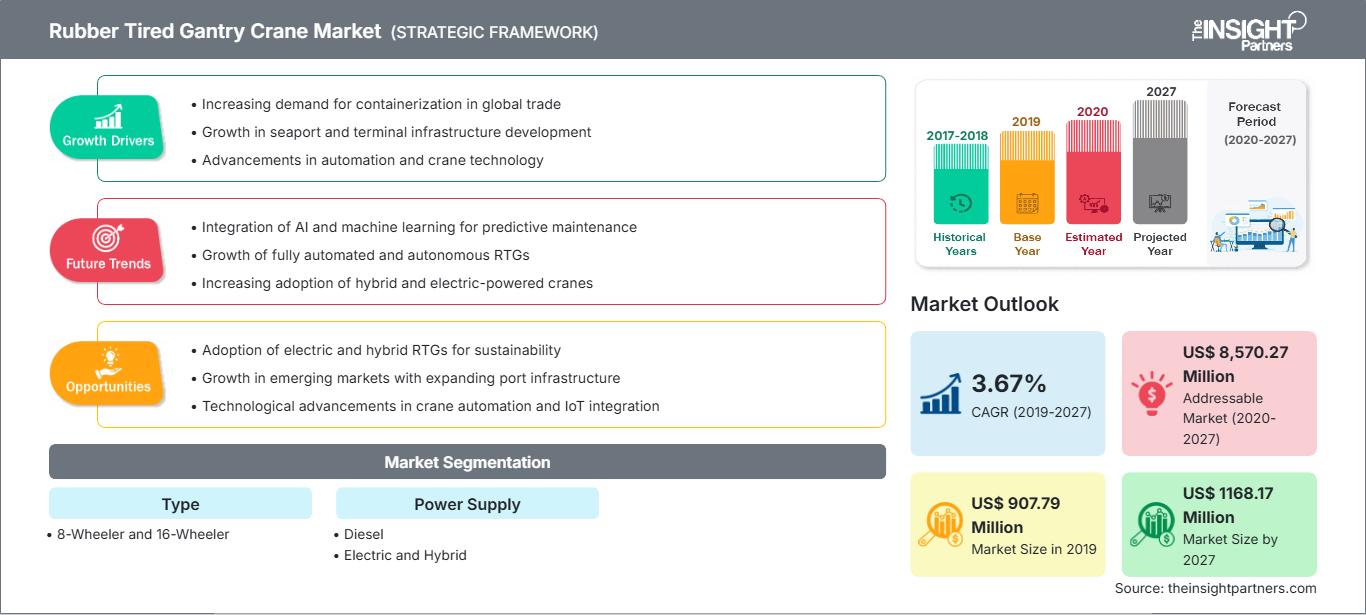
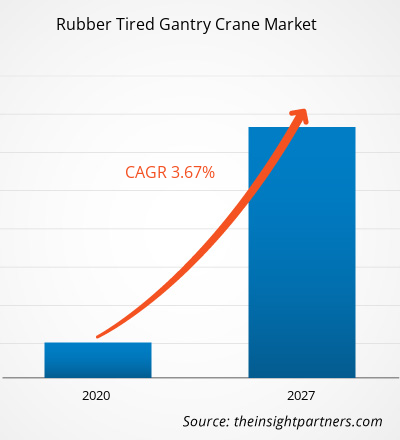
タイヤ式ガントリークレーン市場は、2019年に9億779万米ドルと評価され、2027年には1億1億6817万米ドルに達すると予測されています。また、2020年から2027年にかけて3.67%のCAGRで成長すると見込まれています。
これまで、発展途上国は原材料の供給国でしたが、貿易の形態が世界中の発展途上国に新たな役割を与えているため、タイヤ式ガントリークレーン市場は予測期間中に大幅な成長が見込まれています。市場の成長は主に海上貿易の需要の増加によるもので、中国を含む発展途上国は現在、海上による商品の重要な輸出入国として台頭しており、アジアが最大の貿易地域となっています。
さらに、タイヤ式ガントリークレーン市場は、港湾開発に対する政府の好ましい取り組みによって推進されています。港は、効率的に稼働すれば経済の車輪となります。今日では、港の目的は限定されているだけでなく、物流プラットフォームにまで広がっています。港は国の対外貿易の神経であるため、港の生産性は国際貿易において重要です。いくつかの政府政策が実施されており、それが今度は予測期間中に世界のゴムタイヤガントリークレーン市場を牽引するでしょう。
ヨーロッパは2019年にゴムタイヤガントリークレーン市場をリードし、予測期間中もその優位性を維持すると予想されています。ヨーロッパの港は、汚染と温室効果ガスの排出を削減するために電動RTGを採用しています。この地域の政府規制により、海上輸送における炭素排出量検証などの電動コンテナハンドリング機器の採用が可能になっています。ヨーロッパは、機械、車両、航空機、燃料、非鉄金属、繊維、化学薬品、衣料品、原油などの製品や資産の取引量が多いです。ヨーロッパは貿易額で第 1 位を占めており、そのおかげでこの地域はゴムタイヤ式ガントリークレーンの世界市場をリードしています。
要件に合わせてレポートをカスタマイズ
レポートの一部、国レベルの分析、Excelデータパックなどを含め、スタートアップ&大学向けに特別オファーや割引もご利用いただけます(無償)
ゴムタイヤ式ガントリークレーン市場: 戦略的洞察
-
このレポートの主要な市場動向を入手してください。この無料サンプルには、市場動向から見積もりや予測に至るまでのデータ分析が含まれます。
COVID-19危機は世界中の産業に影響を及ぼしており、世界経済は2020年と2021年に最悪の打撃を受けると予想されています。この流行は、民生用電子機器、半導体、自動車、ITインフラなどの一次産業に重大な混乱を引き起こしました。これらの産業はすべて、ゴムタイヤ式ガントリークレーンの主要な需要創出産業であるため、世界のゴムタイヤ式ガントリークレーン市場の成長に不可欠です。工場の閉鎖、渡航禁止、貿易禁止、国境封鎖は、さまざまな民生用電子製品と部品の製造と販売の両方に影響を与えています。世界の電子機器および半導体産業は、サプライチェーンの問題と製造の停止により深刻な混乱に直面している主要産業の1つです。
市場洞察:グリーンテクノロジーへの注目が高まる
参加者は、さまざまな地域での汚染と排出制限に関する厳格な政府規制のために、グリーンテクノロジーに注目しています。また、電動駆動装置を備えたRTGの使用は、消費電力を抑えるように最適化できます。クレーンにバッテリーハイブリッド技術を使用することで、燃料消費量と有害な化石燃料の排出を大幅に削減することに重点が置かれます。港湾における荷役機器からのディーゼル燃料排出量の約10%は、RTGクレーンによって排出されています。より効率的なRTGの実装は、クレーン操作の環境への影響を直接的に軽減します。この技術は、排出量と操作の環境影響を削減しながら効率を高める必要がある世界中の忙しい港湾運営者にとっての答えであり、温室効果ガス排出量の削減とターミナルでの騒音レベルの低減による運用コストの削減という追加のメリットも提供します。ゴムタイヤガントリークレーンまたはRTG用のフライホイールエネルギー貯蔵技術は、既存のRTGクレーンに後付けすることも、新規建造の一部として組み込むこともできます。フライホイールは、コンテナを下ろすときに発生するブレーキエネルギーを捕捉することで、燃料と排出量を削減します。
タイプベースの市場分析
タイプに基づいて、ゴムタイヤ式ガントリークレーンの世界市場は、8輪車と16輪車の2つのセグメントに分けられます。各モデルには、8輪車には8Wと8WA、16輪車には16Wと16WAの2種類があります。2つのモデルの主な違いは、振れ止めシステムの設計とガントリーホイールの数です。16タイヤRTGクレーンは、より広い移動領域を必要とします。したがって、狭いスペースでは使用できません。8タイヤRTGクレーンの方が、より狭いスペースに適しています。
電源ベースの市場分析
電源に基づいて、ゴムタイヤ式ガントリークレーンの世界市場は、ディーゼル、電気、ハイブリッドの3つのカテゴリに分類できます。世界的な排出量削減に向けた厳格な排出基準の導入、より効率的な電動車両の開発、そして燃料価格の高騰により、電動式およびハイブリッド式RTGクレーンの需要は世界中で高まると予想されます。電動式RTGクレーンは性能が向上し、大きな荷物を運ぶことができます。そのため、電動式およびハイブリッド式ゴムタイヤ式ガントリークレーンの人気は、今後さらに高まると予想されます。
製品開発は、企業が製品ポートフォリオを拡大するために最も一般的に採用する戦略の一つです。Anupam Industries Limited、Electromech Material Handling Systems (India) Pvt. Ltd.、Konecranes、Liebherr、Kalmarといった主要企業は、顧客基盤を拡大し、ゴムタイヤ式ガントリークレーン市場で大きなシェアを獲得するための戦略を実行しており、その結果、世界市場でブランド名を維持することに成功しています。
ゴムタイヤ式ガントリークレーン市場
予測期間全体を通してゴムタイヤ式ガントリークレーン市場に影響を与える地域的な動向と要因については、The Insight Partnersのアナリストが詳細に解説しています。このセクションでは、ゴムタイヤ式ガントリークレーン市場のセグメントと地域についても、北米、ヨーロッパ、アジア太平洋、中東・アフリカ、中南米に分けて解説しています。
ゴムタイヤ式ガントリークレーン市場レポートのスコープ
| レポート属性 | 詳細 |
|---|---|
| の市場規模 2019 | US$ 907.79 Million |
| 市場規模別 2027 | US$ 1168.17 Million |
| 世界的なCAGR (2019 - 2027) | 3.67% |
| 過去データ | 2017-2018 |
| 予測期間 | 2020-2027 |
| 対象セグメント |
By タイプ
|
| 対象地域と国 |
北米
|
| 市場リーダーと主要企業の概要 |
|
ゴムタイヤ式ガントリークレーン市場のプレーヤー密度:ビジネスダイナミクスへの影響を理解する
ゴムタイヤ式ガントリークレーン市場は、消費者嗜好の変化、技術の進歩、製品メリットへの認知度の向上といった要因によるエンドユーザー需要の増加に牽引され、急速に成長しています。需要の増加に伴い、企業は製品ラインナップの拡充、消費者ニーズへの対応、新たなトレンドの活用を進めており、これが市場成長のさらなる加速につながっています。
- 入手 ゴムタイヤ式ガントリークレーン市場 主要プレーヤーの概要
ゴムタイヤ式ガントリークレーン市場セグメンテーション:
タイプ別
- 8 輪車
- 16 輪車
電源別
- ディーゼル
- 電気式
- ハイブリッド
企業プロファイル
- Anupam Industries Limited
- ELECTROMECH MATERIAL HANDLING SYSTEMS (INDIA) PVT. LTD
- カルマル
- コネクレーンズ
- リープヘル
- Mi-Jack 製品。
- REVA INDUSTRIES LTD
- 上海振華重工業有限公司 (ZPMC)
- TNT クレーン & アンプ;リギング
- Sany グループ

Naveenは、カスタム、シンジケート、コンサルティングの各プロジェクトにおいて9年以上の実績を持つ、経験豊富な市場調査およびコンサルティングのプロフェッショナルです。現在はアソシエイトバイスプレジデントを務め、プロジェクトバリューチェーン全体にわたるステークホルダー管理を成功させ、100件以上の調査レポートと30件以上のコンサルティング案件を執筆しています。産業および政府機関のプロジェクトに幅広く携わり、クライアントの成功とデータに基づく意思決定に大きく貢献しています。
Naveenは、カルナータカ州VTUで電子通信工学の学位を取得し、マニパル大学でマーケティング&オペレーションズのMBAを取得しています。IEEEの会員として9年間活動し、会議や技術シンポジウムへの参加、セクションレベルおよび地域レベルでのボランティア活動に積極的に取り組んでいます。現職以前は、IndustryARCでアソシエイト戦略コンサルタント、Hewlett Packard(HP Global)で産業用サーバーコンサルタントを務めていました。
- 過去2年間の分析、基準年、CAGRによる予測(7年間)
- PEST分析とSWOT分析
- 市場規模価値/数量 - 世界、地域、国
- 業界と競争環境
- Excel データセット
お客様の声
Insight PartnersのSCADAシステム市場レポートは包括的で、現在のトレンドと将来の予測に関する貴重な洞察が含まれています。チームは終始、非常にプロフェッショナルで、対応が早く、サポートも充実していました。私たちは彼らのサービスに非常に満足しており、強くお勧めします。
ラン・ケデム パートナー, レアリテクノロジーズ株式会社非常に特殊なソフトウェア市場に関するレポートを依頼したところ、チームは数日でレポートを作成してくれました。情報は非常に関連性が高く、分かりやすくまとめられていました。その後、レポートにいくつか修正と追加を依頼しましたが、チームは非常に迅速に対応し、1週間も経たないうちに最終レポートを受け取ることができました。
ジャン=エルヴェ・ジェン 会長, フューチャー・アナリティカ重要な市場調査と予測のために、The Insight Partnersと協力しました。彼らは機会とリスクに関する明確な洞察を提供し、私たちの計画策定に役立ちました。彼らの調査は使いやすく、確かなデータに基づいており、賢明で自信に満ちた意思決定に役立ちました。彼らを強くお勧めします。
ピユーシュ・ナグパル 上級副社長, ハイビームグローバルInsight Partnersは、深い専門知識に基づき、洞察力に富み、構造化された市場調査を提供しました。チームは終始プロフェッショナルで、対応力も抜群でした。ユーザーフレンドリーなウェブサイトにより、業界レポートへのアクセスもスムーズでした。信頼性の高い高品質な調査サービスをお探しなら、Insight Partnersを強くお勧めします。
安達幸彦 最高経営責任者(CEO), ディープブルーLLC。The Insight Partnersから市場レポートを購入するのは今回が初めてです。最初は不安でしたが、ウェブサイトを見て、リスクを負ってでも購入してみようという気持ちになりました。レポートの品質とカスタマーサービスには大変満足しています。最初のレポートにはいくつか質問やコメントがありましたが、アナリストとメールで何度かやり取りした結果、戦略策定プロセスへのインプットとして活用できるレポートが完成しました。貴重なお時間を割いていただき、貴重な体験をさせていただき、誠にありがとうございました。他の方にもぜひお勧めしたいですし、今後さらに市場データが必要になった際には、まずThe Insight Partnersにご連絡させていただきます。
ジョン・スズキ 社長兼最高経営責任者、取締役, BKテクノロジーズナイジェリアの感染症IVD市場に関する情報提供依頼に対し、ご対応いただいた際、ご尽力とプロフェッショナルな姿勢に深く感謝申し上げます。忍耐強く、的確なアドバイスをいただき、また、最終的に取引成立に至った割引のご提供にも深く感謝申し上げます。今回の最初の出会いで得た強い印象のおかげで、今後もThe Insight Partnersとの連携を心待ちにしております。
チジオケ博士 オニア マネージングディレクター, パインクレストヘルスケア株式会社購入理由
- 情報に基づいた意思決定
- 市場動向の理解
- 競合分析
- 顧客インサイト
- 市場予測
- リスク軽減
- 戦略計画
- 投資の正当性
- 新興市場の特定
- マーケティング戦略の強化
- 業務効率の向上
- 規制動向への対応


 無料サンプルを入手 - ゴムタイヤ式ガントリークレーン市場