Strategie di mercato delle gru a portale gommate, principali attori, opportunità di crescita, analisi e previsioni entro il 2027
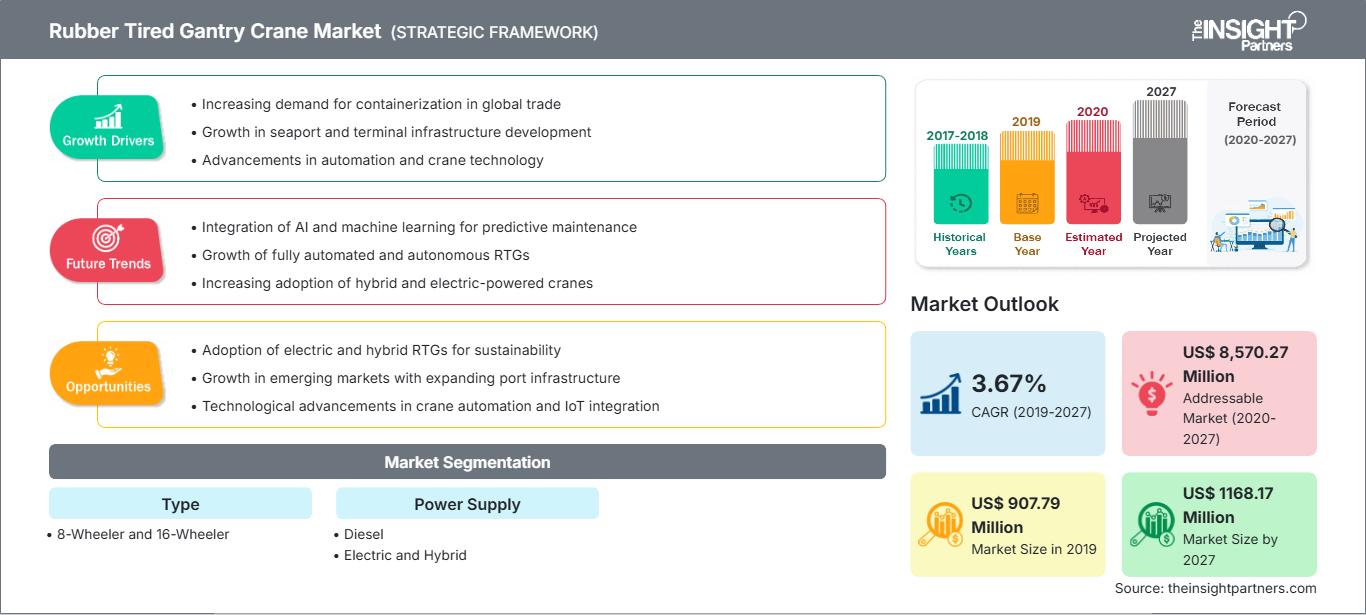
Dati storici : 2017-2018 | Anno base : 2019 | Periodo di previsione : 2020-2027Previsioni di mercato delle gru a portale gommate fino al 2027 - Impatto del COVID-19 e analisi globale per tipologia (veicoli a 8 e 16 ruote), alimentazione (diesel, elettrica e ibrida)
- Stato : Edito
- Codice del report : TIPRE00011041
- Categoria : Automotive e trasporti
- Numero di pagine : 145
- Formati di report disponibili :


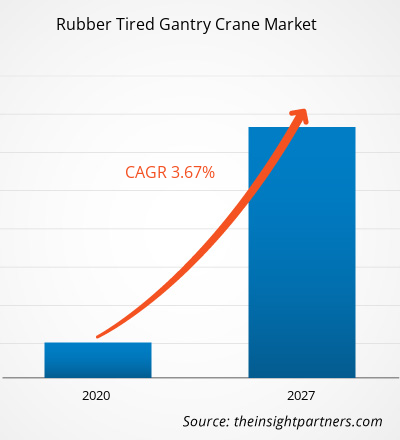
Il mercato delle gru a cavalletto su pneumatici è stato valutato a 907,79 milioni di dollari nel 2019 e si prevede che raggiungerà i 1.168,17 milioni di dollari entro il 2027; si prevede una crescita a un CAGR del 3,67% dal 2020 al 2027.
In passato, i paesi in via di sviluppo erano fornitori di materie prime; tuttavia, la struttura degli scambi commerciali ha assegnato un nuovo ruolo ai paesi in via di sviluppo in tutto il mondo, per cui si prevede che il mercato delle gru a cavalletto su pneumatici registrerà un tasso di crescita significativo durante il periodo di previsione. La crescita del mercato è principalmente attribuita all'aumento della domanda di commercio marittimo, poiché i paesi in via di sviluppo, tra cui la Cina, stanno emergendo come importanti importatori ed esportatori di merci via mare, con l'Asia come principale regione commerciale.
Inoltre, il mercato delle gru a cavalletto su pneumatici è trainato da iniziative governative favorevoli allo sviluppo dei porti. Un porto diventa un motore dell'economia se gestito in modo efficiente. Oggigiorno, la funzione di un porto non è solo limitata, ma si è estesa a quella di piattaforma logistica. La produttività di un porto è importante per il commercio internazionale, poiché un porto marittimo è il fulcro del commercio estero di un paese. Sono state intraprese diverse politiche governative che, a loro volta, guideranno il mercato globale delle gru a portale su pneumatici in gomma durante il periodo di previsione.
L'Europa ha guidato il mercato delle gru a portale su pneumatici in gomma nel 2019 e si prevede che manterrà la sua posizione dominante durante il periodo di previsione. I porti europei hanno adottato gru a portale elettriche per ridurre l'inquinamento e le emissioni di gas serra. Le normative governative in questa regione hanno consentito l'adozione di attrezzature elettriche per la movimentazione dei container, come la verifica delle emissioni di carbonio nel trasporto marittimo. L'Europa rappresenta un ampio volume di scambi di prodotti e beni, come macchinari, veicoli, aeromobili, carburanti, metalli non ferrosi, tessuti, prodotti chimici, abbigliamento e petrolio greggio. L'Europa si colloca al primo posto negli scambi commerciali, grazie al quale la regione è leader nel mercato globale delle gru a portale su pneumatici in gomma.
Personalizza questo rapporto in base alle tue esigenze
Potrai personalizzare gratuitamente qualsiasi rapporto, comprese parti di questo rapporto, o analisi a livello di paese, pacchetto dati Excel, oltre a usufruire di grandi offerte e sconti per start-up e università
Mercato delle gru a portale gommate: Approfondimenti strategici
-
Ottieni le principali tendenze chiave del mercato di questo rapporto.Questo campione GRATUITO includerà l'analisi dei dati, che vanno dalle tendenze di mercato alle stime e alle previsioni.
La crisi del COVID-19 sta colpendo i settori industriali di tutto il mondo e si prevede che l'economia globale subirà il colpo peggiore nel 2020 e nel 2021. L'epidemia ha creato notevoli interruzioni in settori primari come l'elettronica di consumo, i semiconduttori, l'automotive e le infrastrutture IT. Tutti questi settori sono cruciali per la crescita del mercato globale delle gru a cavalletto gommate, in quanto rappresentano i principali settori di generazione della domanda di gru a cavalletto gommate. Le chiusure delle fabbriche, i divieti di viaggio, i divieti commerciali e i blocchi alle frontiere hanno avuto un impatto sia sulla produzione che sulle vendite di vari prodotti e componenti elettronici di consumo. L'industria globale dell'elettronica e dei semiconduttori è uno dei principali settori che sta affrontando gravi interruzioni a causa di problemi nella catena di approvvigionamento e di fermi produttivi.
Market Insights: crescente attenzione verso la tecnologia verde
Gli operatori di mercato si concentrano sulla tecnologia verde a causa delle severe normative governative relative ai limiti di inquinamento ed emissioni in diverse regioni. Inoltre, l'uso di gru RTG dotate di azionamenti elettrici può essere ottimizzato per consumare meno energia. L'impiego della tecnologia ibrida a batteria sulle gru si concentrerà sulla riduzione sostanziale del consumo di carburante e delle emissioni nocive di combustibili fossili. Circa il 10% delle emissioni di gasolio delle attrezzature per la movimentazione delle merci nei porti è emesso dalle gru RTG; l'implementazione di RTG più efficienti riduce direttamente l'impatto ambientale delle operazioni delle gru. Questa tecnologia è una risposta per gli operatori portuali di tutto il mondo che necessitano di aumentare l'efficienza riducendo al contempo le emissioni e l'impatto ambientale delle loro operazioni, oltre a offrire ulteriori vantaggi in termini di riduzione dei costi operativi con minori emissioni di gas serra e minori livelli di rumore al terminal. Tecnologia di accumulo di energia a volano per gru a portale con pneumatici in gomma o RTG, che può essere installata su gru RTG esistenti o inclusa in una nuova costruzione. I volani riducono i consumi e le emissioni catturando l'energia frenante prodotta durante l'abbassamento di un container.
Approfondimenti di mercato basati sulla tipologia
In base alla tipologia, il mercato globale delle gru a portale gommate può essere suddiviso in due segmenti: a 8 ruote e a 16 ruote. Esistono due tipologie per ciascun modello: 8W e 8WA per le 8 ruote, e 16W e 16WA per le 16 ruote. Le principali differenze tra i due modelli sono il design del sistema anti-oscillazione e il numero di ruote del portale. Le gru RTG a 16 ruote richiedono un'area di corsa maggiore. Non possono quindi essere utilizzate in spazi ristretti. Le gru RTG a 8 ruote sono preferite per spazi più piccoli.
Approfondimenti di mercato basati sull'alimentazione
In base all'alimentazione, il mercato globale delle gru a portale gommate può essere classificato in tre categorie: diesel, elettriche e ibride. L'implementazione di rigorosi standard sulle emissioni per ridurre al minimo le emissioni globali e lo sviluppo di veicoli elettrici più efficienti, nonché l'aumento dei prezzi del carburante, probabilmente stimoleranno la domanda di gru RTG elettriche e ibride in tutto il mondo. Le gru RTG elettriche offrono prestazioni migliori e possono movimentare carichi considerevoli. Per questo motivo, si prevede che la preferenza per le gru a portale gommate con pneumatici elettrici e ibridi aumenterà a breve.
Lo sviluppo del prodotto è tra le strategie più comunemente adottate dalle aziende per espandere il proprio portafoglio prodotti. Anupam Industries Limited, Electromech Material Handling Systems (India) Pvt. Ltd, Konecranes, Liebherr e Kalmar sono tra i principali attori che stanno implementando strategie per ampliare la base clienti e acquisire una quota significativa nel mercato delle gru a portale gommate, il che, a sua volta, consente loro di mantenere il proprio marchio sul mercato globale.
Mercato delle gru a portale con pneumatici in gommaLe tendenze e i fattori regionali che hanno influenzato il mercato delle gru a cavalletto su gomma durante il periodo di previsione sono stati ampiamente spiegati dagli analisti di The Insight Partners. Questa sezione illustra anche i segmenti e la geografia del mercato delle gru a cavalletto su gomma in Nord America, Europa, Asia-Pacifico, Medio Oriente e Africa, America Meridionale e Centrale.
Ambito del rapporto di mercato sulle gru a portale gommate>
| Attributo del rapporto | Dettagli |
|---|---|
| Dimensioni del mercato in 2019 | US$ 907.79 Million |
| Dimensioni del mercato per 2027 | US$ 1168.17 Million |
| CAGR globale (2019 - 2027) | 3.67% |
| Dati storici | 2017-2018 |
| Periodo di previsione | 2020-2027 |
| Segmenti coperti |
By Tipo
|
| Regioni e paesi coperti |
Nord America
|
| Leader di mercato e profili aziendali chiave |
|
Densità degli operatori del mercato delle gru a portale gommate: comprendere il suo impatto sulle dinamiche aziendali
Il mercato delle gru a portale gommate è in rapida crescita, trainato dalla crescente domanda degli utenti finali, dovuta a fattori quali l'evoluzione delle preferenze dei consumatori, i progressi tecnologici e una maggiore consapevolezza dei vantaggi del prodotto. Con l'aumento della domanda, le aziende stanno ampliando la propria offerta, innovando per soddisfare le esigenze dei consumatori e sfruttando le tendenze emergenti, alimentando ulteriormente la crescita del mercato.
- Ottieni il Mercato delle gru a portale gommate Panoramica dei principali attori chiave
Segmentazione del mercato delle gru a portale gommate:
Per tipo
- Veicolo a 8 ruote
- Veicolo a 16 ruote
Per alimentazione
- Diesel
- Elettrico
- Ibrido
Profili aziendali
- Anupam Industries Limited
- ELECTROMECH MATERIAL HANDLING SYSTEMS (INDIA) PVT. LTD
- Kalmar
- Konecranes
- Liebherr
- Mi-Jack Products.
- REVA INDUSTRIES LTD
- Shanghai Zhenhua Heavy Industries CO., Ltd. (ZPMC)
- TNT Crane & Attrezzatura
- Sany Group

Naveen è un professionista esperto in ricerche di mercato e consulenza con oltre 9 anni di esperienza in progetti personalizzati, sindacati e di consulenza. Attualmente Vicepresidente Associato, ha gestito con successo gli stakeholder lungo l'intera catena del valore del progetto e ha redatto oltre 100 report di ricerca e oltre 30 incarichi di consulenza. Il suo lavoro spazia tra progetti industriali e governativi, contribuendo in modo significativo al successo dei clienti e al processo decisionale basato sui dati.
Naveen ha conseguito una laurea in Ingegneria Elettronica e delle Comunicazioni presso la VTU, Karnataka, e un MBA in Marketing e Operations presso la Manipal University. È membro attivo dell'IEEE da 9 anni, partecipando a conferenze, simposi tecnici e svolgendo attività di volontariato sia a livello di sezione che regionale. Prima del suo attuale ruolo, ha lavorato come Consulente Strategico Associato presso IndustryARC e come Consulente Server Industriali presso Hewlett Packard (HP Global).
- Analisi storica (2 anni), anno base, previsione (7 anni) con CAGR
- Analisi PEST e SWOT
- Valore/volume delle dimensioni del mercato - Globale, Regionale, Nazionale
- Industria e panorama competitivo
- Set di dati Excel
Testimonianze
Il report di mercato sui sistemi SCADA di Insight Partners è completo, con preziosi spunti sulle tendenze attuali e sulle previsioni future. Il team si è dimostrato altamente professionale, reattivo e disponibile in ogni fase del progetto. Siamo molto soddisfatti e consigliamo vivamente i loro servizi.
RAN KEDEM Partner, Reali Technologies LTDsHo richiesto un report su un mercato software molto specifico e il team lo ha prodotto in pochi giorni. Le informazioni erano molto pertinenti e ben presentate. Ho quindi richiesto alcune modifiche e aggiunte al report. Il team è stato ancora una volta molto reattivo e ho ricevuto il report finale in meno di una settimana.
JEAN-HERVE JENN Presidente, Future AnalyticaAbbiamo collaborato con The Insight Partners per un importante studio di mercato e una previsione. Ci hanno fornito informazioni chiare su opportunità e rischi, che ci hanno aiutato a definire i nostri piani. La loro ricerca è stata facile da usare e basata su dati solidi. Ci ha aiutato a prendere decisioni intelligenti e consapevoli. Li consigliamo vivamente.
PIYUSH NAGPAL Vicepresidente senior, Abbaglianti globaliInsight Partners ha fornito ricerche di mercato approfondite e ben strutturate, con una solida competenza nel settore. Il loro team si è dimostrato professionale e reattivo in ogni fase. Il sito web intuitivo ha reso l'accesso ai report di settore semplice e immediato. Li consigliamo vivamente per servizi di ricerca affidabili e di alta qualità.
YUKIHIKO ADACHI Amministratore delegato, Deep Blue, LLC.Questa è la prima volta che acquisto un report di mercato da The Insight Partners. Sebbene inizialmente fossi indeciso, ho visitato il loro sito web e mi sono sentito più a mio agio nell'acquistare un report di mercato. Sono completamente soddisfatto della qualità del report e del servizio clienti. Avevo diverse domande e commenti sul report iniziale, ma dopo un paio di conversazioni via email con il loro analista credo di avere un report che posso utilizzare come input per il nostro processo di pianificazione strategica. Grazie mille per aver dedicato del tempo extra e aver reso questa esperienza positiva. Consiglierò sicuramente il vostro servizio ad altri e sarete la mia prima persona a cui rivolgermi quando avremo bisogno di ulteriori dati di mercato.
GIOVANNI SUZUKI Presidente e Amministratore Delegato, Consigliere di Amministrazione, Tecnologie BKDesidero esprimere la mia gratitudine per il supporto e la professionalità dimostrati nel rispondere alla mia richiesta di informazioni sul mercato dei dispositivi medici in vitro per malattie infettive in Nigeria. Apprezzo la vostra pazienza, la vostra guida e la vostra disponibilità a offrirmi uno sconto, che alla fine ci ha permesso di concludere l'affare. Non vedo l'ora di collaborare con The Insight Partners in futuro, grazie anche all'impressione che mi avete lasciato dopo questo primo incontro.
Dott. Chijioke AMMINISTRATORE DELEGATO DI ONYIA, PineCrest Healthcare Ltd.Motivo dell'acquisto
- Processo decisionale informato
- Comprensione delle dinamiche di mercato
- Analisi competitiva
- Analisi dei clienti
- Previsioni di mercato
- Mitigazione del rischio
- Pianificazione strategica
- Giustificazione degli investimenti
- Identificazione dei mercati emergenti
- Miglioramento delle strategie di marketing
- Aumento dell'efficienza operativa
- Allineamento alle tendenze normative


Sblocca sconti esclusivi sui report
Richiedi ora


 Ottieni un campione gratuito per - Mercato delle gru a portale gommate