スマート通勤市場の概要、成長、傾向、分析、調査レポート(2021-2028)
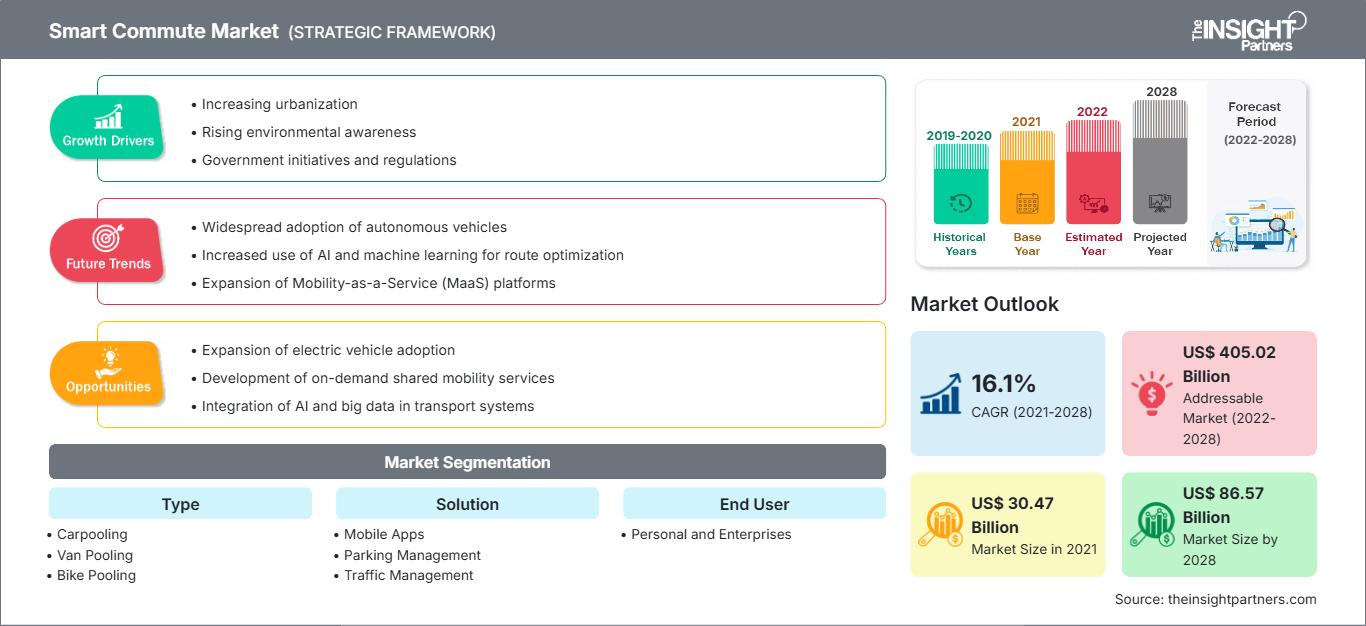
過去データ : 2019-2020 | 基準年 : 2021 | 予測期間 : 2022-20282028年までのスマート通勤市場予測 - COVID-19の影響とタイプ別(カープーリング、バンプーリング、バイクプーリング、地下鉄など)、ソリューション別(モバイルアプリ、駐車場管理、交通管理など)、エンドユーザー別(個人および企業)のグローバル分析
- ステータス : 出版
- レポートコード : TIPRE00009536
- カテゴリー : 自動車・輸送
- ページ数 : 155
- 利用可能なレポート形式 :


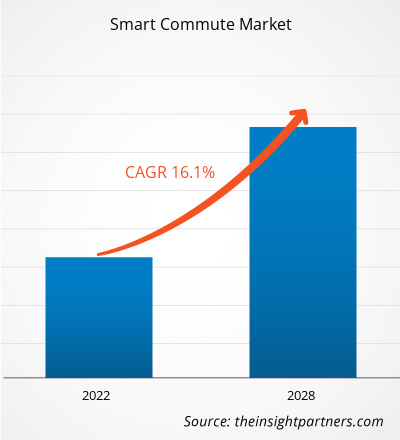
スマート通勤市場は、2021年の304億6,949万米ドルから2028年には865億6,873万米ドルに成長すると予想されており、2021年から2028年にかけて年平均成長率(CAGR)16.1%で成長すると推定されています。
スマート通勤とは、相乗り、バン乗り、自転車、サイクリスト、地下鉄を利用して定期的に移動することを意味します。公共交通機関の会社、政府、その他の関係者は、スマートな移動を考慮した包括的な戦略を策定し、それを一般の人々と共有することで、大都市圏でより強力な交通手段を構築しています。スマート通勤は、交通渋滞を緩和し、温室効果ガスの排出を削減することで、環境にプラスの影響を与えます。
相乗り、自転車シェアリング、バン乗りなど、環境に優しい通勤方法は、スマート通勤サービスを通じて利用できます。スマート通勤サービスは、オフィスワーカーに、交通渋滞と交通費を削減する、より効果的な通勤経路を選択するための交通手段の選択肢を提供します。スマート通勤市場の成長を後押しする要因の一つは、都市居住者の増加とそれに伴う世代交代の上昇です。シェアリング交通サービスは世界的に受け入れられ、排出量の削減につながることから、政府や環境団体からも推奨されています。これにより自家用車の台数も減少するため、今後数年間でスマート通勤市場の成長が促進されると予想されています。
北米では、交通渋滞の緩和と環境破壊の防止につながる相乗りサービスがオフィス通勤者にますます好まれるようになり、スマート通勤のニーズが高まっています。さらに、観光産業の発展、技術の進歩、そして政府の好ましい政策も、北米のスマート通勤市場の成長を牽引する要因となっています。ヨーロッパでは、モビリティ・アズ・ア・サービスの台頭とライドシェアサービスの利用者増加が、市場プレーヤーにとって大きな収益機会を生み出すと予想されています。
ヨーロッパでは、地球温暖化、道路渋滞、そして外国エネルギーへの依存に対する懸念の高まりから、スマート通勤者の人気が高まっています。 2012 年に導入された、一人乗りの自動車に通行料を課す慣行により、欧州の消費者によるスマート通勤の利用が大幅に増加しました。
要件に合わせてレポートをカスタマイズ
レポートの一部、国レベルの分析、Excelデータパックなどを含め、スタートアップ&大学向けに特別オファーや割引もご利用いただけます(無償)
スマート通勤市場: 戦略的洞察
-
このレポートの主要な市場動向を入手してください。この無料サンプルには、市場動向から見積もりや予測に至るまでのデータ分析が含まれます。
スマート通勤市場へのCOVID-19パンデミックの影響
COVID-19の発生は、運輸部門に大きな影響を与えました。2020年には、COVID-19の影響で、相乗りやバンプーリングサービスの需要が世界的に減少しました。世界のスマート通勤市場は、ロックダウンや、規制が解除された後も顧客がライドシェアサービスを利用することに消極的だったことなどにより、2019年と比較して2020年の収益創出が大幅に減少しました。ライドシェア企業は常に、安全性と衛生面でドライバーと乗客の信頼を維持しようと努めています。
市場分析–スマート通勤市場
モビリティ・アズ・ア・サービスの拡大
自動車を購入できない人も、モビリティサービスを通じてシームレスな移動を体験できます。運輸統計局によると、年間15,000キロメートルの走行を想定した場合、自動車の所有・運用にかかる平均コストは約8,858ドルです。モビリティ・アズ・ア・サービスは、相乗りやライドシェアなどの交通サービスの利用を最大化することで、ユーザーのこれらのコストを削減します。また、都市部の交通渋滞と自動車の総排出量を削減します。結果として、デジタル技術を活用した相乗りやライドシェアは、交通需要を効率的に管理し、自家用車を所有するよりも便利で環境に優しい選択肢を提供します。さらに、統計によると、現在世界人口の55%が都市に居住しており、2050年までに約68%が都市に居住すると推定されています。急速な都市化はすでに交通渋滞を引き起こしています。 MaaS(モビリティ・アズ・ア・サービス)のコンセプトは、既存の公共交通機関と民間の交通インフラをより有効に活用することで、交通渋滞を緩和するためのより良い選択肢となる可能性があります。スマートシティの交通をより速く、より安価に、そしてより便利に処理するための効果的なソリューションに対する切迫した需要が、2028年までにMaaS市場の成長を促進すると予想されています。したがって、MaaS(モビリティ・アズ・ア・サービス)の増加傾向は、世界のスマート通勤市場の成長を促進すると予想されます。
タイプベースのスマート通勤市場の洞察
タイプに基づいて、スマート通勤市場は、相乗り、バンプーリング、自転車プーリング、地下鉄、その他に分類されます。相乗りセグメントは、世界のスマート通勤市場で大きなシェアを占めると予想され、最高のCAGRで成長すると予想されています。スマート通勤とは、相乗り、バン相乗り、自転車、サイクリスト、地下鉄などを利用して、ある地点から別の地点まで定期的に移動することを意味します。
ソリューションベースのスマート通勤市場に関する洞察
ソリューションに基づいて、スマート通勤市場は、モバイルアプリ、駐車場管理、交通管理、その他に分類されます。モバイルアプリセグメントは、世界のスマート通勤市場で大きなシェアを占めると予想され、最も高いCAGRで成長すると予想されています。移動時間、コスト、および車両の排出量を削減するために、自動車移動モードでのモバイルアプリケーションの使用が増加しています。
エンドユーザーベースのスマート通勤市場に関する洞察
エンドユーザーに基づいて、スマート通勤市場は個人と企業に分かれています。企業セグメントは、世界のスマート通勤市場で大きなシェアを占めると予想され、より高いCAGRで成長すると予想されています。
スマート通勤市場
予測期間を通じてスマート通勤市場に影響を与える地域的な傾向と要因については、The Insight Partnersのアナリストが詳細に説明しています。このセクションでは、北米、ヨーロッパ、アジア太平洋、中東・アフリカ、中南米におけるスマート通勤市場のセグメントと地域についても説明します。
スマート通勤市場レポートの範囲
| レポート属性 | 詳細 |
|---|---|
| の市場規模 2021 | US$ 30.47 Billion |
| 市場規模別 2028 | US$ 86.57 Billion |
| 世界的なCAGR (2021 - 2028) | 16.1% |
| 過去データ | 2019-2020 |
| 予測期間 | 2022-2028 |
| 対象セグメント |
By タイプ
|
| 対象地域と国 |
北米
|
| 市場リーダーと主要企業の概要 |
|
スマート通勤市場のプレーヤー密度:ビジネスダイナミクスへの影響を理解する
スマート通勤市場は、消費者の嗜好の変化、技術の進歩、製品メリットへの認知度の高まりといった要因により、エンドユーザーの需要が高まり、急速に成長しています。需要が高まるにつれ、企業は提供内容を拡大し、消費者ニーズを満たすための革新を進め、新たなトレンドを捉えることで、市場の成長をさらに加速させています。
- 入手 スマート通勤市場 主要プレーヤーの概要
スマート通勤市場で事業を展開している企業は、高度で効率的な製品の開発に主に焦点を当てています。
- 2022年1月、マルチモーダルモビリティ企業のTummocは、2022年までにデリーやムンバイなど10都市に事業を拡大する予定です。
- 2021年4月、都市を拠点とするモビリティ企業は、バス、地下鉄、Uber、Yulu、その他のラストマイルの選択肢を組み合わせて、ルートと価格を初めて統合するアプリプラットフォームを構築しました。
企業紹介
:- BlaBlaCar
- CommuteSmart
- Enterprise Holdings Inc
- ePoolers Technologies Pvt. Ltd
- Golden Concord Holdings Limited
- Oakland Smart Commute
- Quick Ride
- Transhelp Technologies Pvt Ltd
- Uber Technologies Inc.
- Smart Commute

Naveenは、カスタム、シンジケート、コンサルティングの各プロジェクトにおいて9年以上の実績を持つ、経験豊富な市場調査およびコンサルティングのプロフェッショナルです。現在はアソシエイトバイスプレジデントを務め、プロジェクトバリューチェーン全体にわたるステークホルダー管理を成功させ、100件以上の調査レポートと30件以上のコンサルティング案件を執筆しています。産業および政府機関のプロジェクトに幅広く携わり、クライアントの成功とデータに基づく意思決定に大きく貢献しています。
Naveenは、カルナータカ州VTUで電子通信工学の学位を取得し、マニパル大学でマーケティング&オペレーションズのMBAを取得しています。IEEEの会員として9年間活動し、会議や技術シンポジウムへの参加、セクションレベルおよび地域レベルでのボランティア活動に積極的に取り組んでいます。現職以前は、IndustryARCでアソシエイト戦略コンサルタント、Hewlett Packard(HP Global)で産業用サーバーコンサルタントを務めていました。
- 過去2年間の分析、基準年、CAGRによる予測(7年間)
- PEST分析とSWOT分析
- 市場規模価値/数量 - 世界、地域、国
- 業界と競争環境
- Excel データセット
お客様の声
Insight PartnersのSCADAシステム市場レポートは包括的で、現在のトレンドと将来の予測に関する貴重な洞察が含まれています。チームは終始、非常にプロフェッショナルで、対応が早く、サポートも充実していました。私たちは彼らのサービスに非常に満足しており、強くお勧めします。
ラン・ケデム パートナー, レアリテクノロジーズ株式会社非常に特殊なソフトウェア市場に関するレポートを依頼したところ、チームは数日でレポートを作成してくれました。情報は非常に関連性が高く、分かりやすくまとめられていました。その後、レポートにいくつか修正と追加を依頼しましたが、チームは非常に迅速に対応し、1週間も経たないうちに最終レポートを受け取ることができました。
ジャン=エルヴェ・ジェン 会長, フューチャー・アナリティカ重要な市場調査と予測のために、The Insight Partnersと協力しました。彼らは機会とリスクに関する明確な洞察を提供し、私たちの計画策定に役立ちました。彼らの調査は使いやすく、確かなデータに基づいており、賢明で自信に満ちた意思決定に役立ちました。彼らを強くお勧めします。
ピユーシュ・ナグパル 上級副社長, ハイビームグローバルInsight Partnersは、深い専門知識に基づき、洞察力に富み、構造化された市場調査を提供しました。チームは終始プロフェッショナルで、対応力も抜群でした。ユーザーフレンドリーなウェブサイトにより、業界レポートへのアクセスもスムーズでした。信頼性の高い高品質な調査サービスをお探しなら、Insight Partnersを強くお勧めします。
安達幸彦 最高経営責任者(CEO), ディープブルーLLC。The Insight Partnersから市場レポートを購入するのは今回が初めてです。最初は不安でしたが、ウェブサイトを見て、リスクを負ってでも購入してみようという気持ちになりました。レポートの品質とカスタマーサービスには大変満足しています。最初のレポートにはいくつか質問やコメントがありましたが、アナリストとメールで何度かやり取りした結果、戦略策定プロセスへのインプットとして活用できるレポートが完成しました。貴重なお時間を割いていただき、貴重な体験をさせていただき、誠にありがとうございました。他の方にもぜひお勧めしたいですし、今後さらに市場データが必要になった際には、まずThe Insight Partnersにご連絡させていただきます。
ジョン・スズキ 社長兼最高経営責任者、取締役, BKテクノロジーズナイジェリアの感染症IVD市場に関する情報提供依頼に対し、ご対応いただいた際、ご尽力とプロフェッショナルな姿勢に深く感謝申し上げます。忍耐強く、的確なアドバイスをいただき、また、最終的に取引成立に至った割引のご提供にも深く感謝申し上げます。今回の最初の出会いで得た強い印象のおかげで、今後もThe Insight Partnersとの連携を心待ちにしております。
チジオケ博士 オニア マネージングディレクター, パインクレストヘルスケア株式会社購入理由
- 情報に基づいた意思決定
- 市場動向の理解
- 競合分析
- 顧客インサイト
- 市場予測
- リスク軽減
- 戦略計画
- 投資の正当性
- 新興市場の特定
- マーケティング戦略の強化
- 業務効率の向上
- 規制動向への対応


 無料サンプルを入手 - スマート通勤市場